




Abstract
Machine learning provides a probabilistic framework for metabolic pathway inference from genomic sequence information at different levels of complexity and completion. However, several challenges, including pathway features engineering, multiple mapping of enzymatic reactions, and emergent or distributed metabolism within populations or communities of cells, can limit prediction performance. In this article, we present triUMPF (triple non-negative matrix factorization [NMF] with community detection for metabolic pathway inference), which combines three stages of NMF to capture myriad relationships between enzymes and pathways within a graph network. This is followed by community detection to extract a higher-order structure based on the clustering of vertices that share similar statistical properties. We evaluated triUMPF performance by using experimental datasets manifesting diverse multi-label properties, including Tier 1 genomes from the BioCyc collection of organismal Pathway/Genome Databases and low complexity microbial communities. Resulting performance metrics equaled or exceeded other prediction methods on organismal genomes with improved precision on multi-organismal datasets.
1. Introduction
Pathway reconstruction from genomic sequence information is an essential step in describing the metabolic potential of cells at the individual, population, and community levels of biological organization (Konwar et al., 2013; Hanson et al., 2014; Basher et al., 2020). Resulting pathway representations provide a foundation for defining regulatory processes, modeling metabolite flux, and engineering cells and cellular consortia for defined process outcomes (Hahn et al., 2016; Lawson et al., 2019). The integral nature of the pathway prediction problem has prompted both gene-centric, for example, mapping annotated proteins onto known pathways by using a reference database based on sequence homology, and heuristic or rule-based pathway-centric approaches, including PathoLogic (Karp et al., 2016) and MinPath (Ye and Doak, 2009). In parallel, the development of trusted sources of curated metabolic pathway information, including the Kyoto Encyclopedia of Genes and Genomes (KEGG) (Kanehisa et al., 2017) and MetaCyc (Caspi et al., 2016b), provides training data for the design of more flexible machine learning (ML) algorithms for pathway inference. Although ML approaches have been adopted widely in metabolomics research (Carbonell et al., 2018; Toubiana et al., 2019), they have gained less traction when applied to predicting pathways directly from annotated gene lists.
Dale et al. (2010) conducted the first in-depth exploration of ML approaches for pathway prediction using Tier 1 (T1) organismal Pathway/Genome Databases (PGDBs) (Caspi et al., 2016a) from the BioCyc collection randomly divided into training and test sets. Features were developed based on rule-sets used by the PathoLogic algorithm in Pathway Tools to construct PGDBs (Karp et al., 2016). Resulting performance metrics indicated that standard ML approaches rivaled PathoLogic performance with the added benefit of probability scores (Dale et al., 2010). More recently, Basher et al. (2020) developed multi-label based on logistic regression for pathway prediction (mlLGPR), a multi-label classification approach that uses logistic regression and feature vectors inspired by the work of Dale et al. (2010) to predict metabolic pathways from genomic sequence information at different levels of complexity and completion.
Although mlLGPR performed effectively on organismal genomes, pathway prediction outcomes for multi-organismal datasets were less optimal due in part to missing or noisy feature information. In an effort to solve this problem, Basher and Hallam (2020) evaluated the use of representational learning methods to learn a neural embedding-based low-dimensional space of metabolic features based on a three-layered network architecture consisting of compounds, enzymes, and pathways. Learned feature vectors improved pathway prediction performance on organismal genomes and motivated the use of graphical models for multi-organismal features engineering.
Here, we describe triple non-negative matrix factorization (NMF) with community detection for metabolic pathway inference (triUMPF) combining three stages of NMF to capture relationships between enzymes and pathways within a network (Fu et al., 2019) followed by community detection to extract a higher-order network structure (Fortunato and Hric, 2016). The NMF is a data reduction and exploration method in which the original and factorized matrices have the property of non-negative elements with reduced ranks or features (Fu et al., 2019). In contrast to other dimension reduction methods, such as principal component analysis (Bro and Smilde, 2014), NMF both reduces the number of features and preserves information needed to reconstruct the original data (Yang and Michailidis, 2015). This has important implications for noise robust feature extraction from sparse matrices, including datasets associated with gene expression analysis and pathway prediction (Yang and Michailidis, 2015).
For pathway prediction, triUMPF uses three graphs, one representing associations between pathways and enzymes (P2E) indicated by enzyme commission (EC) numbers (Bairoch, 2000), one representing interactions between enzymes, and another representing interactions between pathways. The two interaction graphs adopt the subnetworks concept introduced in BiomeNet (Shafiei et al., 2014) and MetaNetSim (Jiao et al., 2013), where a subnetwork is a linked series of connected nodes (e.g., reactions and pathways). In the literature, a subnetwork is commonly referred to as a community (Rossi et al., 2020), which defines a set of densely connected nodes within a subnetwork. It is important to emphasize that unless otherwise indicated, the use of the term “community” in this work refers to a subnetwork community based on statistical properties of a network rather than a community of organisms. Community detection is performed on both interaction graphs (pathways and enzymes) to identify subnetworks among pathways.
We evaluated triUMPFs prediction performance in relation to other methods, including MinPath, PathoLogic, and mlLGPR on a set of T1 PGDBs, low complexity microbial communities including symbiont genomes encoding distributed metabolic pathways for amino acid biosynthesis (McCutcheon and Von Dohlen, 2011), genomes used in the Critical Assessment of Metagenome Interpretation (CAMI) initiative (Sczyrba et al., 2017), and whole genome shotgun sequences from the Hawaii Ocean Time Series (HOTS) (Stewart et al., 2011) following information hierarchy-based benchmarks initially developed for mlLGPR enabling a more robust comparison between pathway prediction methods (Basher et al., 2020).
2. Methods
In this section, we provide a general description of triUMPF components, presented in Figure 1. At the very beginning, MetaCyc is applied to: (i) extract three association matrices, indicated in step Figure 1a, one representing associations between P2E indicated by EC numbers (McDonald et al., 2009), one representing interactions between enzymes (E2E), and another representing interactions between pathways (P2P), and (ii) automatically generate features corresponding pathways and enzymes (or EC) from pathway2vec (Basher and Hallam, 2020) in Figure 1b. Then, triUMPF is trained in two phases: (i) decomposition of the pathway EC association matrix in Figure 1c, and (ii) subnetwork or community reconstruction while, simultaneously, learning optimal multi-label pathway parameters in Figure 1d–f. Later, we discuss these two phases while the analytical expressions of triUMPF are explained in Sections 5.1–5.3.
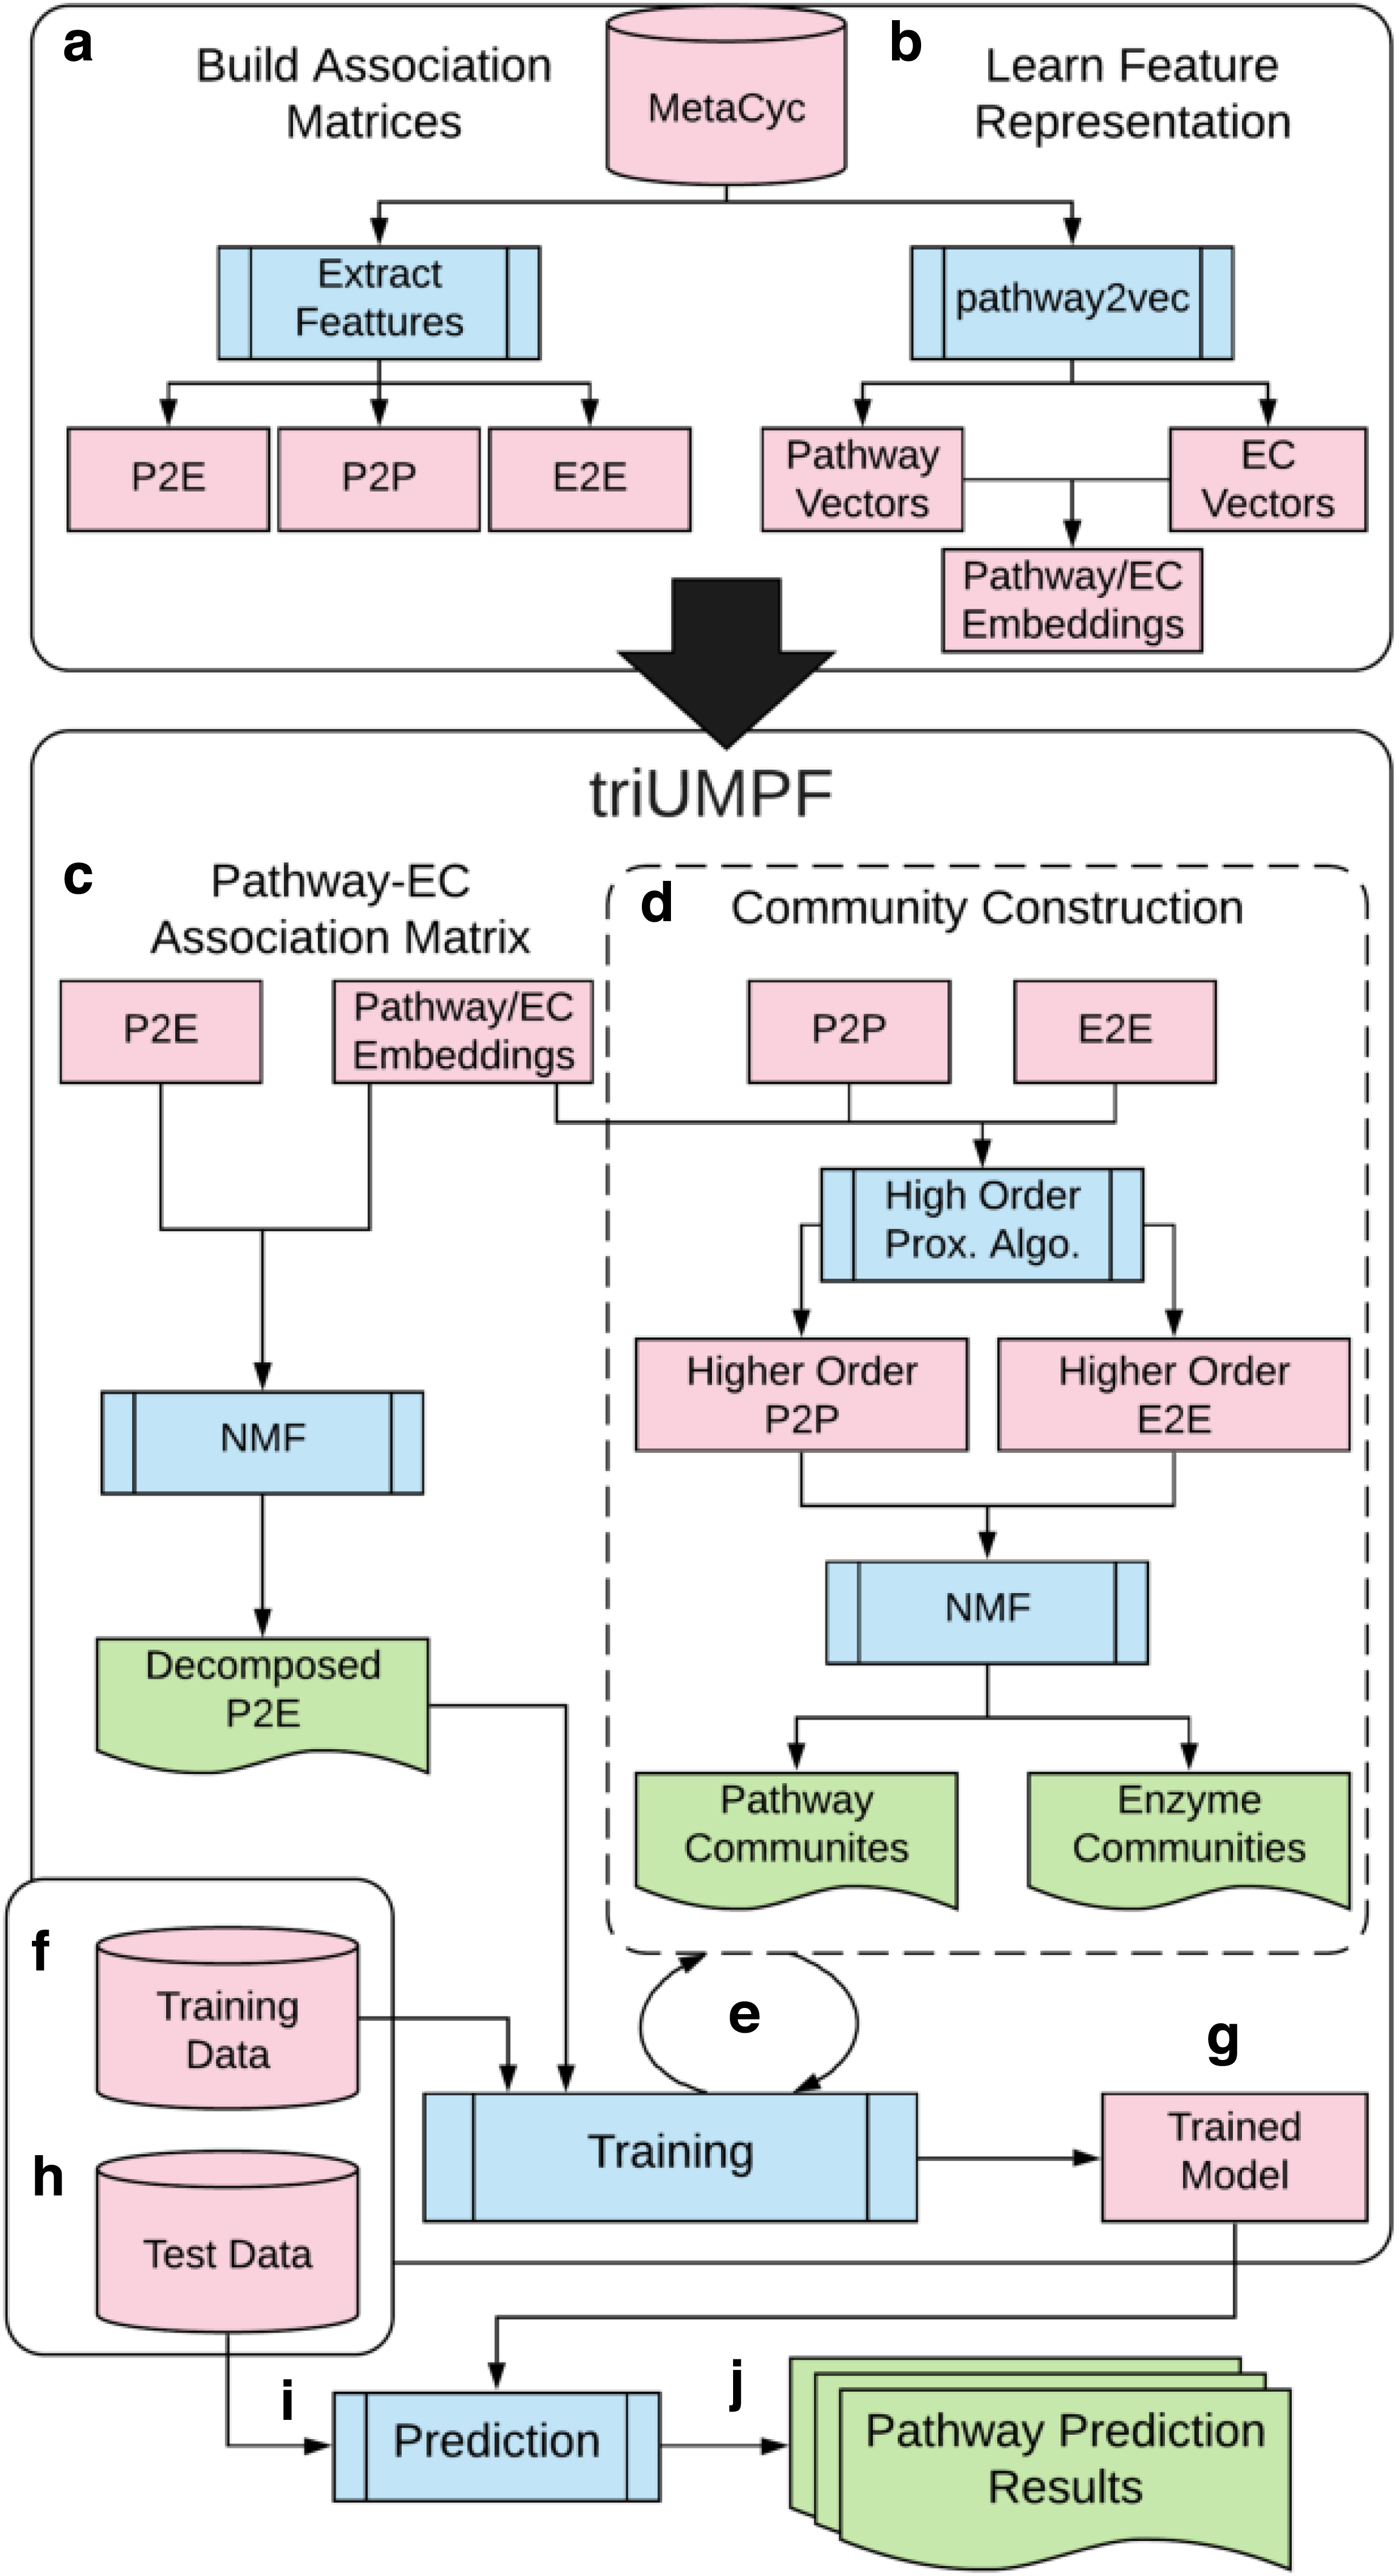
A workflow diagram showing the proposed triUMPF method. Initially, triUMPF takes the P2E information
2.1. Decomposing the pathway EC association matrix
Inspired by the idea of NMF, we decompose the P2E association matrix to recover low-dimensional latent factor matrices (Fu et al., 2019). Unlike previous application of NMF to biological data (Natarajan and Dhillon, 2014), triUMPF incorporates constraints into the matrix decomposition process. Formally, let
2.2. Community reconstruction and multi-label learning
The community detection problem (Li et al., 2019; Rossi et al., 2020) is the task of discovering distinct groups of nodes that are densely connected. During this phase, triUMPF performs community detection to guide the learning process for pathways using binary P2P (

where
3. Results
We evaluated triUMPF performance across multiple datasets spanning the genomic information hierarchy (Basher et al., 2020): (i) T1 golden consisting of EcoCyc, HumanCyc, AraCyc, YeastCyc, LeishCyc, and TrypanoCyc; (ii) three Escherichia coli genomes composed of E. coli K-12 substr. MG1655 (TAX-511145), uropathogenic E. coli str. CFT073 (TAX-199310), and enterohemorrhagic E. coli O157:H7 str. EDL933 (TAX-155864); (iii) BioCyc (v20.5 T2 & 3) (Caspi et al., 2016a) composed of 9255 PGDBs with 1463 pathways constructed using Pathway Tools v21 (Karp et al., 2016); (iv) symbionts genomes of Moranella (GenBank NC-015735) and Tremblaya (GenBank NC-015736) encoding distributed metabolic pathways for amino acid biosynthesis (McCutcheon and Von Dohlen, 2011); (v) CAMI initiative low complexity dataset consisting of 40 genomes (Sczyrba et al., 2017); and (vi) whole genome shotgun sequences from the HOTS at 25 m, 75 m, 110 m (sunlit), and 500 m (dark) ocean depth intervals (Stewart et al., 2011). We applied BioCyc v20.5 to train triUMPF while the remaining datasets were used to report performance results. Since BioCyc v20.5 contains less than 1460 trainable pathways, we applied pathway2vec with RUST-norm (or “crt”) configuration to improve prediction (Section 5.4.3). In general, statistics about these datasets are summarized in Table 4.
For comparative analysis, triUMPFs performance on T1 golden datasets was compared with three pathway prediction methods: (i) MinPath version 1.2 (Ye and Doak, 2009), which uses integer programming to recover a conserved set of pathways from a list of enzymatic reactions; (ii) PathoLogic version 21 (Karp et al., 2016), which is a symbolic approach that uses a set of manually curated rules to predict pathways; and (iii) mlLGPR, which uses supervised multi-label classification and rich feature information to predict pathways from a list of enzymatic reactions (Basher et al., 2020). In addition to testing on T1 golden datasets, triUMPF performance was compared with PathoLogic on three E. coli genomes and with PathoLogic and mlLGPR on mealybug symbionts, CAMI low complexity, and HOTS multi-organismal datasets. The following metrics were used to report on performance of pathway prediction algorithms, including: average precision, average recall, average F1 score (F1), and Hamming loss as described in Basher et al. (2020). For experimental settings and additional tests, see Sections 5.4 and 5.5.
3.1. T1 golden data
As shown in Table 1, triUMPF achieved competitive performance against the other methods in terms of average precision with optimal performance on EcoCyc (0.8662). However, with respect to average F1 scores, it underperformed on HumanCyc and AraCyc, yielding average F1 scores of 0.4703 and 0.4775, respectively (Table 5). Since the observed number of pathway labels in BioCyc v20.5 is 1463 pathways (a subset of 2526 MetaCyc pathways) (as explained in Section 3), triUMPF trained with these data (using features from pathway2vec) (Basher and Hallam, 2020) cannot infer pathways outside the trainable pathways. Consequently, this has translated into low average F1 scores of HumanCyc and AraCyc. A possible treatment would be incorporating additional PGDBs containing more pathways to train triUMPF. However, this would require substantially building many PGDBs from organismal genomes or using multiple versions of BioCyc data. A detailed analysis on this is left for future work.
Average Precision of Each Comparing Algorithm on Six Golden T1 Data
Values in boldface represent the best performance score.
3.2. Three E. coli data
It should be recalled that community detection (Section 2.2) was used to guide the multi-label learning process. To demonstrate the influence of communities on pathway prediction, we compared pathways predicted for the T1 gold standard E. coli K-12 substr. MG1655 (TAX-511145), henceforth referred to as MG1655, using PathoLogic and triUMPF. Figure 8a shows the results, where both methods inferred 202 true-positive pathways (green-colored) in common out of 307 expected true-positive pathways (using EcoCyc as a common frame of reference). In addition, PathoLogic uniquely predicted 39 (magenta-colored) true-positive pathways whereas triUMPF uniquely predicted 16 true-positive pathways (purple-colored). This difference arises from the use of taxonomic pruning in PathoLogic, which improves the recovery of taxonomically constrained pathways and limits false-positive identification. When taxonomic pruning was enabled, PathoLogic inferred 79 false-positive pathways; when pruning was disabled, it inferred more than 170 false-positive pathways. In contrast, triUMPF, which does not use taxonomic feature information, inferred 84 false-positive pathways. This improvement over PathoLogic with pruning disabled reinforces the idea that pathway communities improve the precision of pathway prediction with limited impact on overall recall. Based on these results, it is conceivable to train triUMPF on subsets of organismal genomes, resulting in more constrained pathway communities for pangenome analysis.
To further evaluate triUMPF performance on closely related organismal genomes, we performed pathway prediction on E. coli str. CFT073 (TAX-199310) and E. coli O157:H7 str. EDL933 (TAX-155864), and we compared results with the MG1655 reference strain (Welch et al., 2002). Both CFT073 and EDL933 are pathogens infecting the human urinary and gastrointestinal tracts, respectively. Previously, Welch et al. (2002) described extensive genomic mosaicism between these strains and MG1655, defining a core backbone of conserved metabolic genes interspersed with genomic islands encoding common pathogenic or niche defining traits. Neither CFT073 nor EDL933 genomes are represented in the BioCyc collection of organismal pathway genome databases. A total of 335 and 319 unique pathways were predicted by PathoLogic and triUMPF, respectively. The resulting pathway lists were used to perform a set-difference analysis with MG1655 (Fig. 2). Both methods predicted more than 200 pathways encoded by all 3 strains, including core pathways such as the TCA cycle (Fig. 8b, c). CFT073 and EDL933 were predicted to share a single common pathway (TCA cycle IV [2-oxoglutarate decarboxylase]) by triUMPF.
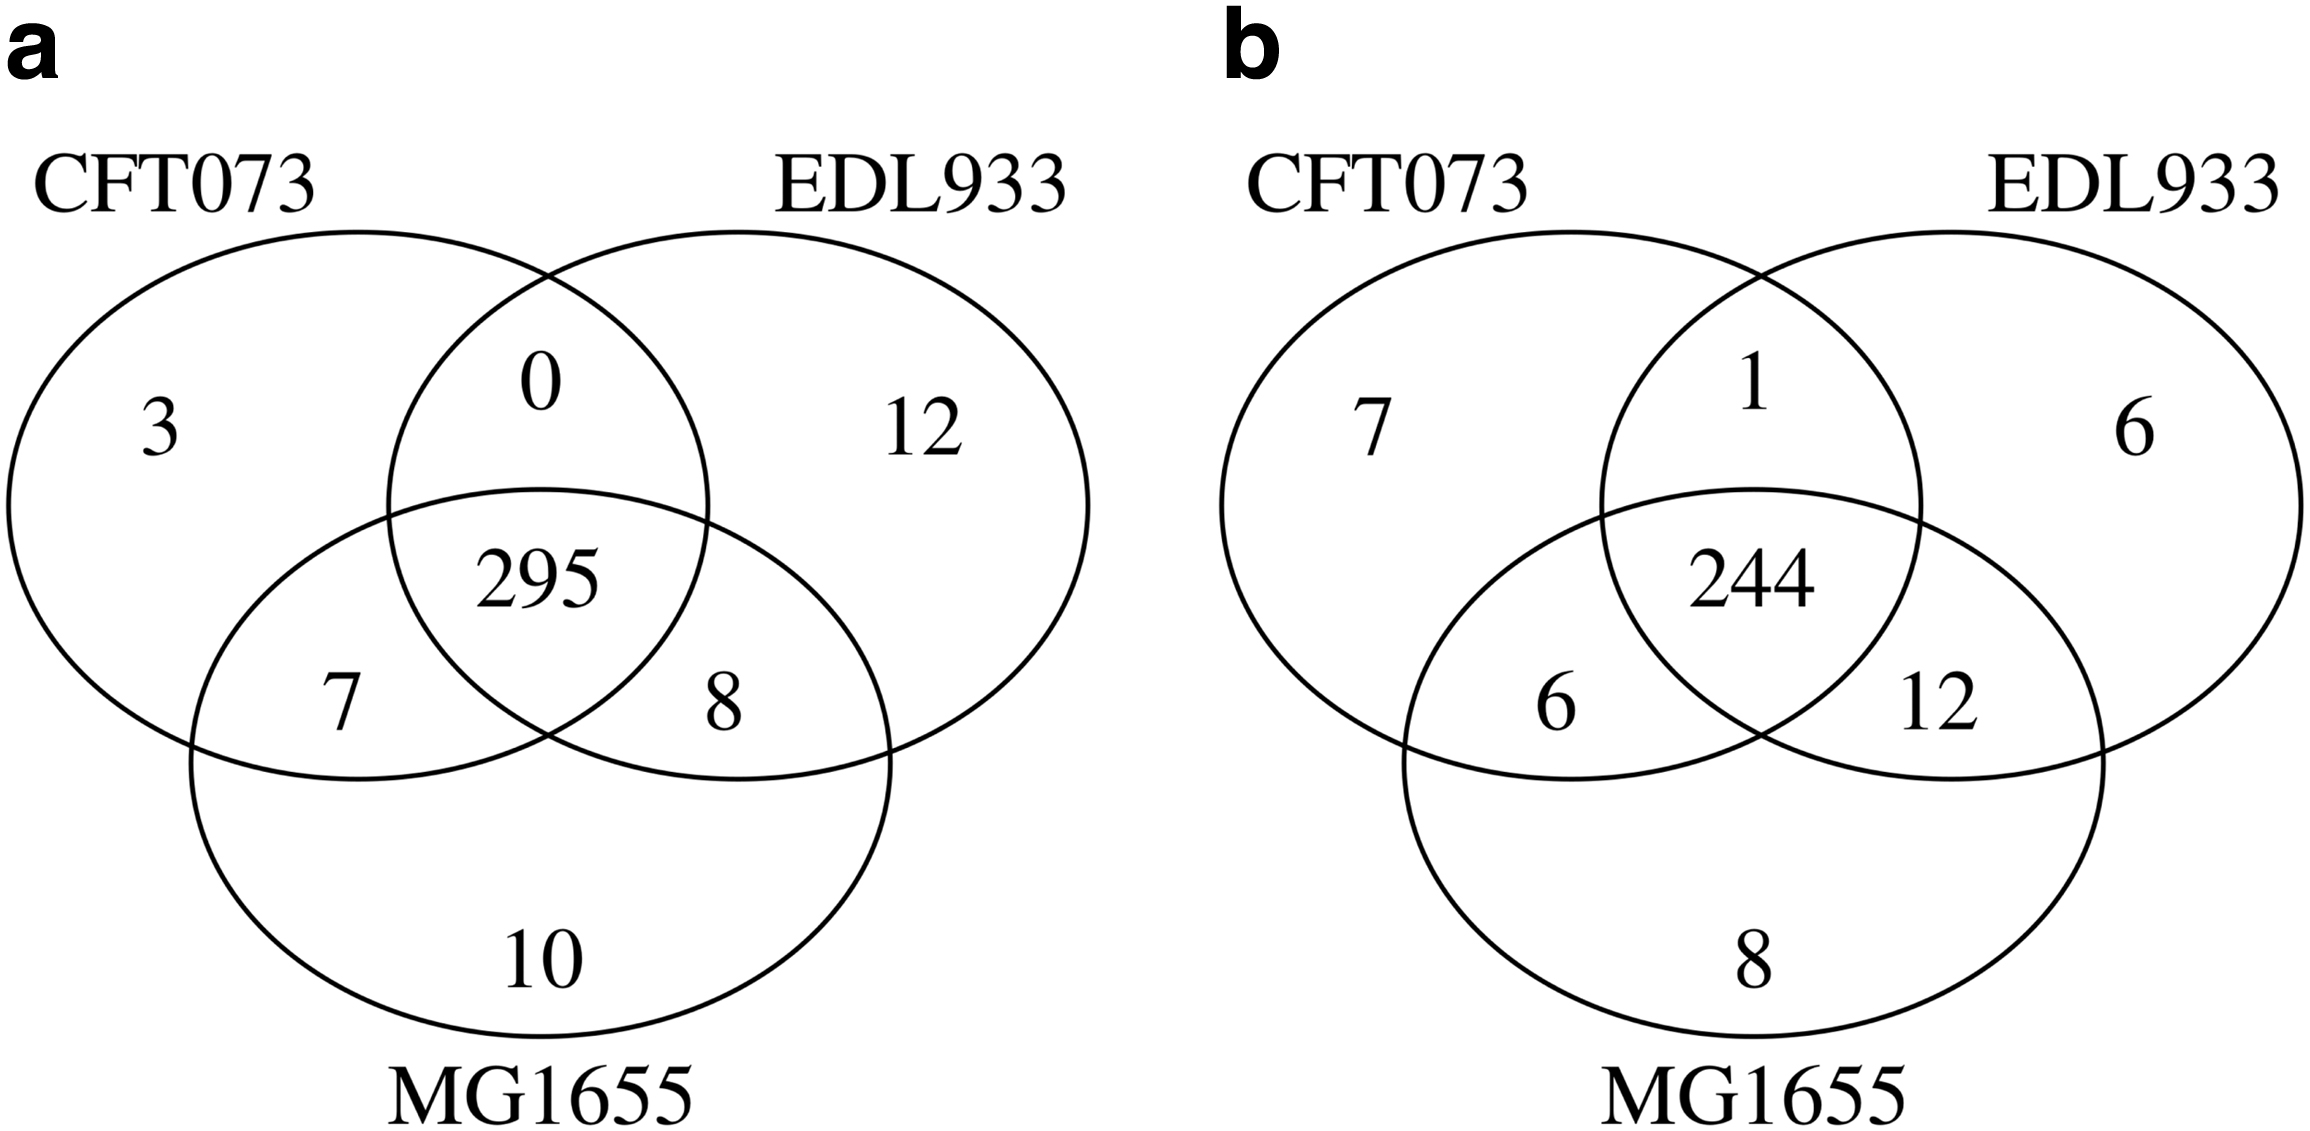
A three-way set difference analysis of pathways predicted for Escherichia coli K-12 substr. MG1655 (TAX-511145), E. coli str. CFT073 (TAX-199310), and E. coli O157:H7 str. EDL933 (TAX-155864) using
However, this pathway variant has not been previously identified in E. coli and is likely a false-positive prediction based on a recognized taxonomic range. Both PathoLogic and triUMPF predicted the aerobactin biosynthesis pathway involved in siderophore production in CFT073 consistent with previous observations (Welch et al., 2002). Similarly, four pathways (e.g.,
Given the lack of cross-validation standards for CFT073 and EDL933, we were unable to determine which method inferred fewer false-positives across the complete set of predicted pathways. To constrain this problem on a subset of the data, we applied GapMind (Price et al., 2018) to analyze amino acid biosynthesis pathways encoded in MG1655, CFT073, and EDL933 genomes. GapMind is a web-based application developed for annotating amino acid biosynthesis pathways in prokaryotic microorganisms (bacteria and archaea), where each reconstructed pathway is supported by a confidence level. After excluding pathways that were not incorporated in the training set, a total of 102 pathways were identified across the 3 strains encompassing 18 amino acid biosynthesis pathways and 27 pathway variants with high confidence (Table 7). PathoLogic inferred 49 pathways identified across the 3 strains encompassing 15 amino acid biosynthesis pathways and 17 pathway variants, whereas triUMPF inferred 54 pathways identified across the 3 strains encompassing 16 amino acid biosynthesis pathways and 19 pathway variants including
3.3. Mealybug symbionts data
To evaluate triUMPF performance on distributed metabolic pathways, we used the reduced genomes of Moranella and Tremblaya (McCutcheon and Von Dohlen, 2011). Collectively, the two symbiont genomes encode intact biosynthesis pathways for nine essential amino acids. PathoLogic, mlLGPR, and triUMPF were used to predict pathways on individual symbiont genomes and a composite genome consisting of both, and resulting amino acid biosynthesis pathway distributions were determined (Fig. 3). Both triUMPF and PathoLogic predicted six of the expected amino acid biosynthesis pathways on the composite genome, whereas mlLGPR predicted eight pathways. The pathway for phenylalanine biosynthesis (
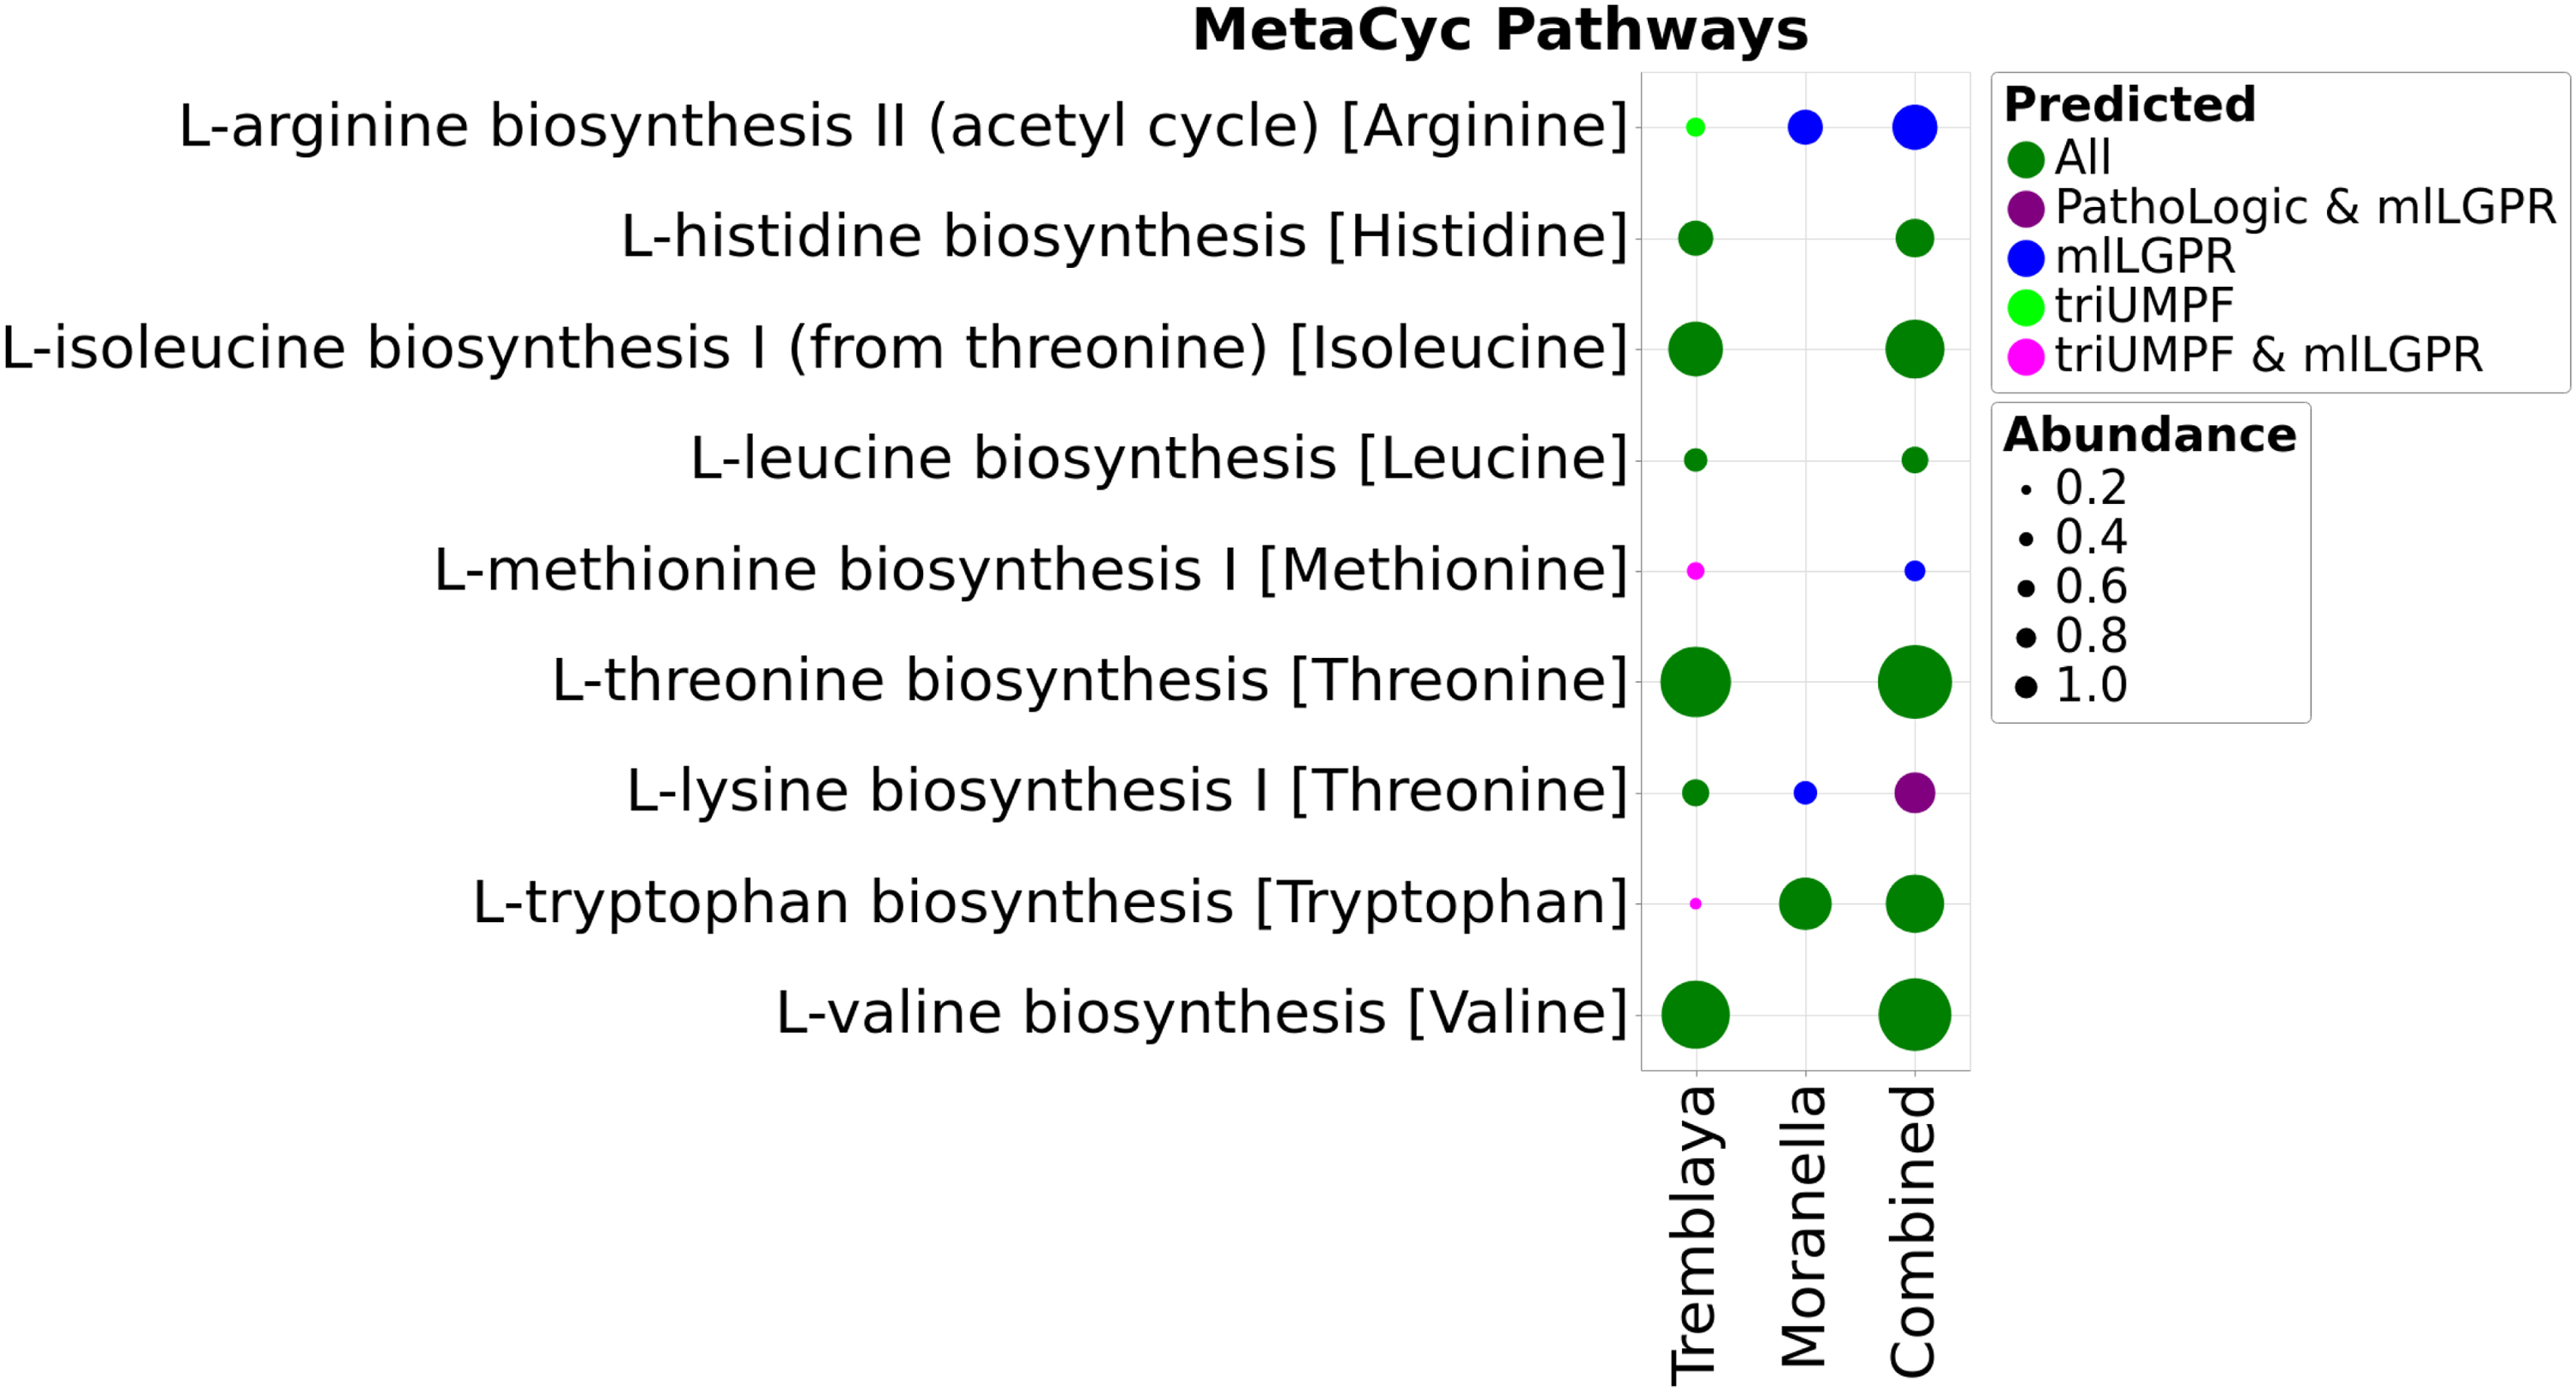
Comparative study of predicted pathways for symbiotic data between PathoLogic, mlLGPR, and triUMPF. The size of circles corresponds to the associated coverage information. mlLGPR, multi-label based on logistic regression for pathway prediction.
3.4. CAMI and HOTS data
To evaluate triUMPFs performance on more complex multi-organismal genomes, we used the CAMI low complexity (Sczyrba et al., 2017) and HOTS datasets (Stewart et al., 2011) comparing resulting pathway predictions with both PathoLogic and mlLGPR. For CAMI low complexity, triUMPF achieved an average F1 score of 0.5864 in comparison to 0.4866 for mlLGPR, which is trained with more than 2500 labeled pathways (Table 2). Similar results were obtained for HOTS (Section 5.5.4). Among a subset of 180 selected water column pathways, PathoLogic and triUMPF predicted a total of 54 and 58 pathways, respectively, whereas mlLGPR inferred 62. From a real-world perspective, none of the methods predicted pathways for photosynthesis light reaction nor pyruvate fermentation to (S)-acetoin although both are expected to be prevalent in the water column. Perhaps, the absence of specific ECs associated with these pathway limits rule-based or ML prediction. Indeed, closer inspection revealed that the enzyme catabolic acetolactate synthase was missing from the pyruvate fermentation to the (S)-acetoin pathway, which is an essential rule encoded in PathoLogic and represented as a feature in mlLGPR. Conversely, although this pathway was indexed to a community, triUMPF did not predict its presence, constituting a false-negative.
Predictive Performance of mlLGPR and triUMPF on Critical Assessment of Metagenome Interpretation Low Complexity Data
For each performance metric, “↓” indicates the smaller score is better whereas “↑” indicates the higher score is better.
Values in boldface represent the best performance score.
4. Discussion and Conclusion
In this article, we introduced a novel ML approach for metabolic pathway inference that combines three stages of NMF to capture relationships between enzymes and pathways within a network followed by community detection to extract higher order network structure. First, a Pathway-EC association (
We evaluated triUMPF performance by using a corpora of experimental datasets manifesting diverse multi-label properties comparing pathway prediction outcomes with other prediction methods, including PathoLogic (Karp et al., 2016) and mlLGPR (Basher et al., 2020). During benchmarking, we realized that the BioCyc collection suffers from a class imbalance problem (He and Garcia, 2009) where some pathways infrequently occur across PGDBs. This results in a significant sensitivity loss on T1 golden data, where triUMPF tended to predict more frequently observed pathways while missing more infrequent pathways. One potential approach to solve this class-imbalance problem is subsampling the most informative PGDBs for training, hence, reducing false-positives (Lakshminarayanan et al., 2017). Despite the observed class imbalance problem, triUMPF improved pathway prediction precision without the need for taxonomic rules or EC features to constrain metabolic potential. From an ML perspective this is a promising outcome considering that triUMPF was trained on a reduced number of pathways relative to mlLGPR. Future development efforts will explore subsampling approaches to improve sensitivity and the use of constrained taxonomic groups for pangenome and multi-organismal genome pathway inference.
5. Appendices
5.1. Appendix A1: definitions and problem formulation
Here, the default vector is considered to be a column vector and is represented by a boldface lowercase letter (e.g.,
Metabolic pathway inference from genomic sequence information at different levels of complexity and completion requires a trusted source of labeled pathway information in which the set of ordered reactions within and between cells is linked to substrates and products (compounds or metabolites). This information can be represented in graphs corresponding to reactome and pathway-level interactions. In this study, we use MetaCyc, a multi-organism member of the BioCyc collection of PGDBs as the trusted source for reactome and pathway information (Caspi et al., 2016a). MetaCyc contains only experimentally validated metabolic pathways across all domains of life. To simplify computational complexity, we consider the reaction and pathway graphs to be undirected.
Note that reactions in
Typically, the association matrix
After determining relationships within each graph, we define a multi-label metabolic pathway dataset.
The input space is assumed to be encoded as r-dimensional feature vector and is symbolized as
5.2. Appendix A2: detailed description of triUMPF method
In this section, we provide a description of triUMPF components, presented in Figure 1 of the main manuscript, including: (i) decomposing the pathway EC association matrix, (ii) subnetwork or community reconstruction, and (iii) the multi-label learning process.
5.2.1. Decomposing the pathway– EC association matrix
Given the non-negative
where
5.2.2. Subnetwork or community reconstruction
Recalling from the main manuscript, the higher-order proximity of the two matrices
where
Formally, let  . A similar discussion follows for the non-negative representation matrix
where
5.2.3. Multi-label learning process
We now bring together the NMF and community detection steps with multi-label classification for pathway prediction. The learning problem must balance between information in
where
The Equations (2), (4), and (5) are jointly non-convex due to non-negative constraints on the original and the approximation factorized matrices, implying that the solutions to triUMPF are only unique up to scalings and rotations (Yang and Michailidis, 2015). Hence, we adopt an alternating optimization algorithm to solve each objective function simultaneously, which is provided in Section 5.3.
5.3. Appendix A3: pptimization
In this section, we derive the optimization for triUMPFs objective function:
where
The objective function in Equation (7) is non-convex due to multiple non-negative constraints. Numerous algorithms have been proposed to optimize the objective function, including alternating non-negative least squares (Kim and Park, 2007) and hierarchical alternating least squares (Cichocki et al., 2007). Here, we employ the original algorithm for NMF that was introduced in Lee and Seung (2001) and consists of simple multiplicative update rules (with auxiliary variables) that are based on the gradient descent technique (Gillis, 2020). Beginning with random positive initialization, element-wise updates of Equation (6) w.r.t
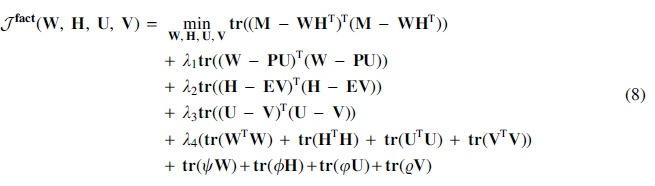
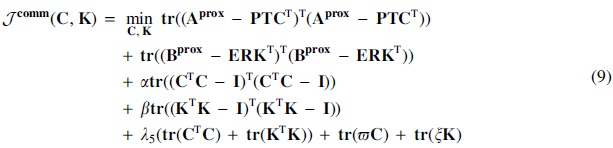
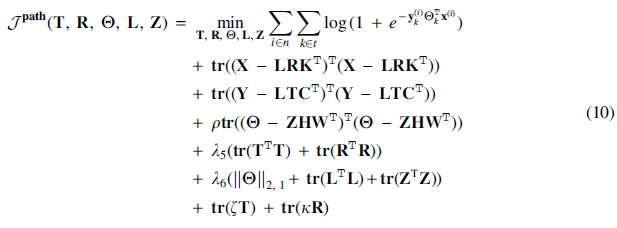
where  , and its multiplication property,
 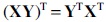 , we can expand the trace of the first term as

By expanding the remaining terms in Equation (8) and using the trace of a sum of matrix property,
Similar to the process of getting Equation (12), we expand the Equation (9) as:
Expanding Equation (10), we obtain the following:
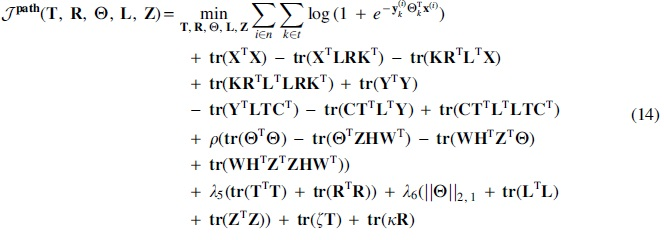
As explained earlier, the objective functions in Equations (12–14) are not convex with respect to all parameters combined. Instead in NMF,
Update the basis matrix
where
By computing the gradient of the cost function in Equation (15) w.r.t
where

Given an initial value of
The iterative update rules in Equation (19) are transformed into multiplicative update rules, which cannot generate negative elements since all values are positive and only multiplications and divisions are involved at each iteration (Lee and Seung, 1999).
Update the latent coefficient matrix
Taking the derivative of the cost function in Equation (20) w.r.t
where

The multiplicative updates after some algebraic manipulation w.r.t parameter
Update the linear transformation
Then, we take the derivative of the formula just cited with respect to the transformation matrix
where

Then, the parameter
Update the linear transformation
Taking the derivative of this error with respect to
where

As usual, the parameter
Update the community indicator matrix
Taking the derivative of this error with respect to
Again, we follow the KKT conditions for the non-negativity of

The parameter
Update the community indicator matrix
Taking the derivative of this error with respect to
Using the KKT conditions for the non-negativity of

The parameter
Update the community representation matrix
Taking the derivative of this error with respect to
Using the KKT conditions for the non-negativity of

The parameter
Update the community representation matrix
Taking the derivative of this error with respect to
Using the KKT conditions for the non-negativity of

The parameter
Update the weight matrix

where

Due to the non-closed form of the equation just cited, we use the iterative gradient descent approach with a defined learning rate
Update the auxiliary matrix
Taking the derivative of this error with respect to
The parameter
Update the auxiliary matrix
Taking the derivative of this error with respect to
The parameter
5.4. Appendix A4: experimental setup
In this section, we describe the experimental framework used to demonstrate triUMPF pathway prediction performance across multiple datasets spanning the genomic information hierarchy (Basher et al., 2020). All experimental tests were conducted on a Linux server by using 10 cores of Intel Xeon CPU E5-2650.
5.4.1. Association matrices
MetaCyc v21 (Caspi et al., 2016b) was used to obtain the three association matrices, P2E (
Characteristics of MetaCyc Database and the Three Association Matrices
MetaCyc (uec) denotes enzymatic reactions where links among enzymatic reactions are removed. The “—” indicates non-applicable operation.
EC, enzyme commission.
5.4.2. Description of datasets
We report the performance of triUMPF by using the following data: (i) T1 golden consisting of six PGDBs from the BioCyc collection (biocyc): EcoCyc (v21), HumanCyc (v19.5), AraCyc (v18.5), YeastCyc (v19.5), LeishCyc (v19.5), and TrypanoCyc (v18.5); (ii) three E. coli genomes consisting of E. coli K-12 substr. MG1655 (TAX-511145), E. coli str. CFT073 (TAX-199310), and E. coli O157:H7 str. EDL933 (TAX-155864) (Welch et al., 2002); (iii) BioCyc (v20.5 T2 & 3) (Caspi et al., 2016a) consisting of 9255 PGDBs with 1463 distinct pathways; (iv) reduced complexity of mealybug symbiont genomes from Moranella (GenBank NC-015735) and Tremblaya (GenBank NC-015736) encoding distributed metabolic pathways for amino acid biosynthesis (McCutcheon and Von Dohlen, 2011); (v) the CAMI initiative low complexity dataset (edwards.sdsu.edu/research/cami-challenge-datasets/), consisting of 40 genomes (Sczyrba et al., 2017); and (vi) whole genome shotgun sequences from the HOTS at 25 m, 75 m, 110 m (sunlit), and 500 m (dark) ocean depth intervals downloaded from the NCBI Sequence Read Archive under accession numbers SRX007372, SRX007369, SRX007370, and SRX007371 (Stewart et al., 2011). T1 PGDBs were refined to include only those pathways that cross-intersect with the MetaCyc database (v21) (Caspi et al., 2016b).
The detailed characteristics of the datasets are summarized in Table 4. For each dataset Label cardinality [LCard Label density [LDen Distinct labels [DL Proportion of distinct labels [PDL
Experimental Data Set Properties
The notations
CAMI, Critical Assessment of Metagenome Interpretation; HOTS, Hawaii Ocean Time Series.
The notations R(
5.4.3. Pathway and enzymatic reaction features
triUMPF was trained by using BioCyc v20.5, which contains less than 1460 trainable pathways. To offset this limit, we applied pathway2vec (Basher and Hallam, 2020) by using the RUST-norm (or “crt”) module to obtain pathway and EC features, indicated by
After generating node features, we only apply EC features to concatenate each example i according to:
where
5.4.4. Parameter settings
For training, unless otherwise indicated, the learning rate was set to 0.0001, batch size to 50, number of epochs to 10, number of components
5.5. Appendix A5: experimental results
Four tests were performed to benchmark the performance of triUMPF, including parameter sensitivity, network reconstruction, impact of
5.5.1. Parameter sensitivity
The impact of seven hyperparameters (
Figure 4 shows the effect of rank k on triUMPF performance. In general, we observe steady performance with increasing k. Although this contrasts standard NMF, where reconstruction cost decreases as the number of features increases, it is expected because, unlike standard NMF, triUMPF exploits two types of correlations to recover
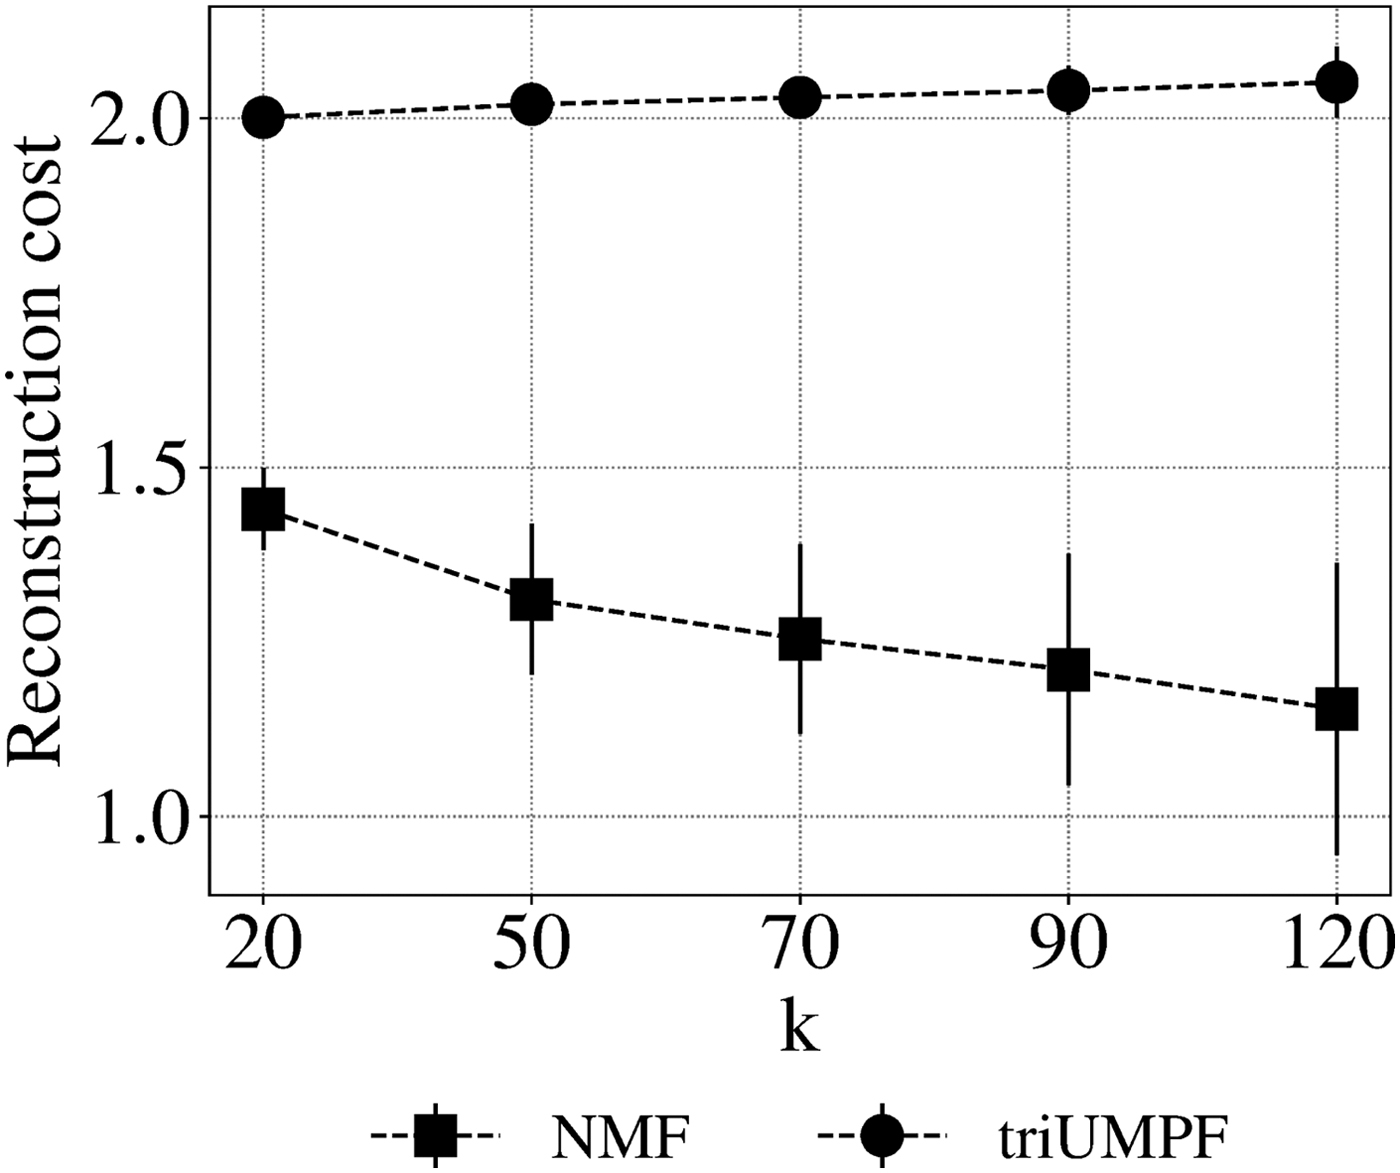
Sensitivity of components k based on reconstruction cost.
For community detection, we observed optimal results with respect to pathway community size at
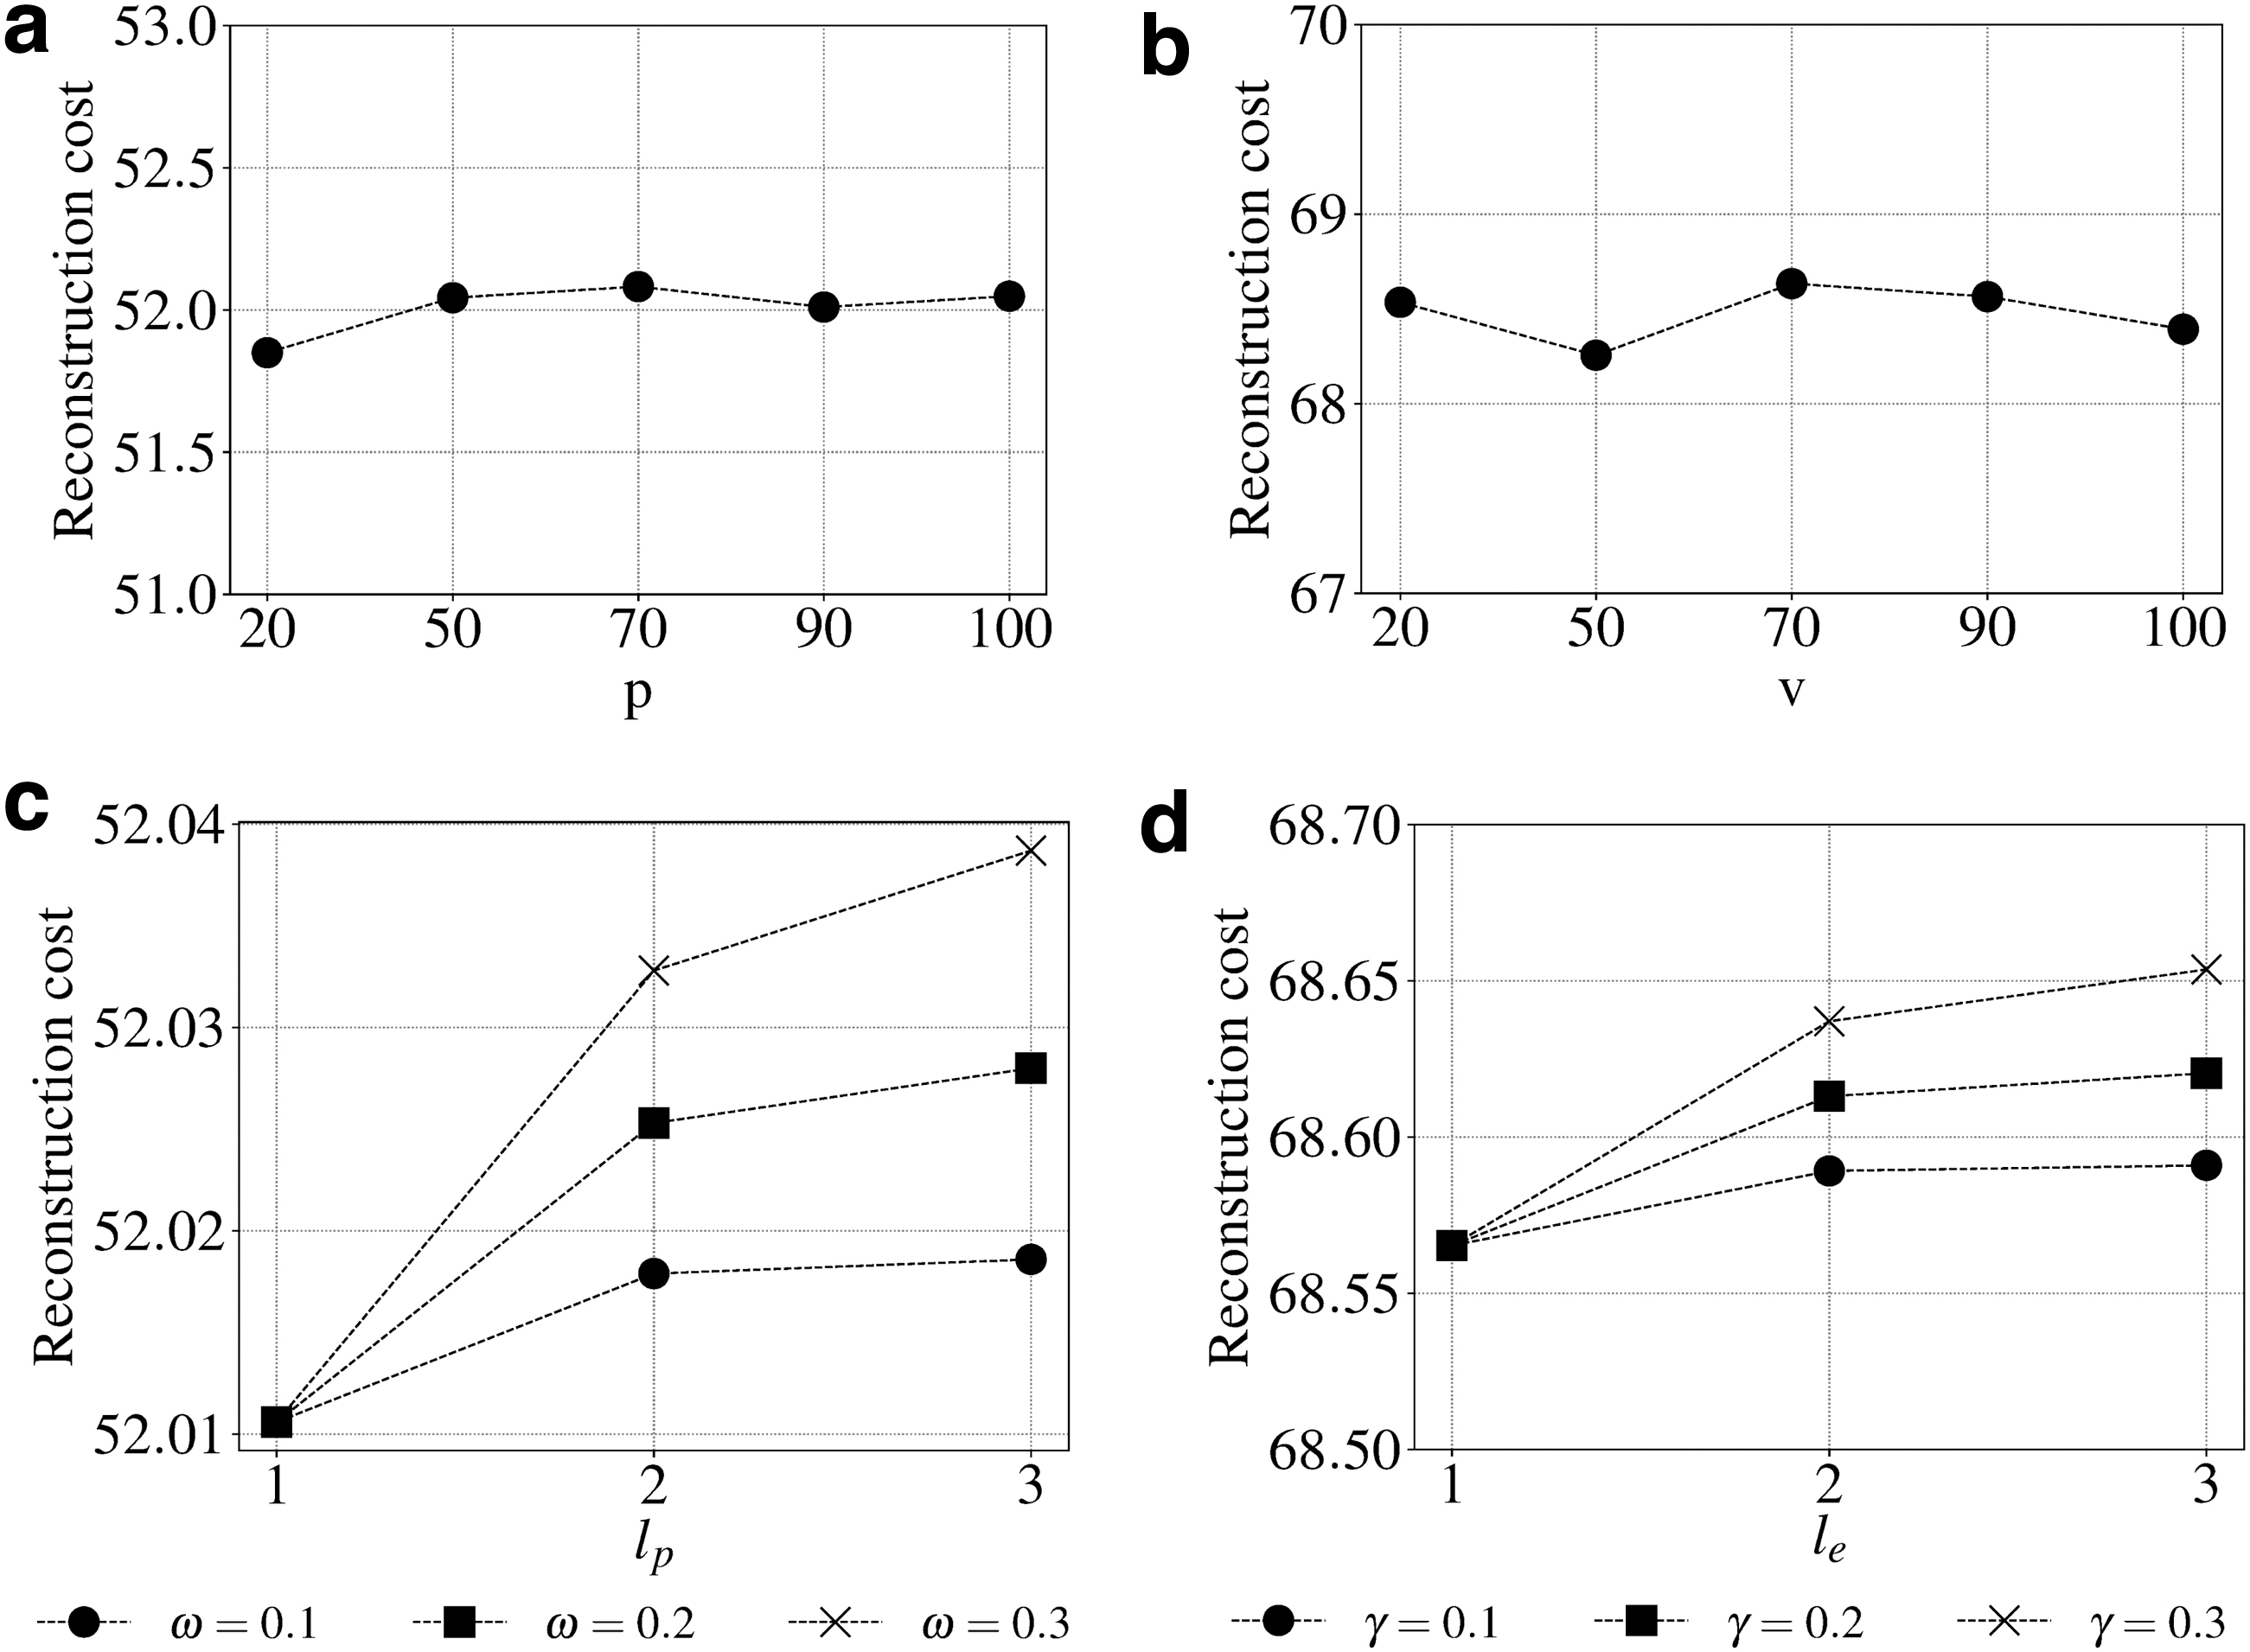
Sensitivity of community size and higher order proximity with weights based on reconstruction cost.
Finally, we show the effect of changing polynomial orders, and their weights on triUMPF performance. From Figure 5c, we see that reconstruction cost progressively increases with varying higher orders for lp for all the three weights
Based on these results, triUMPF performance is stable while minimizing cost under the following parameter settings:
5.5.2. Network reconstruction
In this section, we explore the robustness of triUMPF when exposed to noise. Links were randomly removed from
Figure 6a indicate that by progressively increasing noise
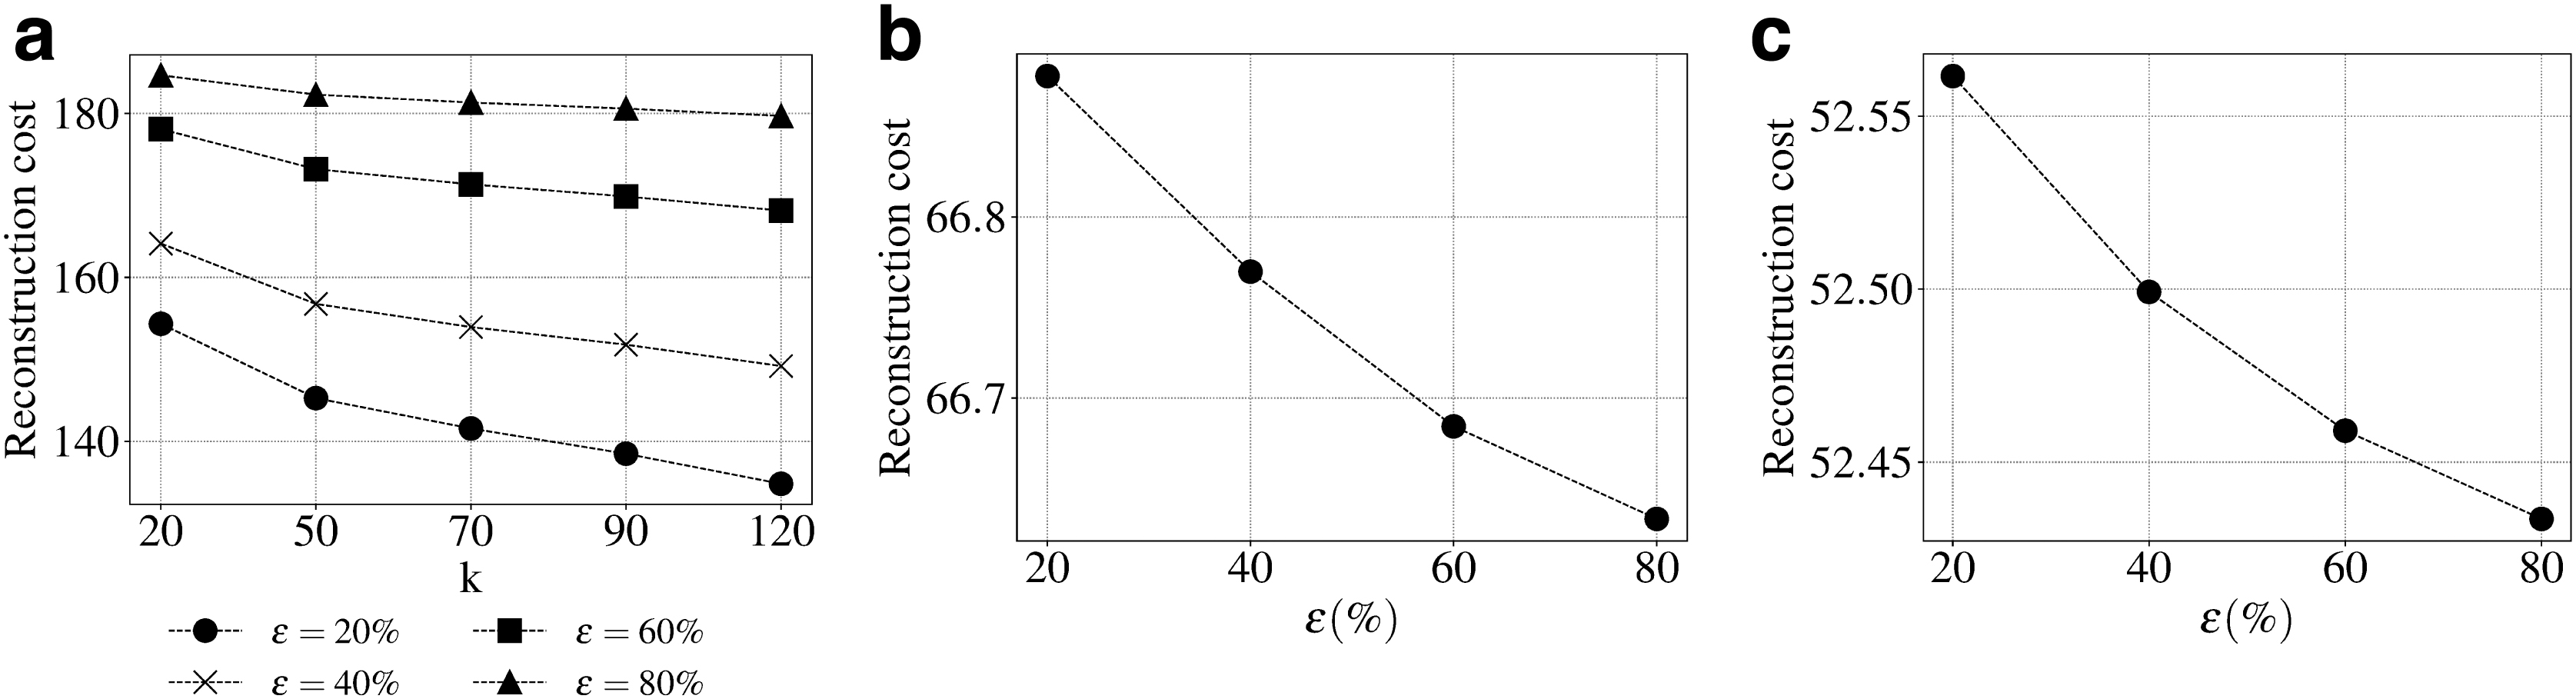
Link prediction results by varying noise levels
For
5.5.3. Impact of
Figure 7 shows the inverse effect in predictive performance on T1 golden datasets when decreasing
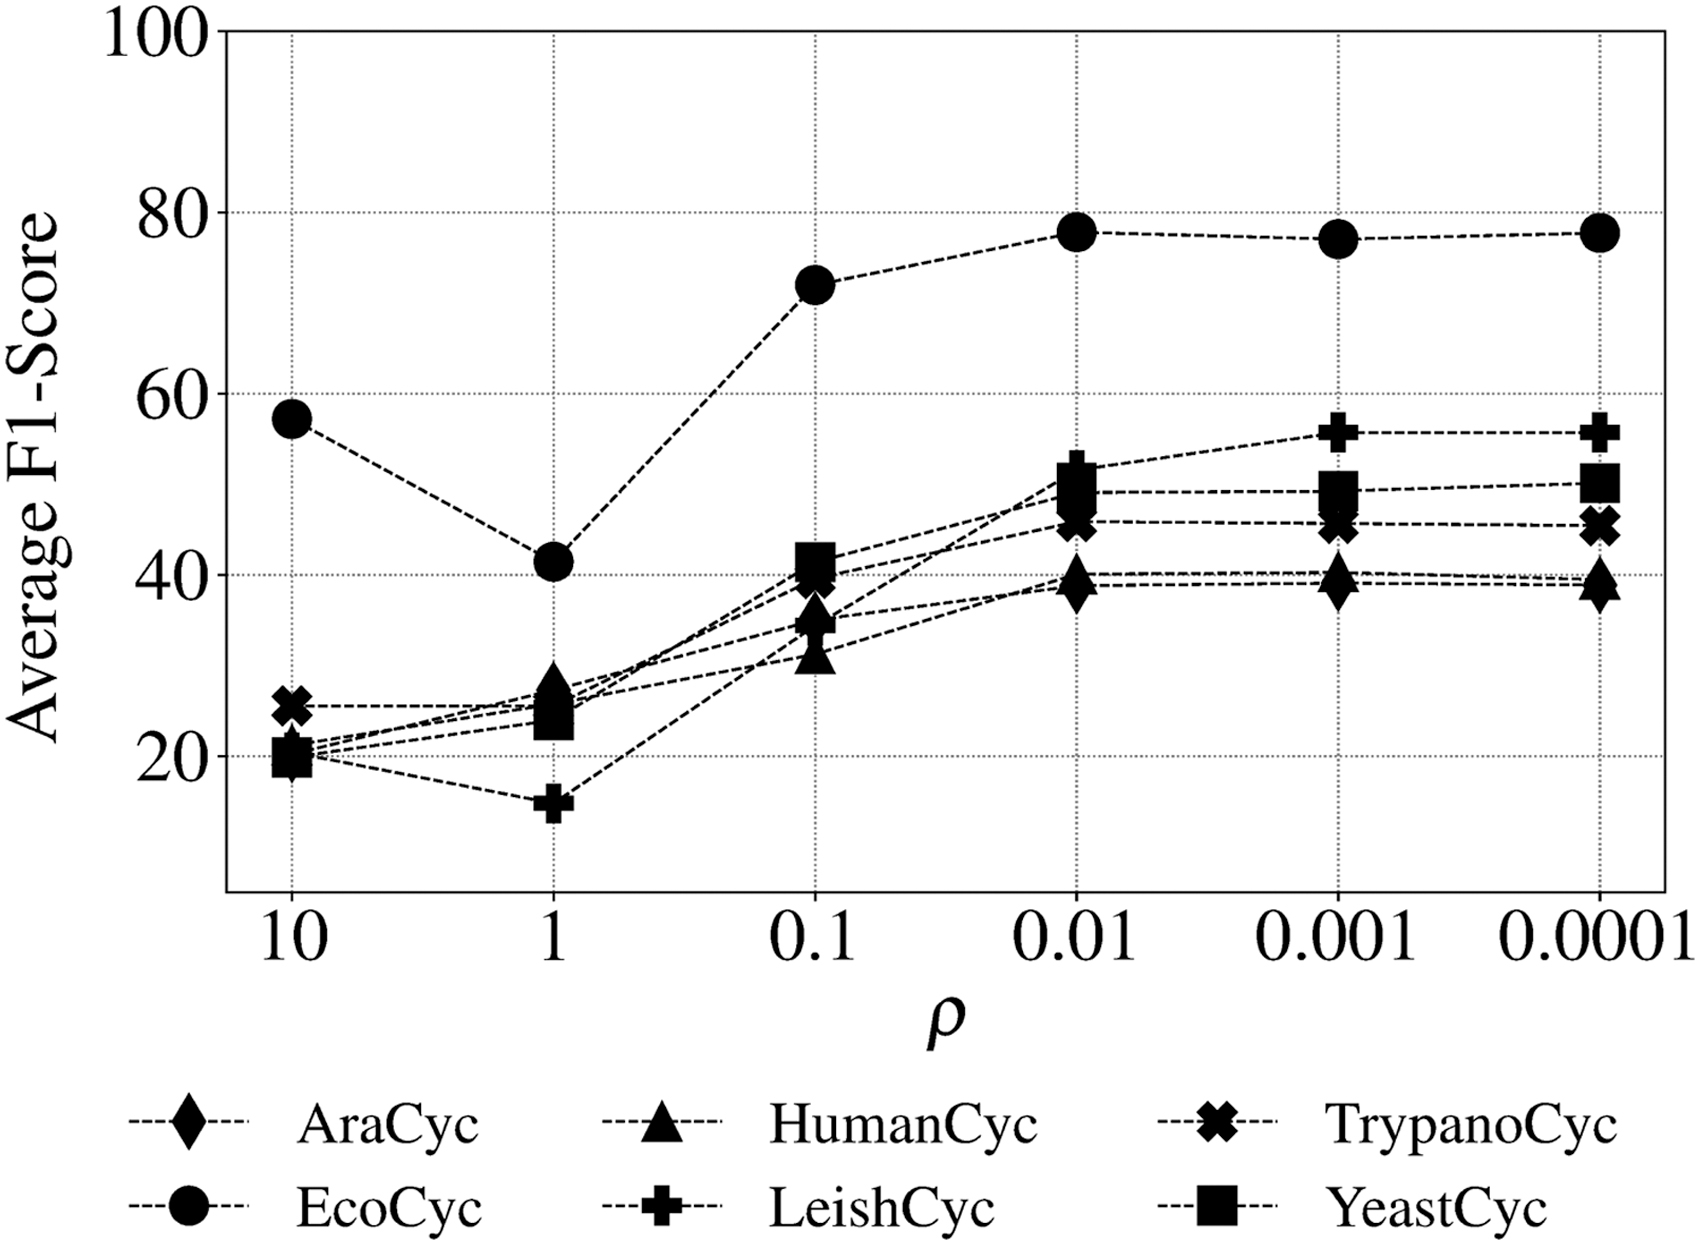
Effect of
5.5.4. Metabolic pathway prediction
Here, we investigate the effectiveness of triUMPF for the pathway prediction task on (i) T1 golden data, (ii) three E. coli data, and (iii) HOTS.
5.5.4.1. T1 golden data
We compare the performance of triUMPF on six benchmark datasets, as described in Section 5.4.2, against the other pathway prediction algorithms using four evaluation metrics: Hamming loss, average precision, average recall, and average F1 score. As shown in Table 5, triUMPF achieved competitive performance against the other methods in terms of average precision.
Predictive Performance of Each Comparing Algorithm on Six Golden T1 Data
For each performance metric, “↑” indicates the smaller score is better whereas “↑” indicates the higher score is better.
Values in boldface represent the best performance score.
5.5.4.2. Three E. coli data
Figure 8 shows pathway communities observed for MG1655, CFT073, and EDL933 by using BioCyc T2 & 3, including MetaCyc in training. Table 6 shows the top 5 communities along with pathways that were predicted by triUMPF for MG1655. Figure 9 shows that PathoLogic was able to infer more than 90 additional pathways when taxonomic pruning is disabled. Table 7 summarizes GapMind (Price et al., 2018) results for MG1655, CFT073, and EDL933. Figure 10 shows the results for both PathoLogic with taxonomic pruning enabled and triUMPF. Without taxonomic pruning, PathoLogic predicted 56 pathways across the 3 strains encompassing 15 amino acid biosynthesis pathways and 20 pathway variants, including the
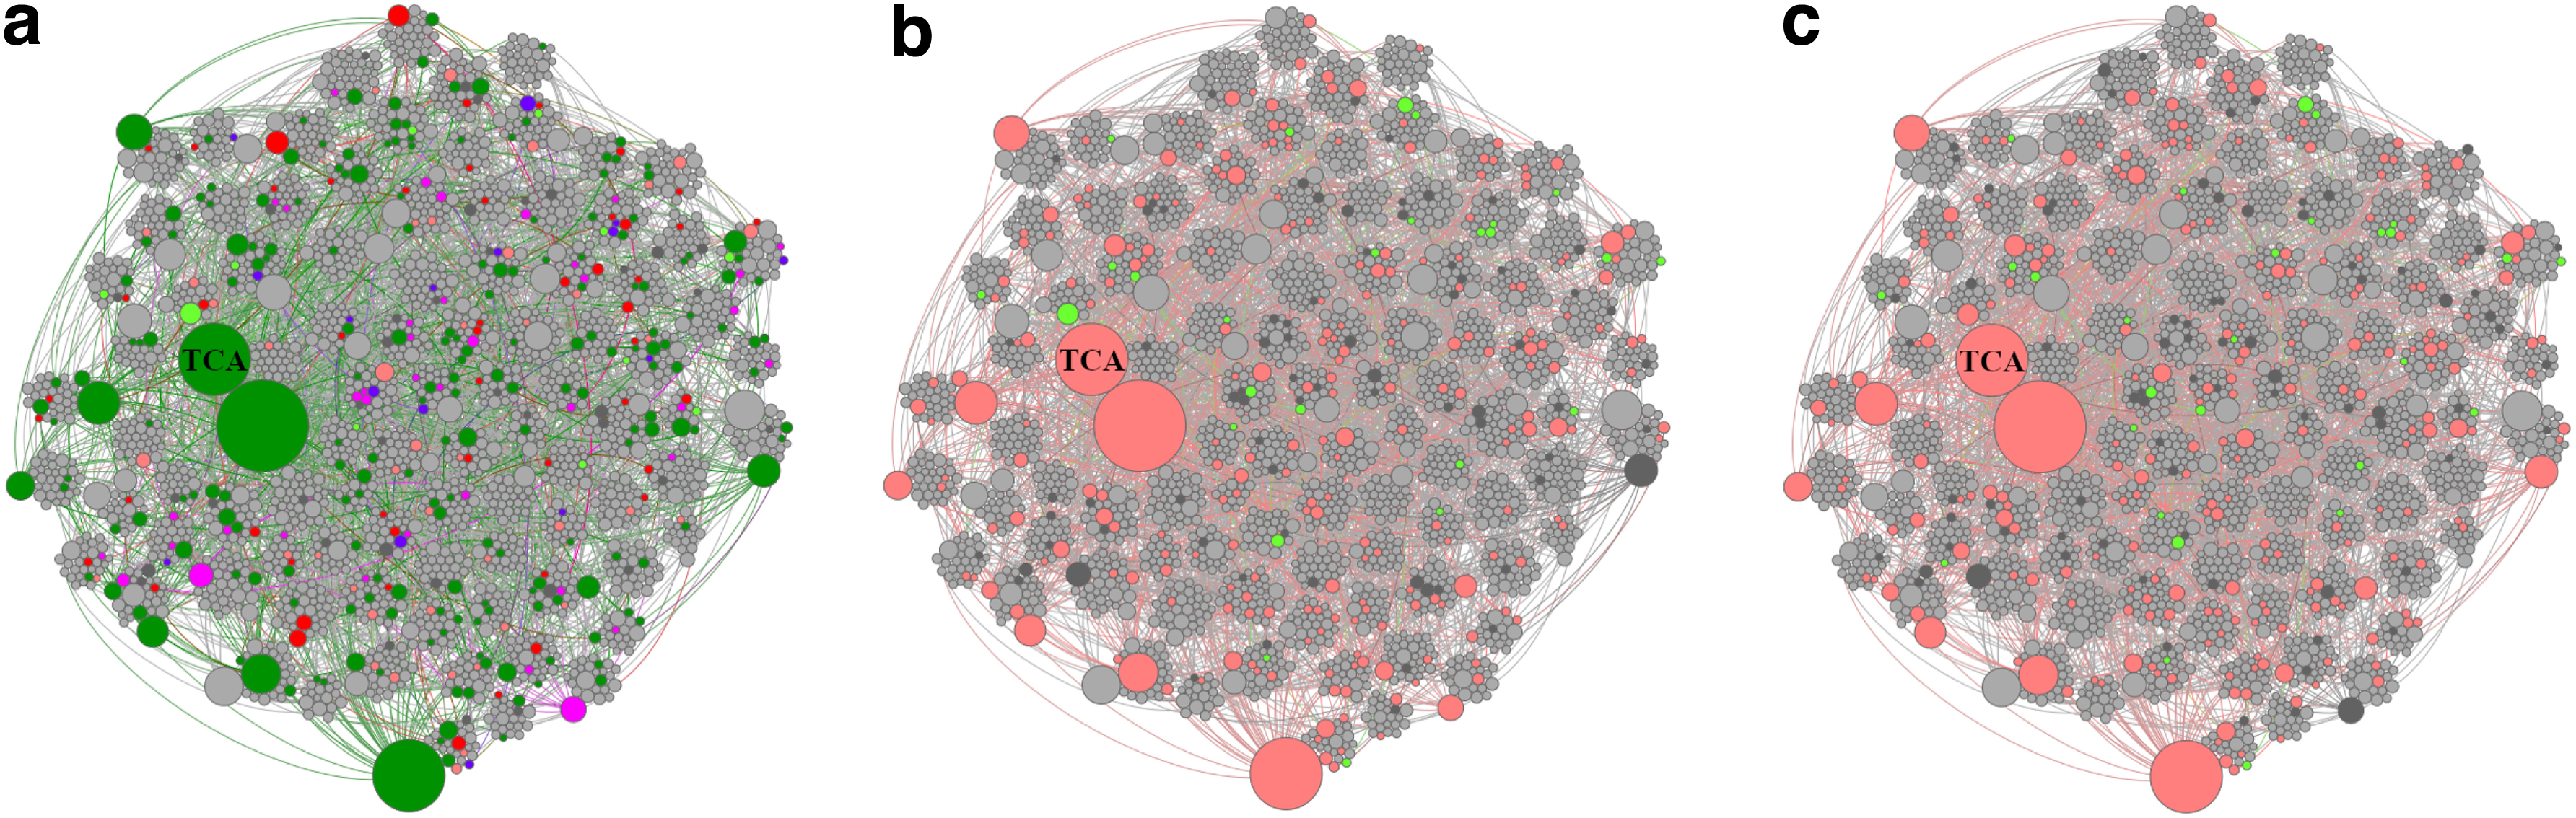
Pathway community networks for related T1 and T3 organismal genomes. Pathway communities for
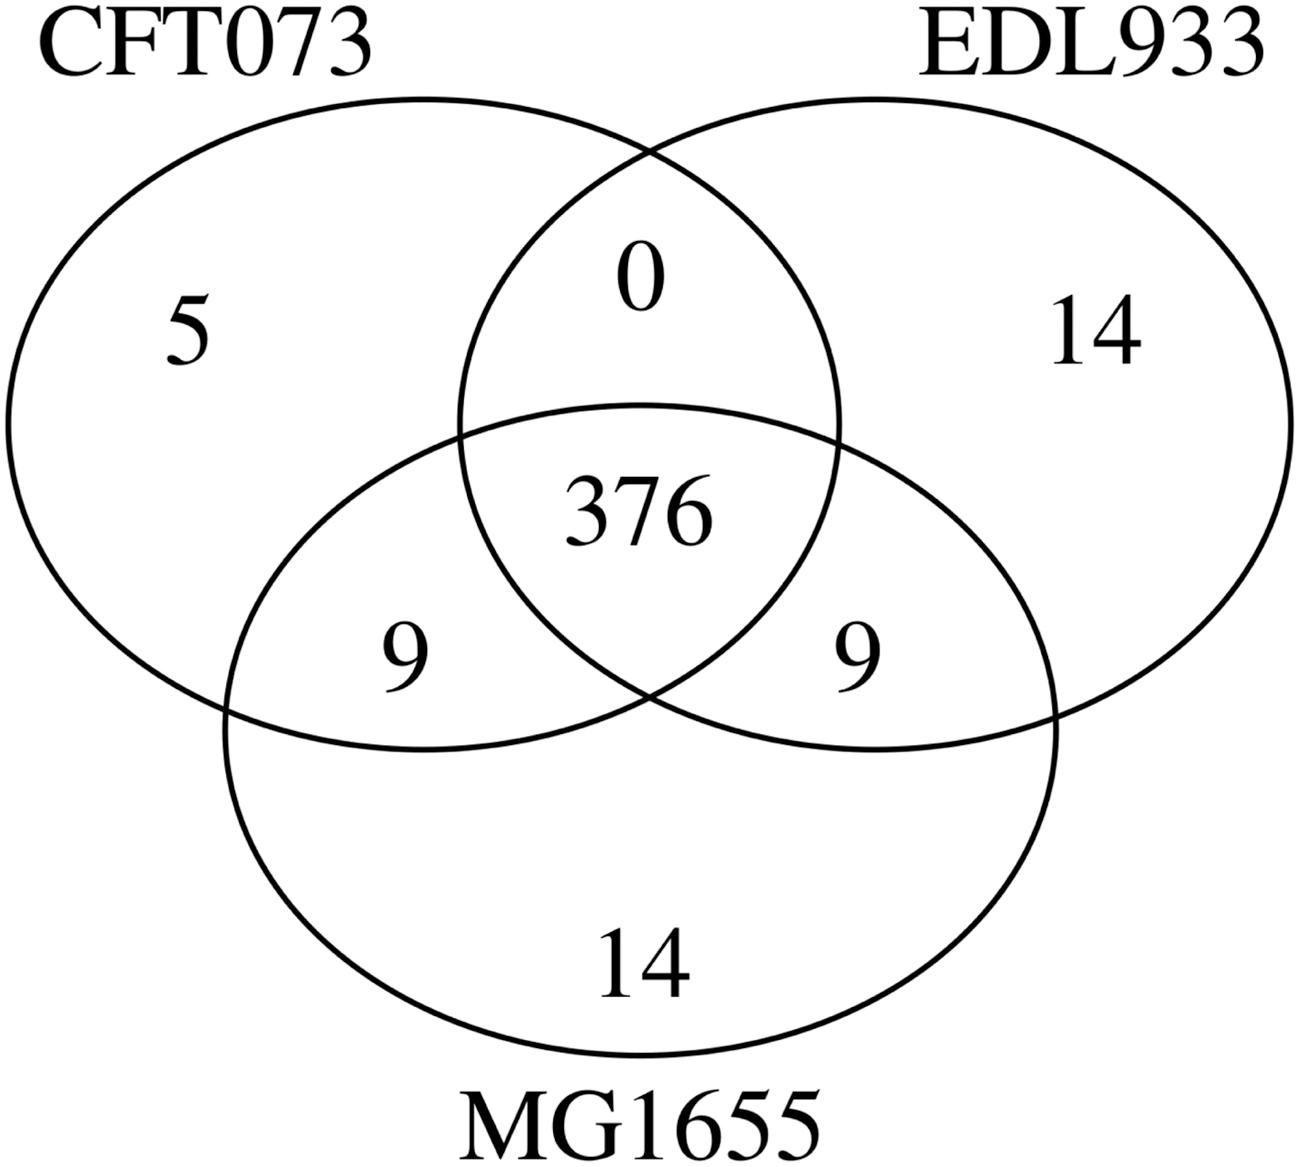
A three-way set analysis of predicted pathways for Escherichia coli K-12 substr. MG1655 (TAX-511145), E. coli str. CFT073 (TAX-199310), and E. coli O157:H7 str. EDL933 (TAX-155864) using PathoLogic (without taxonomic pruning).
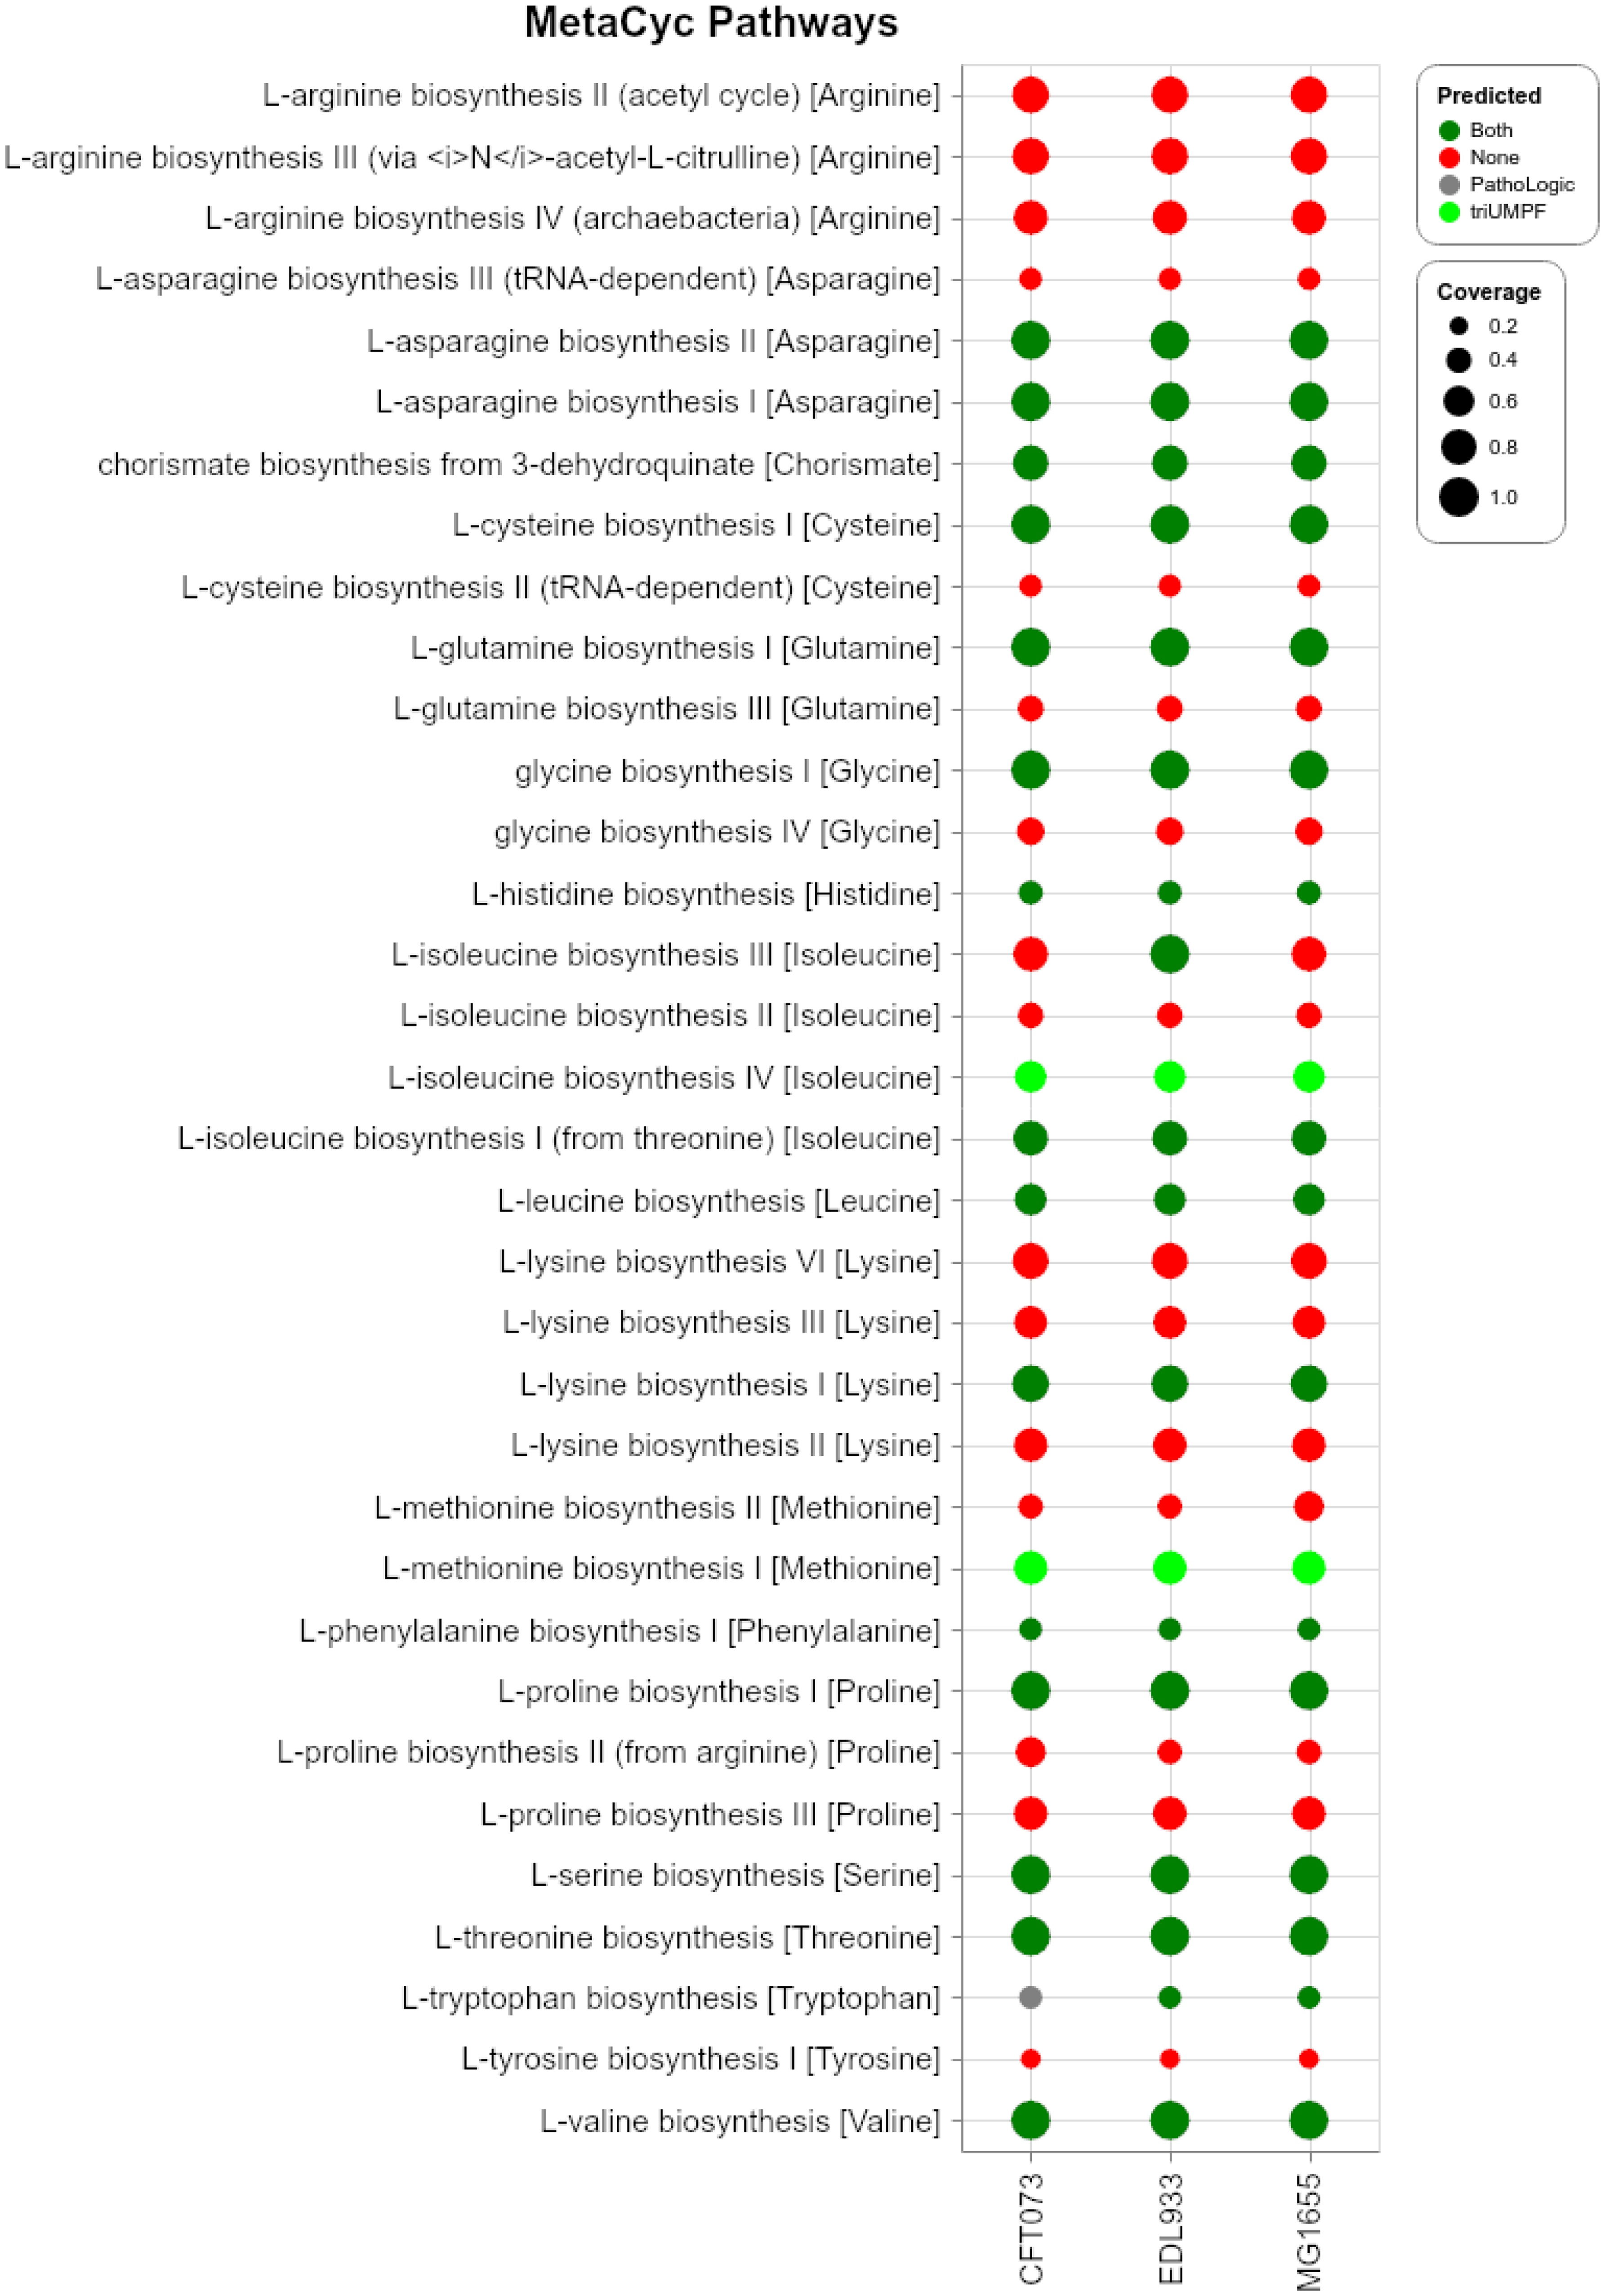
Comparison of predicted pathways for Escherichia coli K-12 substr. MG1655 (TAX-511145), E. coli str. CFT073 (TAX-199310), and E. coli O157:H7 str. EDL933 (TAX-155864) datasets between PathoLogic (taxonomic pruning) and triUMPF. Red circles indicate that neither method predicted a specific pathway, whereas green circles indicate that both methods predicted a specific pathway. Lime circles indicate pathways predicted solely by mlLGPR, and gray circles indicate pathways solely predicted by PathoLogic. The size of circles corresponds to the associated pathway coverage information.
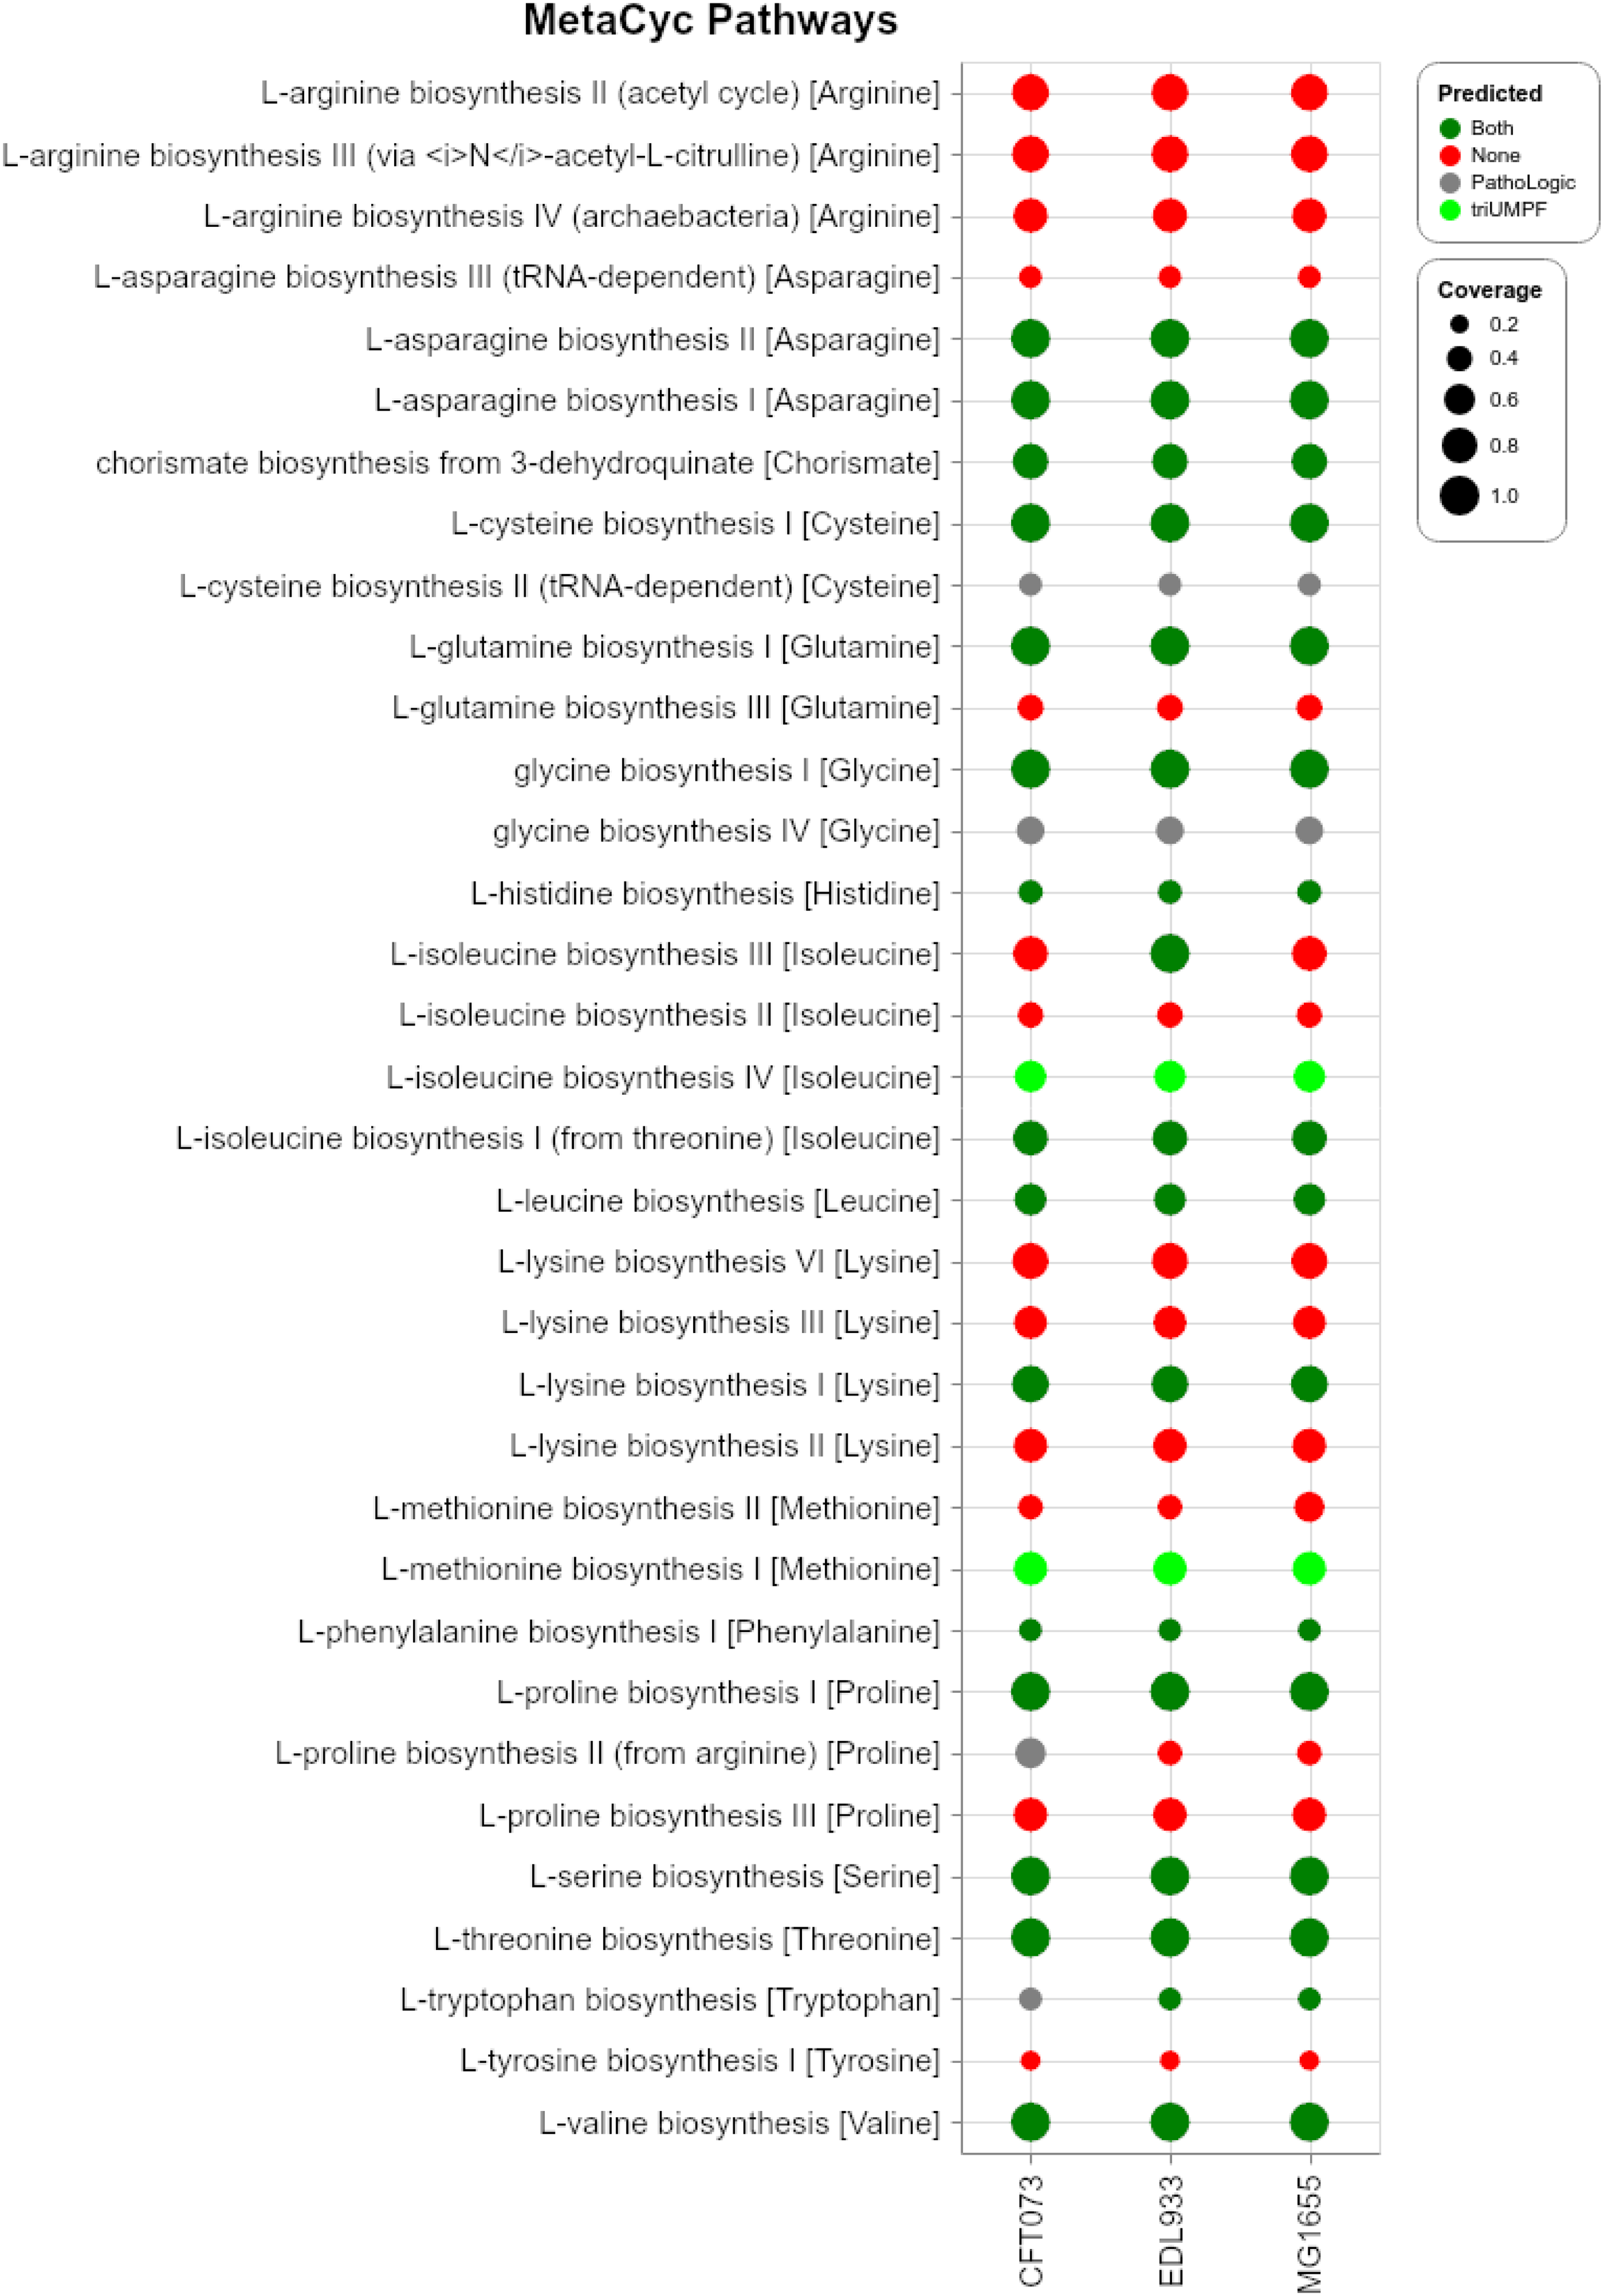
Comparison of predicted pathways for Escherichia coli K-12 substr. MG1655 (TAX-511145), E. coli str. CFT073 (TAX-199310), and E. coli O157:H7 str. EDL933 (TAX-155864) datasets between PathoLogic (without taxonomic pruning) and triUMPF. Red circles indicate that neither method predicted a specific pathway, whereas green circles indicate that both methods predicted a specific pathway. Lime circles indicate pathways predicted solely by mlLGPR, and gray circles indicate pathways solely predicted by PathoLogic. The size of circles corresponds to the associated coverage information.
Top 5 Communities with Pathways Predicted by triUMPF for Escherichia coli K-12 Substr
MG1655 (TAX-511145). The last column asserts whether a pathway is present in or absent (a false-positive pathway) from EcoCyc reference data.
CTP, cytidine-triphosphate; UTP, uridine-triphosphate.
Eighteen Amino Acid Biosynthesis Pathways and 27 Pathway Variants
5.5.4.3. HOTS water column
Here, we use triUMPF to infer a set of pathways from the HOTS water column spanning sunlit and dark ocean depth intervals comparing results with other prediction methods, including PathoLogic and mlLGPR. The results are presented in Figure 12.
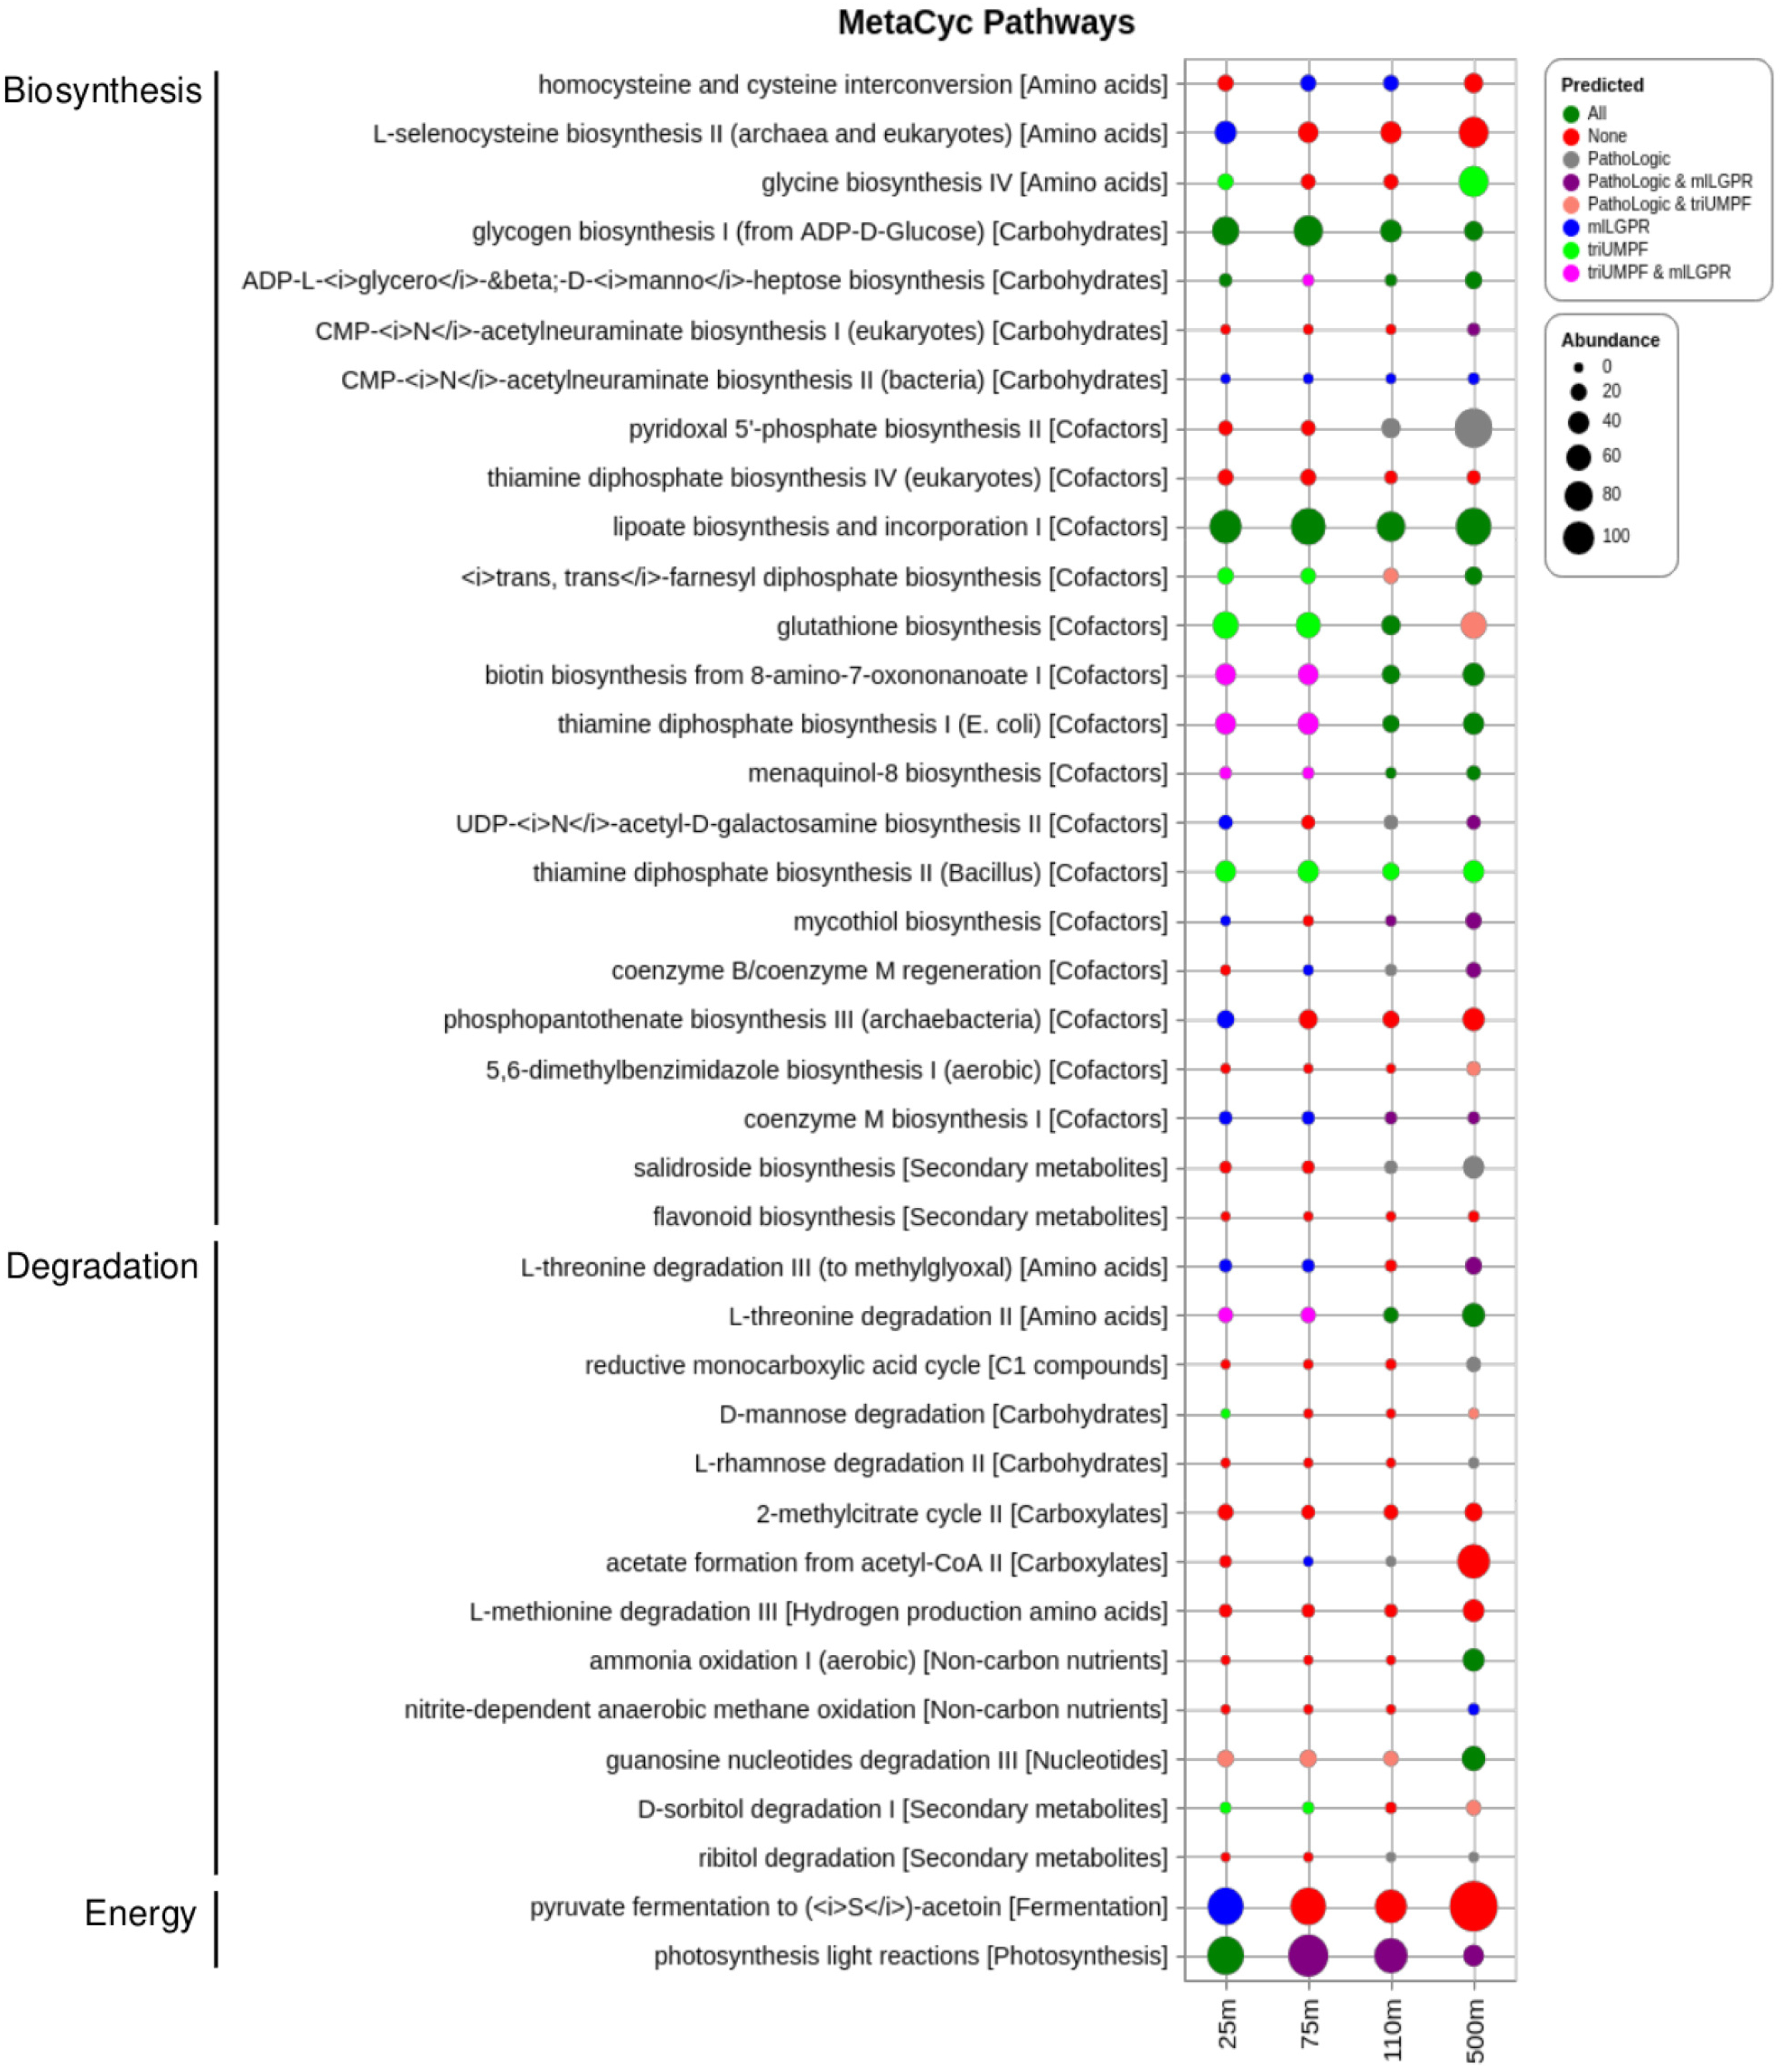
Comparative study of predicted pathways for HOT DNA samples. The size of circles corresponds to the associated coverage information.
5.5.4.4. Availability of data and materials
The triUMPF source code is available under the MIT License on GitHub (hallamlab/triUMPF) with detailed descriptions on how to install and execute all commands run to generate results in our GitHub repository. The MetaCyc database can be obtained from metacyc.org. The T1 golden datasets can be downloaded from biocyc.org. For the symbiotic Candidatus Moranella endobia and Candidatus Tremblaya princeps genomes, they can be downloaded from GenBank under accession numbers NC-015735 and NC-015736 whereas the simulated CAMI low complexity dataset can be obtained from edwards.sdsu.edu/research/cami-challenge-datasets Unassembled whole genome shotgun DNA pyrosequences from HOTS (10 m, 75 m, 110 m, and 500 m) can be obtained from the NCBI Sequence Read Archive under accession numbers SRX007372, SRX007369, SRX007370, and SRX007371. The preprocessed datasets used in this article can be downloaded from zenodo.org/YNfvDehKhPY. The same zenodo repo contains a pre-trained triUMPF (“triUMPF.pkl”) using configurations stated in Section 5.4.
Footnotes
Acknowledgments
The author would like to thank Connor Morgan-Lang, Kishori Konwar, and Aria Hahn for lucid discussions on the function of the triUMPF model and all members of the Hallam Lab for helpful comments along the way.
Author Disclosure Statement
S.J.H. is a co-founder of Koonkie, Inc., a bioinformatics consulting company that designs and provides scalable algorithmic and data analytics solutions in the cloud.
Funding Information
This work was performed under the auspices of Genome Canada, Genome British Columbia, the Natural Science and Engineering Research Council (NSERC) of Canada, and Compute/Calcul Canada). A.R.M.A.B. and R.J.M. were supported by a UBC four-year doctoral fellowship (4YF) administered through the UBC Graduate Program in Bioinformatics.