




Abstract
Current frameworks of side-by-side phylogenetic trees comparison face two issues: (1) accepting mainly binary trees as input and (2) assuming input trees having identical or highly overlapping taxa. However, cladistic comparative studies often lead with multiple nontotally resolved trees with nonidentical sets of taxa. We tackle these issues in this study, presenting the iPhyloC, an interactive web-based framework for comparing phylogenetic trees side by side. iPhyloC supports automatic identification of the common taxa in the input trees, comparison options between them, intuitive design, high usability, scalability to large trees, and cross-platform support. iPhyloC was tested using different trees and a supertree depicting the phylogenetic relationships within the insect order Diptera as examples.
1. Introduction
From the mid-19th century onward, the core of evolutionary thinking is descent with modification from a common ancestor (Bowler, 2003). What emerges from the evolutionary process is a natural hierarchy that relates species, groups of species, and genes. The best representation of such patterns is rooted or unrooted dendrograms (Baum and Offner, 2008), in the tradition inaugurated by Darwin himself (Darwin, 1859) and developed during the 20th century.
Evolutionary trees are known as cladograms or phylogenetic trees (Hennig, 1966). Thus, a phylogenetic tree is a dendrogram composed of a hierarchically structured set of leaf nodes, the terminal taxa. The internal nodes of a tree represent common putative ancestors. A clade, or a monophyletic group, is the set of all taxa underneath a specific internal node including the common ancestor, whereas a subtree is the set of all descendants beneath an ancestor including its hierarchical structure, that is, the internal nodes and their connections.
There are computational tools for phylogenetic tree inference, and some of the most popular among systematists are TNT (Goloboff and Catalano, 2016) and MESQUITE (Maddison and Maddison, 2019). A phylogenetic analysis of any kind of data (morphological, molecular, behavioral, biochemical, and so on) may result in dozens, or even hundreds, of equally most parsimonious trees. All of these trees compose the so-called tree space, a multidimensional space containing all the possible trees for a given set of taxa (Baum and Smith, 2013). In biological research, to test their hypothesis, systematists usually compare a reference tree with a collection of other trees, or trees side by side.
Comparing trees derived from different data sets is extremely helpful in biological systematics. However, depending on the sort of primary evidence used in the phylogenetic analysis, the taxon sampling can be biased, which may lead to trees appearing incomparable at first glance. For instance, uncommon or hardly sequenced taxa (as fossil species) often lack in some molecular-based phylogenies (Giribet and Edgecombe, 2020). Tracking the similarities and differences among trees with noncompletely shared taxa searching for the common natural groups is not a straightforward task, especially in large trees. That is due to several reasons, such as the position of the taxa in different trees, trees’ depth, and root node. Comparing such trees might need a re-rooting process. Hence, tree comparison frameworks are especially useful.
Several systems and packages deal with tree comparison (Plaisant et al., 2007; Grahan and Kennedy, 2010). Phytools (Revell, 2012) allows matching the tips of two input trees. Beck et al. (2014) use superposition to stack trees visually. ggtree (Yu et al., 2017) offers plotting of several phylogenetic trees in the same space, along with annotations, but for tree comparison, the user has to plot the trees using the R programming language, then connect the common taxa through line drawing command. Although useful, these packages have limitations, including the lack of interactive exploration and the need for knowing the R programming language. Phylo.io (Robinson et al., 2016) is a web application to visualize and compare two phylogenetic trees side by side that best fits biologists’ goals, with some concerns as detailed hereunder.
We identify two other important limitations for systematists of the current trees’ visual comparison frameworks: demanding only fully resolved trees as input; and assuming input trees have identical, or at least highly overlapping, sets of taxa. Such assumptions prevent using these frameworks to compare phylogenetic trees that do not fulfill these conditions. This is the case, for instance, in the comparison of a supertree with its source trees. A supertree is a unique phylogenetic tree assembled from a combination of smaller phylogenetic trees, which may have been based on different data sets and taxon sampling (Bansal et al., 2010). A supertree may be not fully resolved and not highly overlap with its source trees (Bininda-Emonds, 2010).
In this study, we address the restrictions of current available tree visual comparison frameworks by introducing a web-based framework for comparing phylogenetic trees side by side, iPhyloC, which accepts binary and nonbinary trees as input, regardless of their overlapping level. This article describes iPhyloC, along with a new corresponding subtree (CST) technique, and discusses its enhancements in light of phylogenetic hypotheses within the insect order Diptera.
2. Methodology
We developed iPhyloC using the PHP programming language as the principal language on the server. For the tree pruning, we used the function “drop.tip”’ from the R package “ape” (Paradis et al., 2004; Paradis, 2011). Whereas for the alphabetical order or the trees taxa, we used the function “nw_order” from the “Newick Utilities” (Junier and Zdobnov, 2010) library, which is developed in C++. Finally, for the trees’ interactive visualization, we modified the “phylotree.js” (Shank et al., 2018) library, which is based on the “D3.js” data visualization library.
Further in-depth trees’ comparison and annotations are carried out using interactive Scalable Vector Graphics (SVG) elements and the JavaScript programming language, which runs in the user's browser. We deployed the web-based framework on a cloud server running Ubuntu 18.04.5 with 2 Intel Xeon processors, and 7.6 GB memory. iPhyloC can be accessed through the following link http://nuvem.ufabc.edu.br/iphyloc/.
To test iPhyloC, we used phylogenetic data from published studies on insect evolution. First, we constructed a phylogenetic supertree based on three source trees depicting the phylogeny of different groups of Diptera (Arthropoda: Holometabola), with different numbers of terminal nodes (taxa) (Wiegmann et al., 2011; Ševčík et al., 2016; Li et al., 2017). Through the framework BuM (Hammoud et al., 2019), we generated the combined MRP-matrix (Baum and Ragan, 2004). The resultant supertree consisted of 146 terminal taxa. This supertree was used to compare the functions provided by iPhyloC against the most recent similar framework, Phylo.io (Robinson et al., 2016).
iPhyloC belongs to the Few in Full category of visual comparison frameworks categorization proposed by Liu et al. (2019), which comprises systems that handle a small number of trees (often two) with a massive number of nodes per tree, making them scalable and allowing in-depth comparison between the trees. We conducted a scalability test of iPhyloC using a MacBook Air (early 2014, 1.7 GHz Dual-Core Intel Core i7 processor, and 8 GB 1600 MHz DDR3 memory). With the function rtree offered in the R package “ape” (Paradis et al., 2004; Paradis, 2011), we generated random phylogenetic trees with up to 110,000 leaf nodes, and iPhyloC was able to handle them properly.
3. Results
3.1. iPhyloC: general description
iPhyloC handles two phylogenetic trees at the same time, T1 and T2, where leaf nodes correspond to taxa and have names, whereas inner nodes are not labeled. The two input trees can be fully or partially resolved. The terminal taxa do not need to be the same in both trees, a particular enhancement of iPhyloC compared with most of the available tools, which deal only with trees composed of the same set of taxa. T1 and T2 should not have paralog terminals. Figure 1 depicts the binary tree, nonbinary tree, and tree with paralogs concepts.

Types of phylogenetic trees. Left: Resolved (binary or dichotomous) tree. Middle: Partially resolved tree, with polytomies. Right: Tree with paralogous terminal taxa.
iPhyloC provides the following interactive resources:
3.2. iPhyloC: steps
Each of the input trees, T1 and T2, should be provided in parenthetical format (or Newick format) ending with a semicolon (;) as follows:
(Vermileonidae, (Austroleptidae, (Pelecorhynchidae, (Rhagionidae, (Athericidae, Tabanidae)))));
iPhyloC starts with three preprocessing steps: nonshared taxa pruning, finding the strict consensus tree of T1 and T2, and taxa alphabetical sorting while avoiding edge crossing, ensuring that the phylogenetic information continues the same. Then, iPhyloC displays the preliminary comparison between the trees highlighting the common taxa.
3.2.1. Phylogenetic trees preprocessing
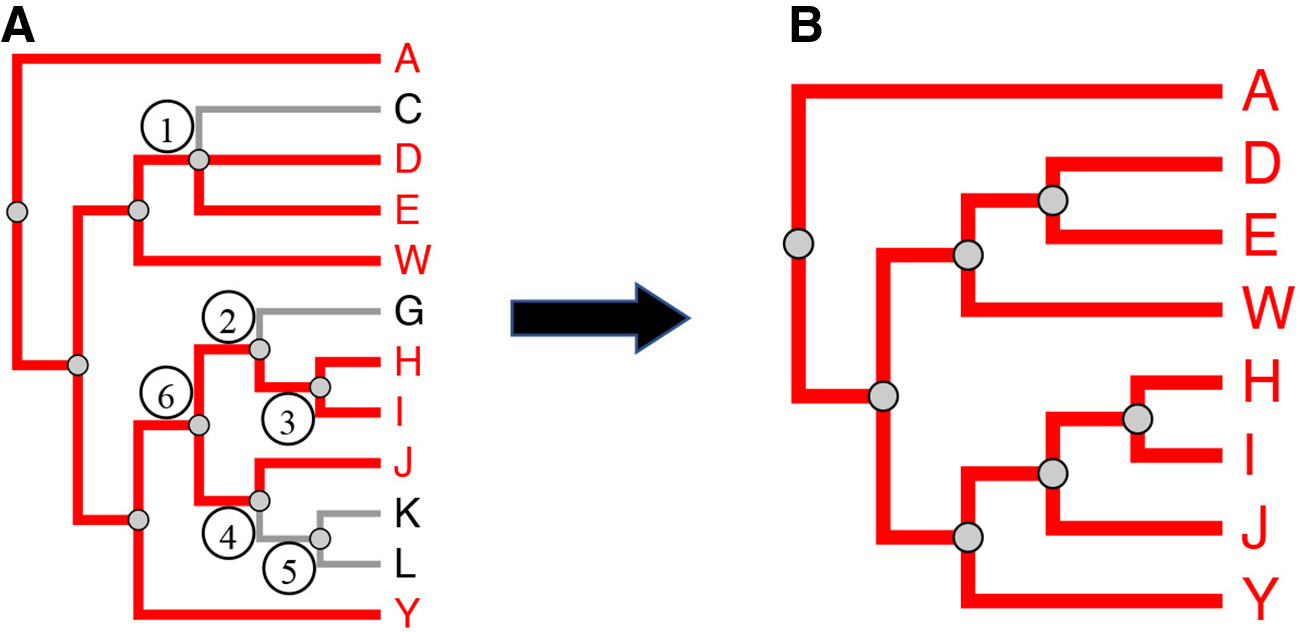
Phylogenetic trees pruning.
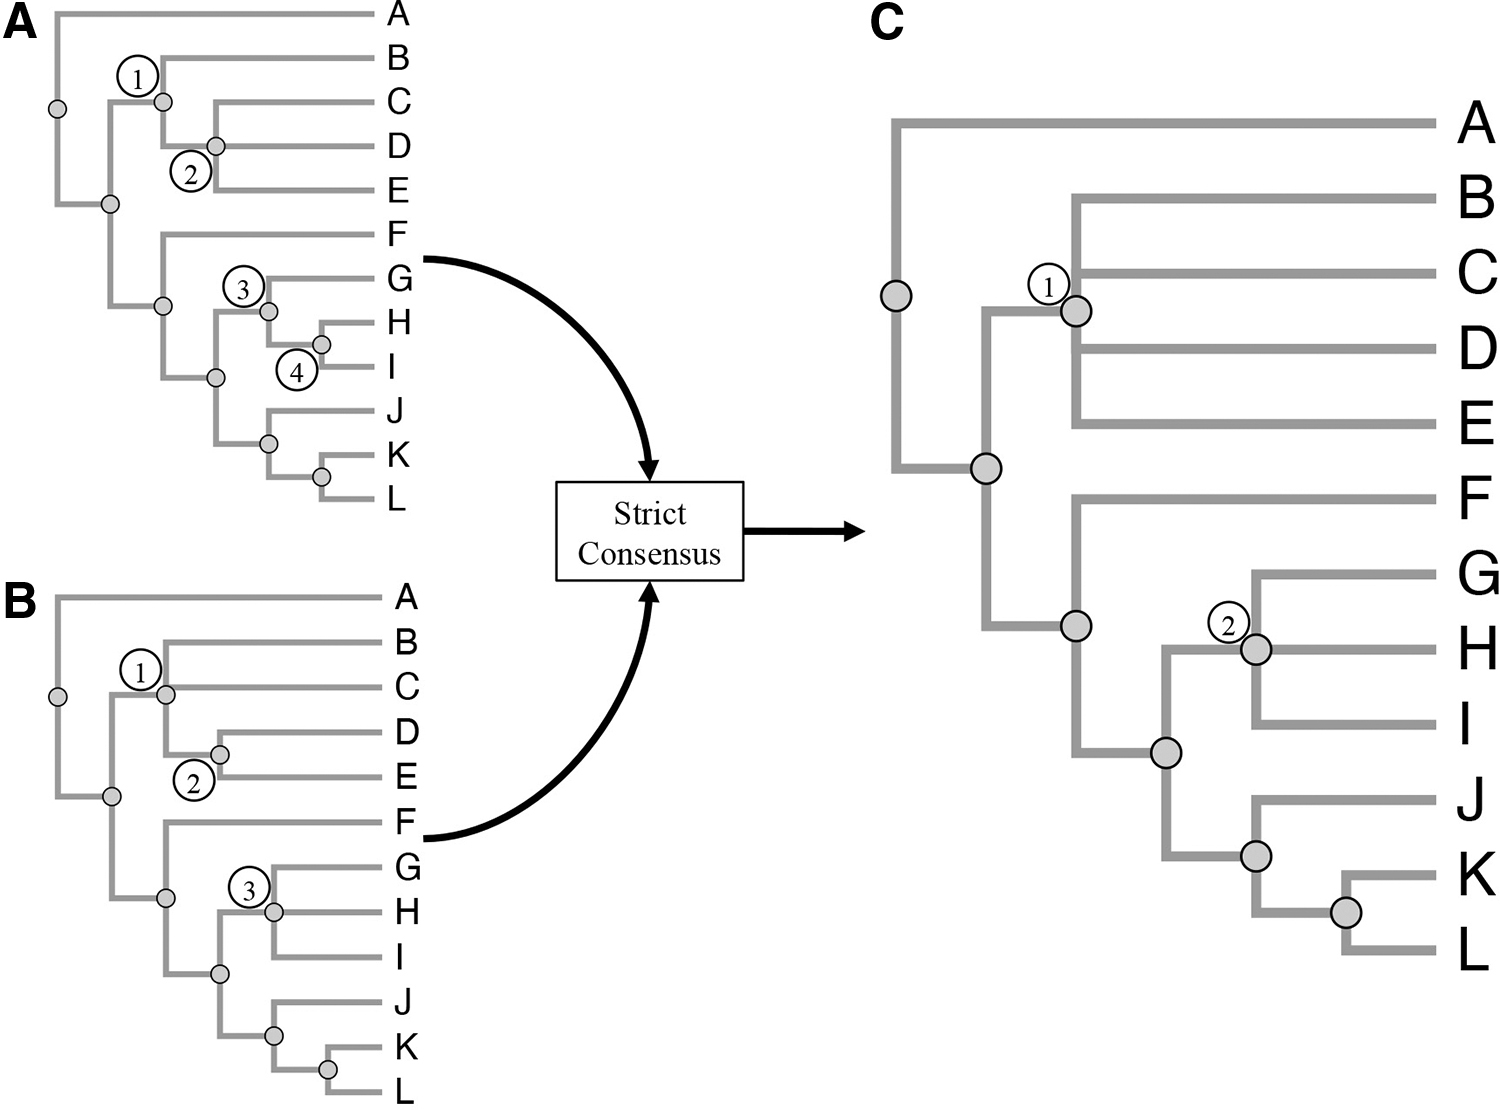
Strict consensus.
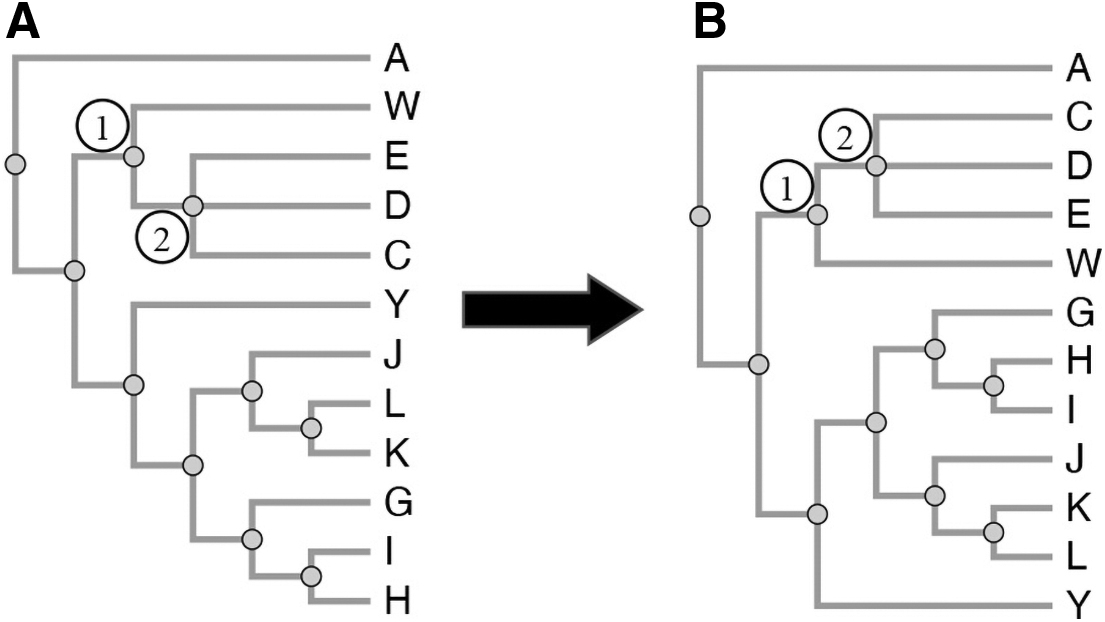
Phylogenetic tree ordering.
The results of the preprocessing steps are four variations of each tree: the original uploaded tree Ti, the original tree with alphabetically ordered taxa (
3.2.2. Structural comparison
After the preprocessing step, iPhyloC allows:
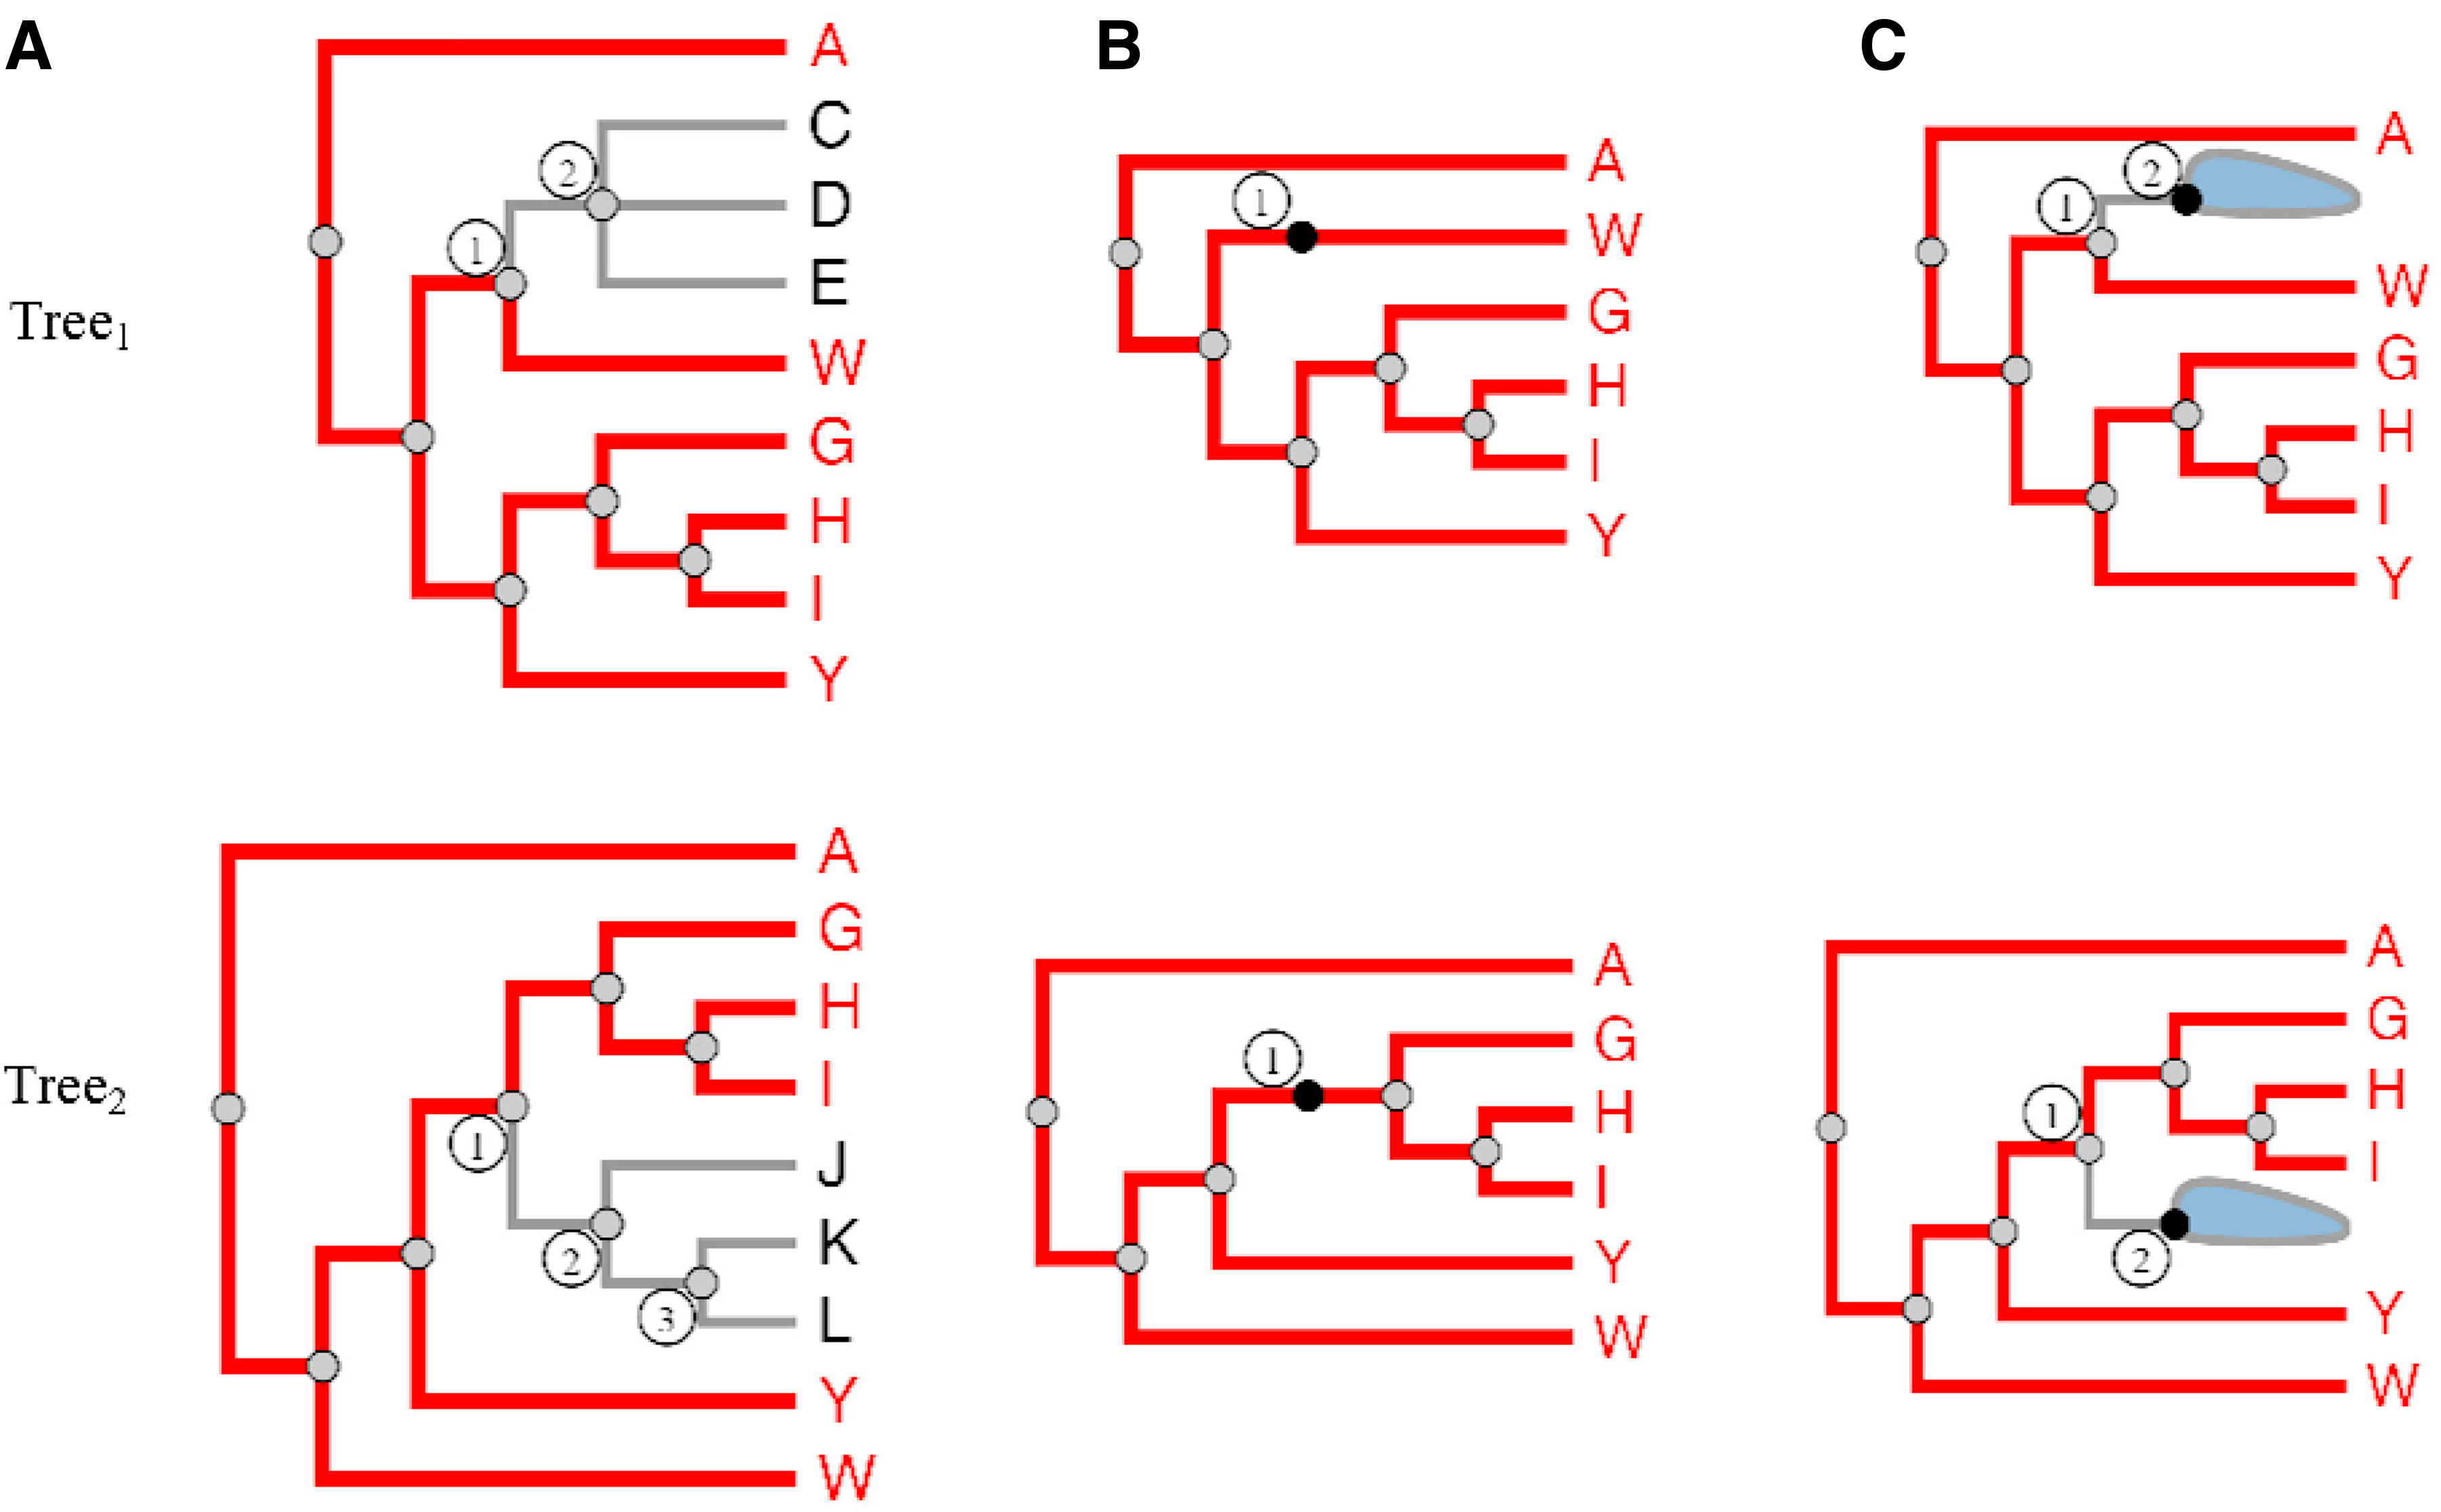
Structural comparison.

Finding the CST. Details in the text. CST, corresponding subtree.
where n1 denotes the inner node that the user selected from
The search finishes in a specific subtree from T2 when
CST does not work when the user selects a leaf node, it works only on inner nodes. For leaf node selection, iPhyloC will not calculate the s index for the selected taxon, denoted as t, but will only search if the selected taxon from T1 exists in T2. If t exists in T2, then it will be highlighted.
As shown in Figure 6, when the user selects node
3.2.3. Trees visualization and annotation
Figure 7 shows both linear and radial layouts in iPhyloC. We kept the design of CST as simple and intuitive as possible rather than cluttering the visualization with information. Each node in the CST has a similarity index
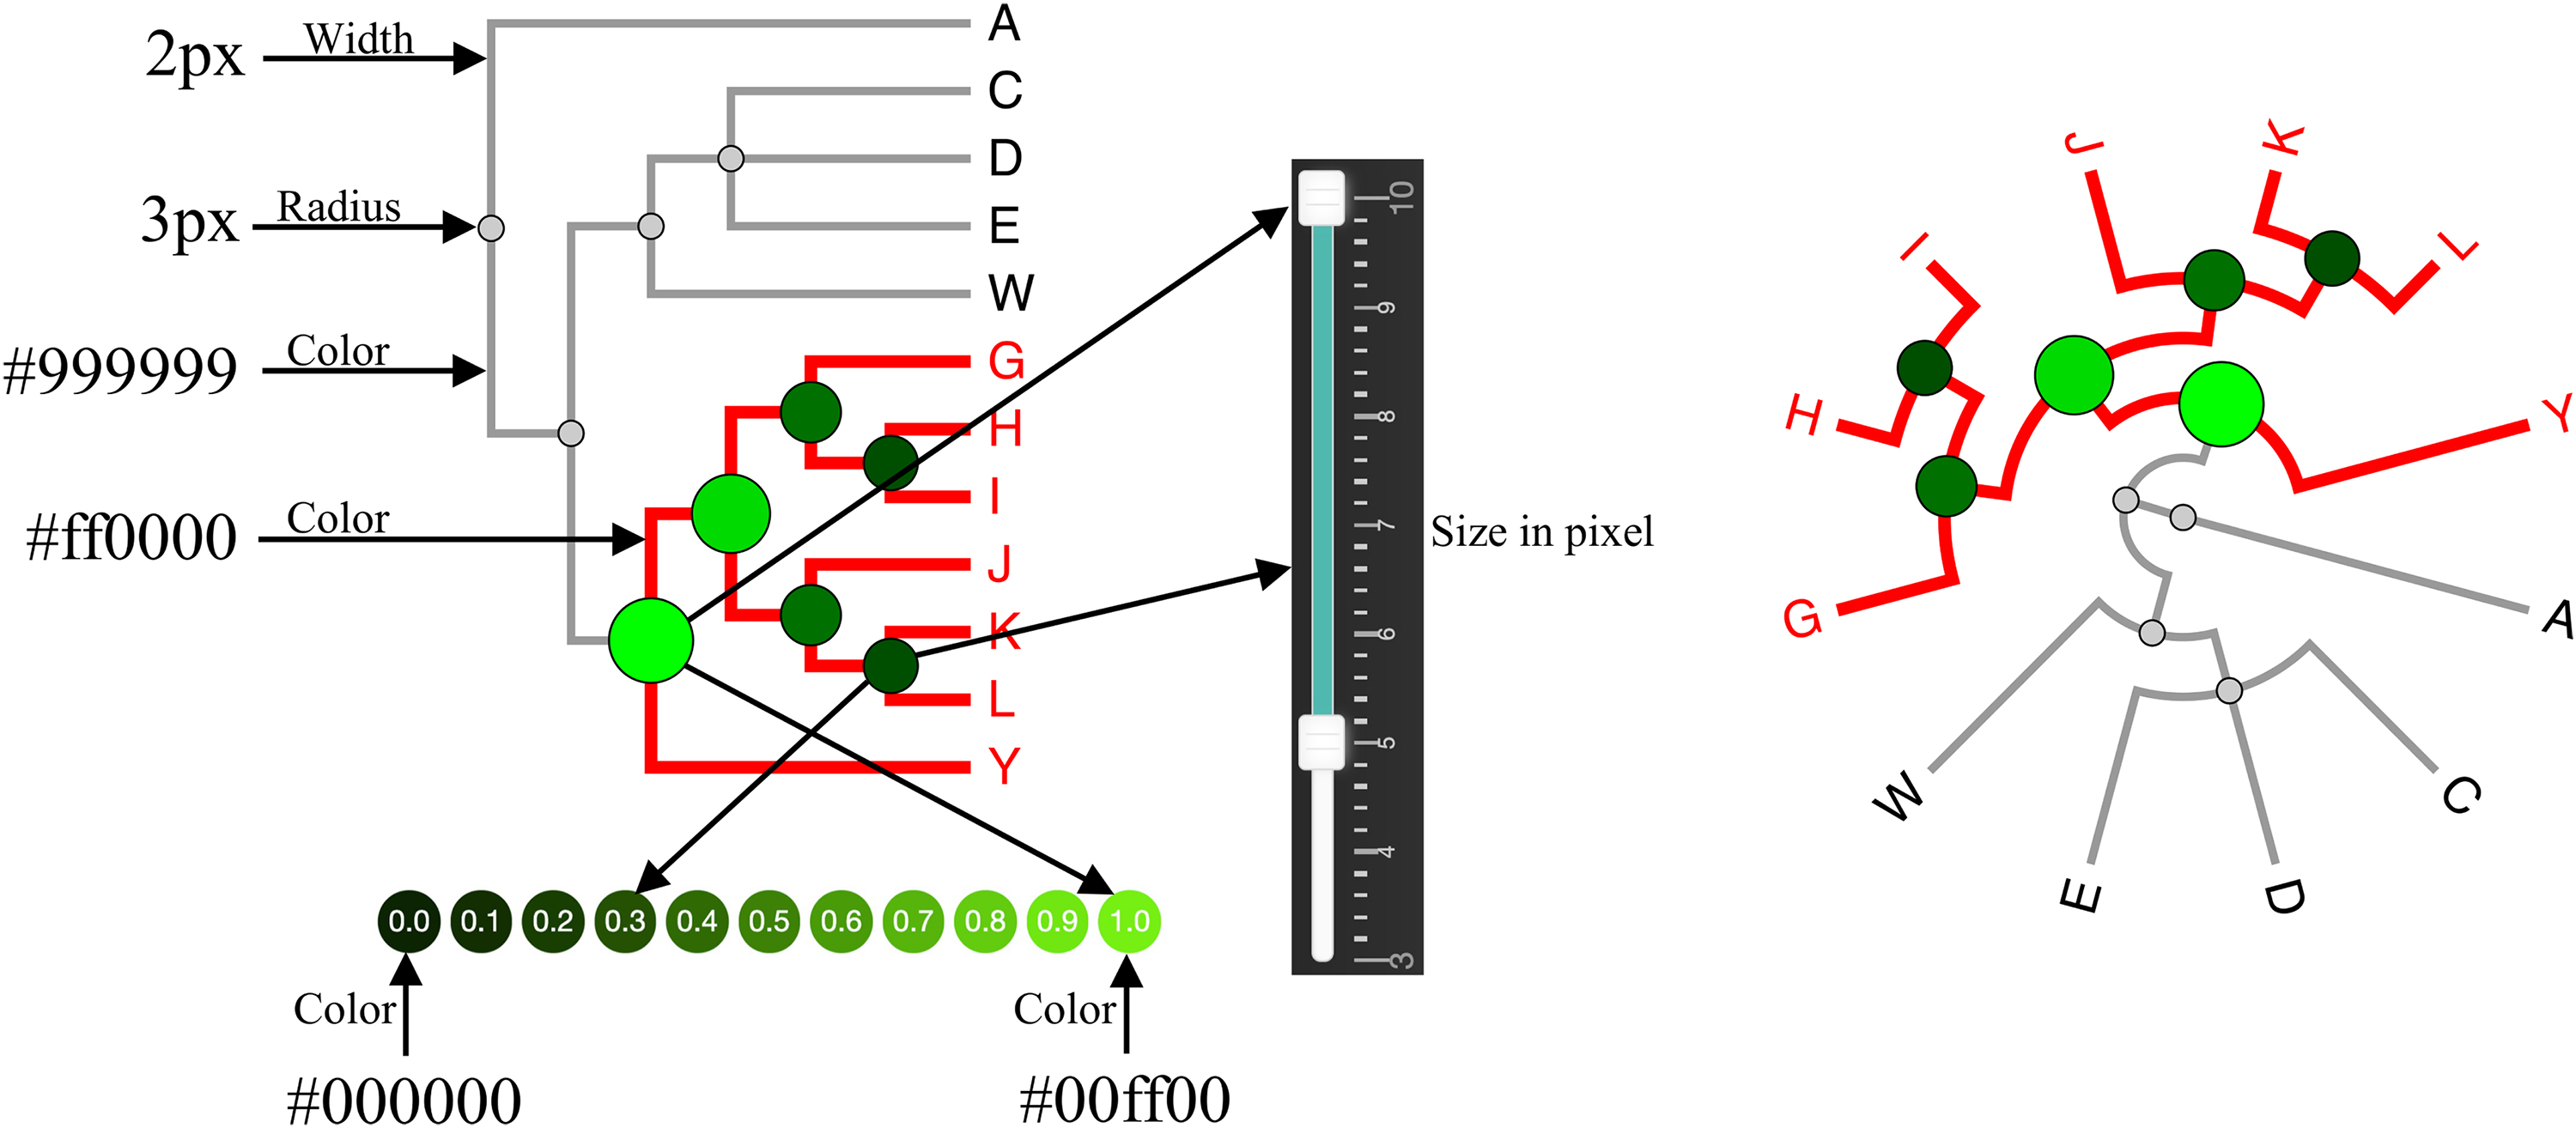
Linear tree layout (left side) and radial tree layout (right side) visualization. The user can control the radius of the CST nodes using a double handles slider. The color scale of the CST nodes is shown at the bottom.
where nr refers to the node's radius in pixels, and
iPhyloC allows annotating the phylogenetic trees subject to comparison using a set of text elements and basic shapes (rectangles and arcs) as shown in Figure 8. Such an annotation function is absent from the other available tree comparison frameworks.
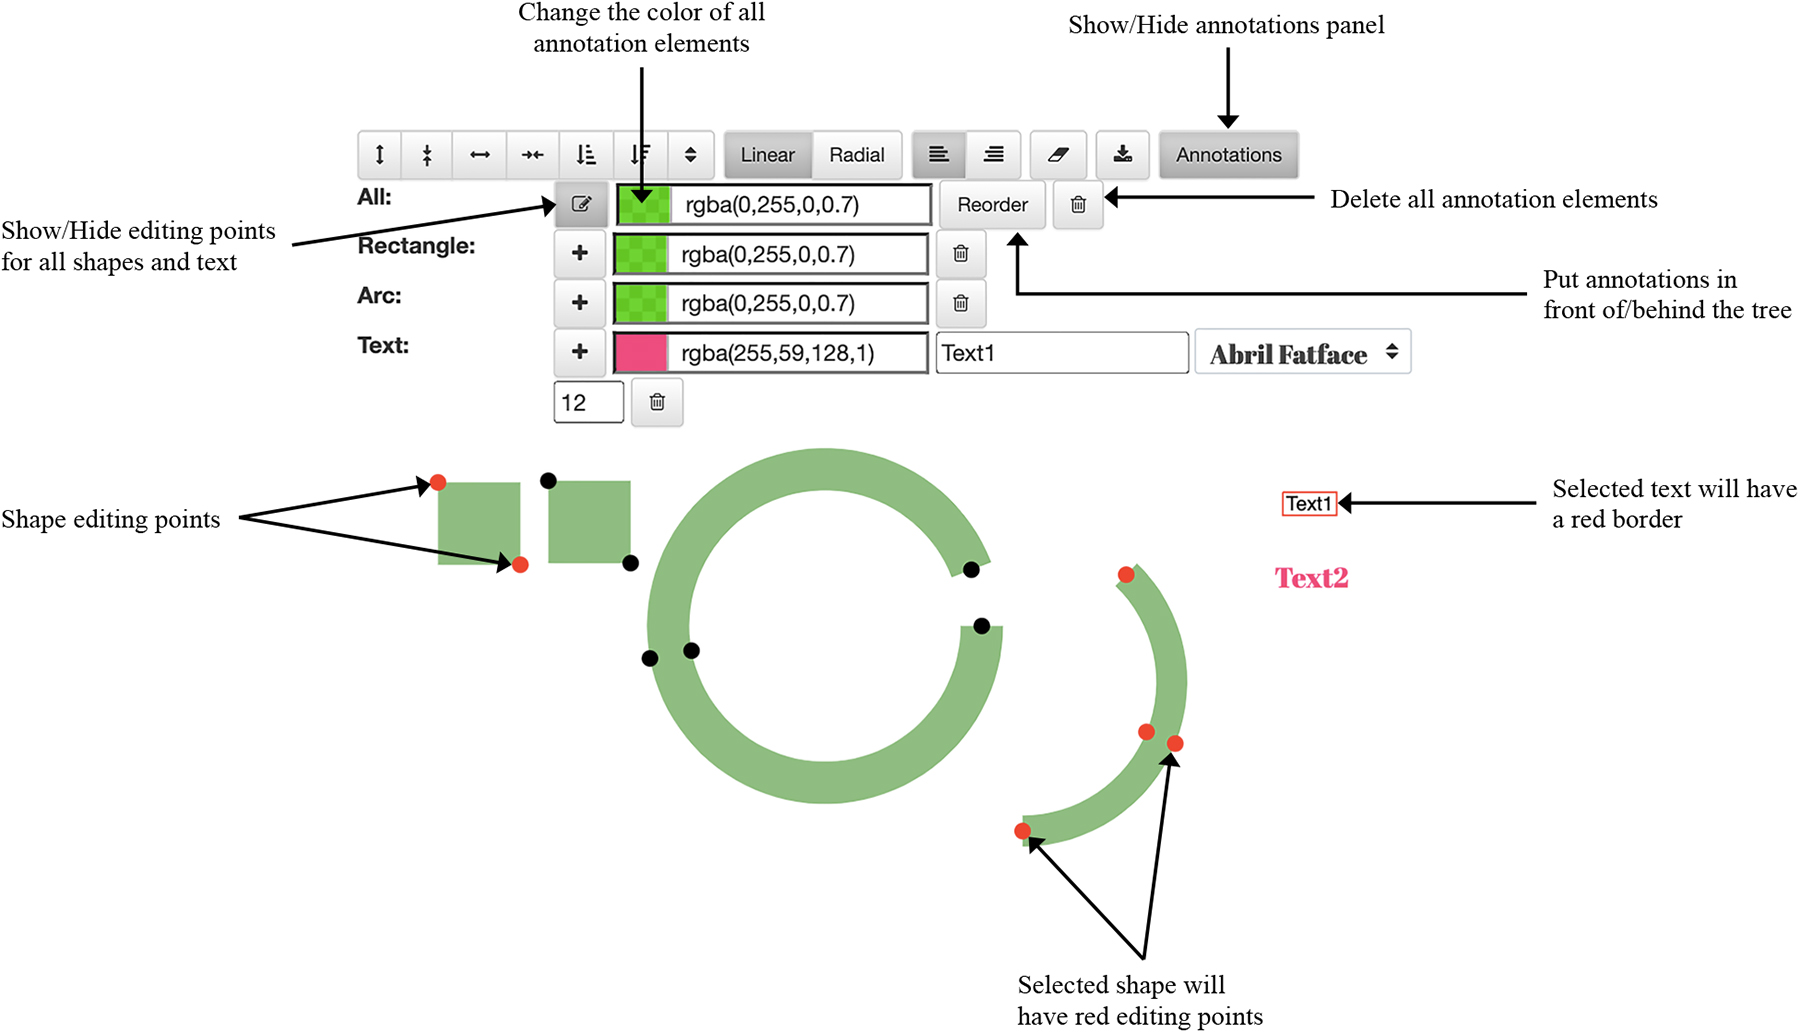
Annotations’ functionality in iPhyloC.
A new annotation shape (a rectangle or an arc) or text element is added in the top-left corner and can be moved to the tree visualization area. Changing its size is done by dragging the small red circles attached to it (the shape's editing points). The user can change the color of all shapes and text elements, delete them, and put them in front of or behind the phylogenetic tree using the buttons in the annotations’ toolbar. The “reorder” functionality is important because the user can interact only with the top layer of the SVG element. Thus, to allow interaction with the phylogenetic tree while it is annotated, and to avoid the annotation shapes blocking or blurring the tree, it is necessary to change the order of the SVG layers.
3.2.4. Tree exporting
iPhylo allows exporting the visualized trees and their annotations in SVG format, which offers very high-resolution images in small file sizes, and can be easily edited for publication in any vector illustration software.
3.3. Comparing iPhyloC to available tools of tree comparison
In this study, we compare iPhyloC to Phylo.io (Robinson et al., 2016) in the context of a previously inferred supertree of Diptera. The importance of testing this scenario relies on the very nature of a phylogenetic supertree. As aforementioned, sometimes a supertree barely overlaps its source trees. Besides, not all of the internal nodes of a supertree are resolved, and polytomies are common. Current phylogenetic tree comparison frameworks do not consider this case. For the remainder of this usage scenario, we inferred a phylogenetic supertree based on three source trees taken from Wiegmann et al. (2011), Ševčík et al. (2016), and Li et al. (2017). Then, we compared the tree from Ševčík et al. (2016) (T1) with the supertree here inferred (T2).
Figure 9 shows the first view of T1 and T2 in iPhyloC and Phylo.io, respectively. iPhyloC uses dusty gray for the branches of nonshared taxa or their inner nodes, and red for the branches of the shared taxa or their inner nodes. This provides a fast and clear idea about the general similarities between T1 and T2. Differently, Phylo.io employs a scale of colors starting from yellow to blue, which represents the degree of correspondence of a branch calculated according to the Best Corresponding Node index (Munzner et al., 2003). Having to interpret several colors when looking at the nonshared taxa between T1 and T2 is not straightforward.

A comparison between iPhyloC and Phylo.io. We use only two colors in iPhyloC: dusty gray and red. Phylo.io uses a scale of colors to visualize the correspondence degree.
An example of the differences between iPhyloC and Phylo.io concerning the use of colors is the last taxon at the bottom of T2, Megamerinidae, which is not shared with T1 (Fig. 9). In Phylo.io, the branch that connects Megamerinidae to the most recent common ancestor shared with the other Diptera is yellow, whereas the branch of other nonshared taxa is gray, which makes the task of finding shared and nonshared taxa ambiguous. In contrast, the same task in iPhyloC is straightforward.
In iPhyloC, we offer CST instead of BCN as in Phylo.io. Figure 10 exemplifies CST in iPhyloC where we compare the fully expanded tree with the supertree having all nonshared taxa collapsed. We selected a node from T1 and iPhyloC showed its CST index in T2 using the node size and the color scale shown at the bottom of the figure to encode the correspondence degree of each inner node of the CST. In addition, iPhyloC offers the ability to mirror the right-hand tree as well.
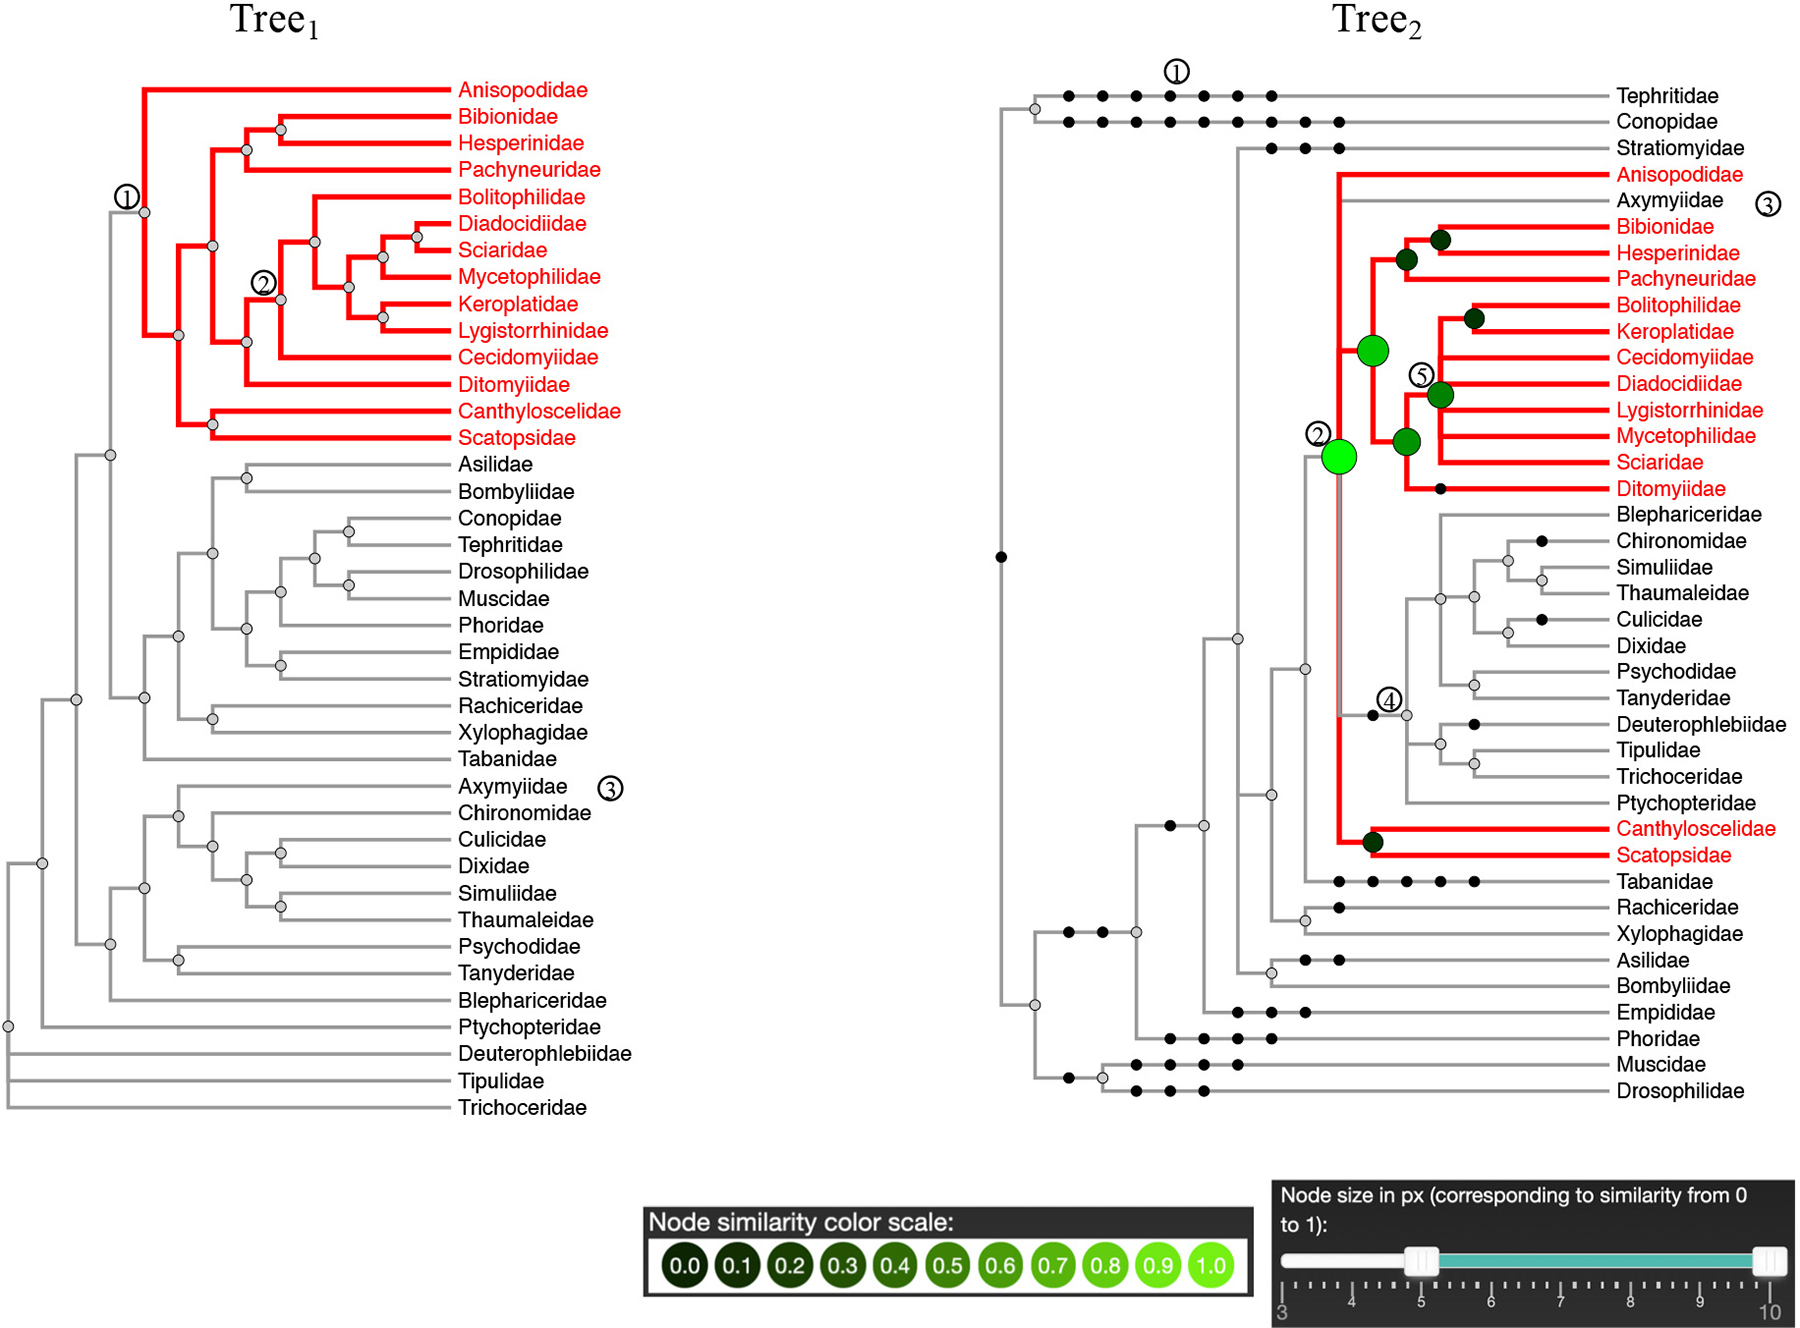
Comparing two trees of Diptera, after collapsing the nonshared leaf nodes, as in node 1 in Tree1, and Tree2, a supertree. This figure shows the CST of node 1 in Tree1, which is rooted at node 2 in Tree2. The user can notice the structural differences between node 2 in Tree1 and node 5 in Tree2.
Our framework also provides the radial tree layout, which is especially important when exploring large-scale trees (with 100 or more taxa) and eases the process of highlighting common elements (Fig. 11).
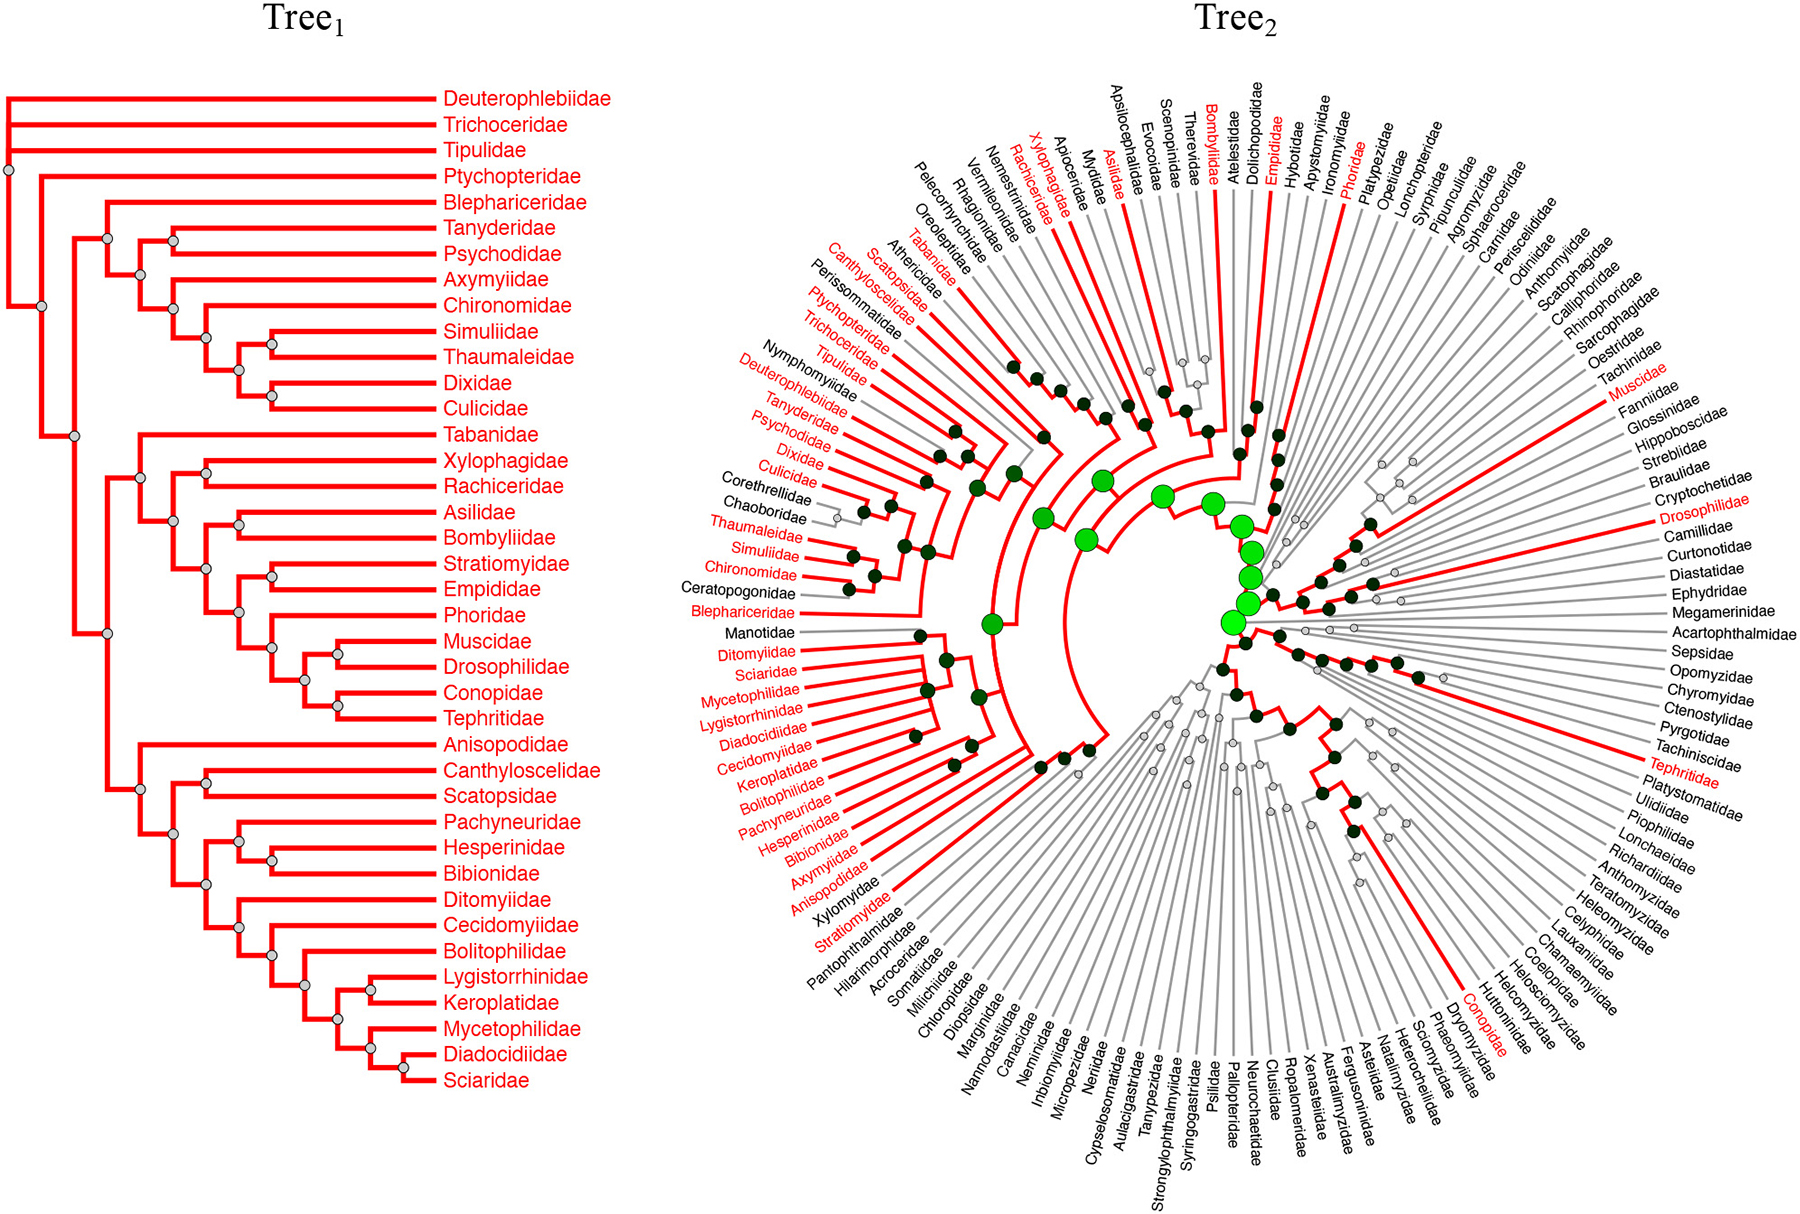
Linear and radial tree layouts. The radial layout is especially beneficial with large trees (Tree2 in this example consists of 146 taxa).
4. Discussion
We tackle the problem of one-to-one tree comparison in the domain of phylogenetic tree analysis through a novel framework named iPhyloC, along with a new comparison technique, the CST. Generally, comparison frameworks accept as input only fully resolved (binary) and highly overlapping trees or those with the same sets of taxa. In this study, we consider a usage scenario that demands a different approach: phylogenetic supertrees. Comparing source trees with the inferred supertree is especially hard because, in most cases, the supertree presents polytomies and differs from most of its source trees. iPhyloC succeeds in such a task.
iPhyloC is especially helpful for exploratory analyses, allowing the identification of clades stable enough to be present in several different phylogenies with a similar composition of terminals and phylogenetic relationships within them, suggesting that such groups are natural ones and not artifacts of a classification system. The correspondence of phylogenetic patterns among different trees, as visualized in iPhyloC, would help to implement an evaluative “criterion of reality” of a phylogenetic tree as a scientific theory (Capellari and Santos, 2012).
Even if the relationships of two sets of similar terminals are not correspondent, this may be interpreted as a positive result, since it indicates the need for additional systematics studies for unveiling more robust evolutionary scenarios. Such a feature is also useful for educational purposes, especially for showing the students that phylogenies are transient hypotheses, similar to any other scientific theory (Nelson and Platnick, 1981), and dependent on increased amounts of reliable data.
The power of iPhyloC arises from our design choice of not forcing the tree to fit the user's screen size and from allowing comparison in radial layout, saving more space than the linear layout. Another strength of iPhyloC over other available phylogenetic tree comparison frameworks is that the preprocessing of the trees is done using fast set-based calculations. In addition, the user can export the trees and their annotations in high-resolution SVG format.
Further work will extend iPhyloC to deal with one-to-many trees’ comparison, and to handle problems such as trees with duplicated taxa, especially relevant in gene tree investigations, host–parasite comparisons, and historical biogeographical data. Another future direction is to add visual compression techniques to enhance the visual scalability of iPhyloC.
Footnotes
Acknowledgment
We thank Daubian Santos (UFABC) for his feedback and suggestions.
Author Disclosure Statement
The authors declare they have no conflicting financial interests.
Funding Information
This study was financed by the Coordenação de Aperfeiçoamento de Pessoal de Nível Superior—Brazil (CAPES)—Finance Code 001, CNPq #307662/2019-5 (C.M.D.S.), and FAPESP #2017/11768-8 (C.M.D.S.).