




Abstract
Over the past decade, a promising line of cancer research has utilized machine learning to mine statistical patterns of mutations in cancer genomes for information. Recent work shows that these statistical patterns, commonly referred to as “mutational signatures,” have diverse therapeutic potential as biomarkers for cancer therapies. However, translating this potential into reality is hindered by limited access to sequencing in the clinic. Almost all methods for mutational signature analysis (MSA) rely on whole genome or whole exome sequencing data, while sequencing in the clinic is typically limited to small gene panels. To improve clinical access to MSA, we considered the question of whether targeted panels could be designed for the purpose of mutational signature detection. Here we present
1. INTRODUCTION
Over the past few decades, research has revealed that cancer is a disease characterized by the accumulation of mutations (Stratton et al., 2009; Garraway and Lander, 2013; Kandoth et al., 2013; Gerstung et al., 2020). Over the lifetime of an organism, cells acquire mutations at random positions in the genome. Certain mutations disrupt the function of cellular systems, and if certain cellular systems are disrupted simultaneously, a cell can lose its ability to regulate its rate of reproduction. Dysregulation of the reproductive cycle is one of a handful of “hallmark” qualities (Hanahan and Weinberg, 2011), which together transform a healthy cell into a cancer cell. These hallmark qualities are shared by all cancers, but they can be caused by random mutations in many respective genes. Furthermore, many such genes are mutated only at low frequency, implying that there are numerous combinations of mutated genes that can lead to cancer [e.g., see the analysis by Lawrence et al. (2014)]. The randomness involved in determining a cell's path to the disease state is responsible for part of the difficulty of treating cancer (Zugazagoitia et al., 2016). Since cancer genomes vary so widely, the set of therapeutic targets does also, necessitating a diverse set of treatment strategies and engendering difficult decisions about which one to use for a given patient.
One silver lining to this situation is that the random process by which mutations are acquired in the genome is not uniform—it is patterned (Helleday et al., 2014). For example, mutations acquired by smoking tend to produce a different pattern than those acquired from UV radiation (Nik-Zainal et al., 2015) or those acquired endogenously through errors made during genome replication (Tubbs and Nussenzweig, 2017), etc. Recent work demonstrates that identifying which of these mutational processes are active in a tumor genome provides a useful basis with which to categorize the diverse landscape of tumor phenotypes (Hoeck et al., 2019). Indeed, such activity can serve as an effective biomarker in the clinic. Past work has shown that certain mutational processes can indicate a tumor's vulnerability to particular therapies. One prominent example is mismatch repair deficiency, which can indicate the effectiveness of checkpoint inhibitor immunotherapy (Le et al., 2017). A second is homologous recombination repair (HR) deficiency, which can indicate effectiveness of poly ADP ribose polymerase (PARP) inhibitor therapy (Farmer et al., 2005; Lord and Ashworth, 2017).
Designing and applying methods for the detection of mutational processes is an ongoing effort in the computational cancer biology community. The most well known approach was pioneered in 2012 by Nik-Zainal et al. (2012), who utilized machine learning methods to extract the “signature” patterns of several mutational processes from aggregated tumor genome samples. Alexandrov et al. (2013b) formalize a mutational signature as a probability distribution over a set of mutation categories—that is, they suppose that a given mutational process can be identified by the frequency with which it causes each type of mutation. Their landmark article utilized distributions over 96 mutation categories, defined by all possible single base substitutions (SBS) with trinucleotide context. To infer the signatures from the data, they formulated a simple linear model of a tumor's mutations. In their model, a relatively small number of mutation signatures are shared across tumors, and the mutations of each tumor are given as a linear combination of these shared signatures plus some noise.
To realize this model, they apply non-negative matrix factorization (NMF) to genome-wide mutation counts on a large cohort of tumor samples. When applied to this problem, NMF infers a set of mutational signatures, as well as the activity of each signature on each genome in the cohort (often called the exposure). While other learning algorithms and schemes for categorizing mutations have been used, this approach remains the most common method of signature extraction in mutational signature analysis (MSA) studies (Alexandrov et al., 2013a, 2020; Kim et al., 2016). The current state of the art for SBS mutational signatures identified 49 signatures, extracted from an analysis of 23,829 tumors. Recent work has highlighted mutational signatures as a powerful diagnostic tool for clinical use, with several signatures implicated as potential therapeutic biomarkers (Davies et al., 2017; Van Hoeck et al., 2019).
While these results are indicative of great promise for the future of cancer treatment, current clinical treatments are largely unable to take advantage of these advances. This is primarily due to the outsized sequencing requirements of the computational methods used in MSA studies (Alexandrov et al., 2013b, 2020) relative to current clinical sequencing practices (Frampton et al., 2013; Cheng et al., 2015). The “gold standard” data source for MSA studies is whole-genome sequencing (WGS). This is because WGS gives a complete and unbiased picture of the mutations present in a tumor genome, which affords increased accuracy during signature extraction. When WGS data are not available or in short supply, MSA studies also commonly use whole-exome sequencing (WES) as a data source. WES takes a subset of the genome that is smaller but still sizable—it is thus cheaper to sequence but still provides utility for signature extraction.
Almost all MSA studies use WGS or WES to obtain mutation counts in tumor genomes. By contrast, WGS and WES are unavailable to most cancer patients—current clinical sequencing practices are commonly limited to targeted sequencing. This term refers to precisely-aimed therapeutic assays that sequence small pieces of the genome with known biological importance. This can provide valuable information about particular genes of interest, but provides a much more limited picture of the distribution of mutations on the genome which MSA seeks to assess. Concretely, targeted sequencing assays identify ∼1000 × fewer mutations compared to WGS (Nik-Zainal et al., 2020) and ∼100 × fewer mutations than WES. Furthermore, while there have been calls to make large-scale sequencing assays clinically available, ramping up production of sequencing data in the clinic will take time and resources. Despite the decreasing costs of sequencing itself, providing large-scale genomic sequencing to patients requires infrastructure for analysis, interpretation, and storage of the resulting data. Thus, WGS in particular is unlikely to be offered as a routine clinical diagnostic for many years to come (Nik-Zainal et al., 2020). In the meantime, the therapeutic impact of MSA in the clinic is tied to the important open problem of inferring signature activity from targeted sequencing assays.
A few recent studies have designed methods to detect mutational signature activity from clinically accessible targeted sequencing assays. Campbell et al. (2017) found that in patients with hypermutation, panel data could be used to infer exposures using standard methods (Rosenthal et al., 2016). Gulhan et al. (2019) introduced SigMA to detect signature activity indicative of homologous recombination repair deficiency, with a specific focus and application to gene panel data. Sason et al. (2020) introduced Mix to infer mutational signatures and their exposures in clusters of patients for use on datasets with few mutations per patient. In general, these studies make methodological modifications to account for the limited sample of the genome afforded by targeted sequencing assays. Even still, these methods are constrained by which regions of the genome are sampled. In particular, these works have sought to detect signature activity from two existing targeted sequencing assays: the Memorial Sloan Kettering Integrated Mutation Profiling of Actionable Cancer Targets (MSK-IMPACT) (Cheng et al., 2015) and FoundationOne Panel Sequencing (Frampton et al., 2013).
These panels are designed to identify specific actionable mutations, which are most commonly found in genes linked with cancer. This goal is fundamentally different from the goal of MSA, which seeks to analyze the distribution of mutations over the genome. Accordingly, such panels likely provide a biased view of the true mutation distribution. This is evidenced by a recent prominent study which showed that mutations in cancer genes (which are common locations of actionable mutations) are subject to powerful selective pressure due to their impact on the fitness of a tumor. The authors showed that this can result in distributions of mutations that are not representative of the underlying mutational signatures (Temko et al., 2018). Thus it is likely that other regions of the genome are more suitable for interrogating the genome-wide distribution of mutations.
The problem of designing new targeted sequencing assays tailored to the goals of MSA has been explored in a very limited capacity. One previous study contained a short analysis to identify a panel-sized set of genes, which could be used to detect one specific mutational signature (Polak et al., 2017). This analysis did not consider noncoding regions as candidates for the panel and generally was not the main focus of the article. Perner et al. (2020) recently introduced mutREAD, an assay for detecting mutational signature activity, but their approach concerns the method by which the DNA is sequenced rather than panel construction. To our knowledge, no existing study tackles the generalized problem of identifying a panel-sized set of genome regions that are suitable for the detection of signature activity. We take aim at this problem in the present study.
1.1. Contributions
In this study, we present
We train
2. PRELIMINARIES
For the purposes of this work, we shall refer to a mutational signature (or signature for ease of exposition) as is seminally defined by Nik-Zainal et al. (2012) and Alexandrov et al. (2013a,b). A signature is a multinomial distribution over a set of mutation categories. The most commonly studied mutation categories are SBS and their immediate
Each tumor or sample (belonging to a patient), whose genome is sequenced, can be summarily described by a 96-dimensional count vector of observed SBS belonging to each mutational category. MSA assumes that each observed mutation is emitted by a unique mutational signature, and it is generally assumed that only a few signatures are active in a tumor and in a cancer type. Briefly, MSA usually involves (1) deriving the distributions of the latent mutational signatures active in a cohort of samples; and/or, (2) determining the exposure each sample has to each signature—the proportion of mutations in each sample emitted by each signature.
In this work, we consider problems relating to the latter, more clinically relevant problem where a candidate set of potentially active mutational signatures in each sample is given and known. We perform analysis with respect to a canonical and widely adopted set of signatures determined by the Catalogue of Somatic Mutations in Cancer (COSMIC) ver. 2, and will always refer to (and index) COSMIC signatures by their numerical names (e.g., Signature 1) (Tate et al., 2019).
3. METHODS
A panel optimized for detecting signature activity should consist of a small set of genomic regions which, when sequenced, allow the accurate identification of genome-wide patterns of mutations. Initially, one may ask whether this is a feasible goal. For intuition, we refer to previous work which shows a strong relationship between cancer type and regional mutation density (Jiao et al., 2020), as well as other regionally varying chromatin features (Polak et al., 2015). Furthermore, many mutational signatures are tied to molecular mechanisms which vary in their activity over the genome (Haradhvala et al., 2016; Morganella et al., 2016). These findings suggest that some mutational processes may prefer to cause mutations in specific regions of the genome. Therefore, some regions of the genome may be far more informative than others for assaying the activity of these processes and their associated signatures.
Finding these informative regions poses a significant challenge, in part, due to the technical attributes of NMF, the most widely-used algorithm for signature extraction (Alexandrov et al., 2013a; Kim et al., 2016). Notably, NMF depends only on genome-wide mutation counts as input. Thus, NMF determines only the counts of mutations attributed to each signature and is agnostic to the location of mutations in the genome. This presents a barrier for understanding the regional distribution of signature activity.
Furthermore, NMF is computationally intensive, and its resource requirements are amplified within the present use case. Broadly, the outputs of NMF lack robust structure: solutions are nonunique, the loss surface is nonconvex, and several random initializations of the algorithm or specialized initialization approaches (Boutsidis and Gallopoulos, 2008) are required to obtain a reliable result. Thus, it is computationally intractable to utilize NMF to compute signature activity and explore the combinatorial space of possible panels.
One way to respond to these challenges is by simplifying the problem. Instead of finding regions that assay the activity of all signatures at once, we break the problem down into distinct binary classification tasks. We reason that in clinical applications, signature activity serves primarily as a biomarker to decide whether a patient should receive a particular tailored treatment. In this use case, it is more important for a panel to detect if one specific signature has substantial activity on a given genome, rather than an estimate of the absolute number of mutations (or exposure) attributed to a collection of signatures. This idea guides the construction of our algorithm.
We introduce
3.1. ScalpelSig : scalar projection panels for mutational signatures
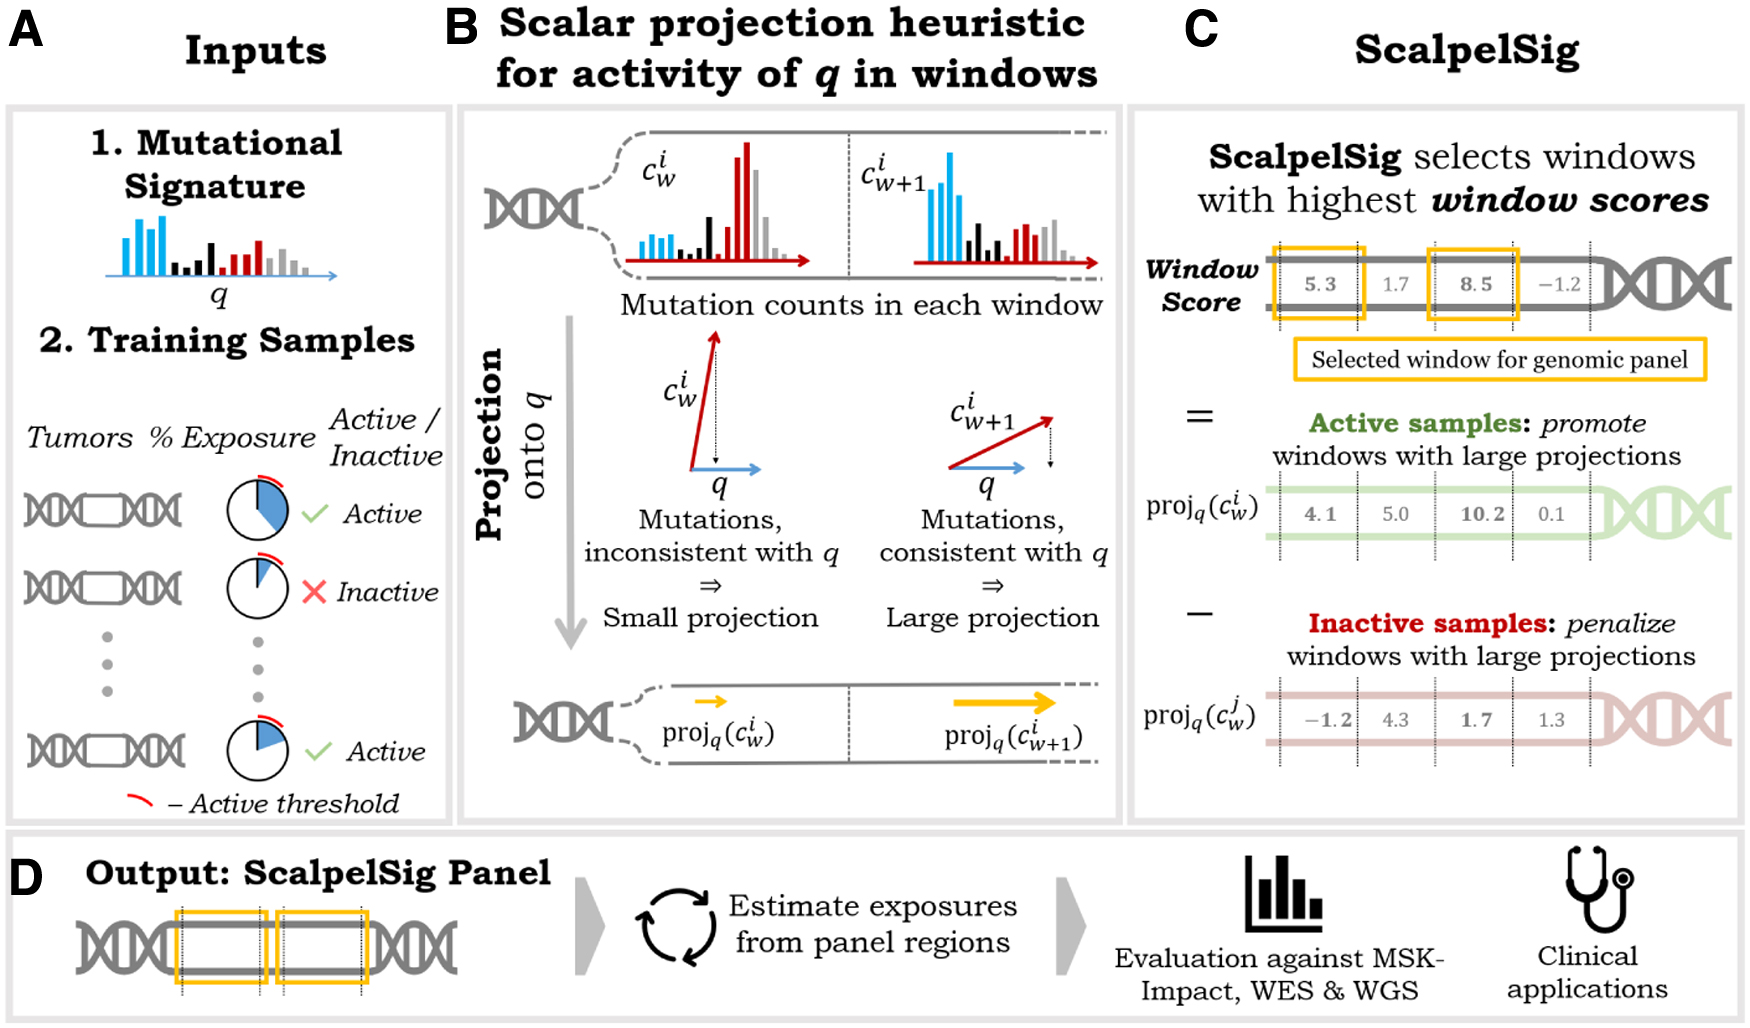
To efficiently optimize over the combinatorial space of possible panels,
Notably, the scalar projection of mutation category counts onto a mutational signature gives the magnitude of the least-loss signature activity vector (i.e., the vector that results from scaling a mutation signature by its exposure), if said signature was the only active signature in the sample. We formalize this result in Lemma 1.
Proof. We seek the exposure a such that the residual between c and aq (the exposure vector) is minimized. Writing
Writing Equation (1) as an inner product, yields:
Equation (2) is quadratic in a. Thus, we solve for a by taking the derivative with respect to a and setting it to be 0, which gives
The exposure vector aq is given precisely by the projection of c onto q. Writing the unit vector in the direction of q as
Thus, the magnitude,
Given a mutational signature q, a training set S of samples with subset A that has signature q active, and a maximum panel size N,
Let a mutational signature q be a vector representing a multinomial distribution over the standard 96 mutation categories described in Alexandrov et al. (2013b), and let
Using scalar projection as a heuristic for signature activity,
By the linearity of scalar projection, we have, for each sample i,
Thus, the objective [Eq. (4)] can be rewritten,
This formulation of the problem allows us to optimize without exploring the large combinatorial space of possible panels. Instead,
Notably, the contrastive definition of this window scoring function naturally mitigates the impact of background noise, that is, enrichment of signature-associated mutation types for spurious reasons such as underlying nucleotide composition. To see this, observe that if a window contains spurious enrichment of a set of mutation types, we would expect inactive samples to have about as many mutations of these types as active samples. As a result, we would expect the second term in the equation (the sum of scores from inactive samples) to be high, thus discouraging the selection of such a window.
Given that tumors are known to have widely varying mutation rates, it is important to ensure that the panel is not simply tailored to patients and windows with the highest numbers of total mutations. To this end, we introduce a parameter
Setting
We graphically illustrate the
3.2. Mutational signatures and breast cancer cohorts
In this work we primarily analyze a publicly available cohort of 560 breast cancer genomes (Nik-Zainal et al., 2016). We chose this dataset because of its large number of samples, and because many different mutational signatures are typically active in breast cancer (Tate et al., 2019), allowing for a varying set of test cases for our framework. Furthermore, the motivation of using mutational signatures as clinical biomarkers is particularly relevant to breast cancer, in which HR deficiency (and its associated mutational signatures) is a promising biomarker for PARP inhibitor therapy (Davies et al., 2017). WGS was performed on each sample. The dataset contains ∼3.5 million total mutations categorized into the standard 96 categories used in Alexandrov et al. (2013b).
To further assess the generalizability of
3.2.1. Computing mutational signature exposures
For the estimation of mutational signature exposures on whole genomes, as well as all
For each sample in each cohort, we compute exposures to mutational signatures taken from COSMIC (ver. 2), a curated mutational signature repository (Tate et al., 2019). In this article, we will always refer to (and index) COSMIC signatures by their numerical names (e.g., Signature 1). Only 13 of the 30 COSMIC signatures are known to be active in breast cancer: Signatures 1, 2, 3, 5, 6, 8, 10, 13, 17, 18, 20, 26, 30 (Tate et al., 2019). Accordingly, from each sample's genome-wide mutation counts, we compute exposures solely to these signatures. From these exposures, we define a sample as active for a signature if the exposure of that signature is responsible for 5% or more of the total mutations (compared to all other signatures), and inactive otherwise.
3.3. Evaluation of panels
For each signature of interest, we evaluate a
We formalize this question with the following classification task: for each sample in the test set predict whether a signature of interest is active on the whole genome, given the signature exposure estimated from mutations that fall within a
3.3.1. Comparison of ScalpelSig against MSK-IMPACT and other baselines
We primarily analyze the performance of
To further demonstrate the effectiveness of
We perform experiments only for mutational signatures that are active in >5% of samples in the breast cancer cohort (Alexandrov et al., 2013a). We also omit Signatures 1 and 5, since these signatures are known to be endogenous and “clock-like” and are expected to be present in all samples (Alexandrov et al., 2015). In sum, we perform experiments to evaluate
The Number of Active Samples in the 560 Breast Cancer Samples for the Mutational Signatures Known to Be Present in Breast Cancer
A signature is active if that signature is responsible for 5% or more of the total mutations in the sample. Signatures 6, 10, 17, 20, and 26 are active in fewer than 5% of samples and, thus, are not considered in this study. Signatures 1 and 5 are also not considered because they are expected to be active in every sample (Alexandrov et al., 2015).
We compared
We also compare
3.3.2. Evaluation on held-out breast cancer cohort
To establish that the panels discovered by
3.3.3. Assessment of robustness
We performed experiments to test the robustness of
Next, we vary the amount of data available for training the algorithm. In these experiments we construct
Finally, we vary the threshold at which samples are considered to be “active” versus “inactive.” We performed experiments where samples were considered to be “active” if the signature of interest was responsible for 1%, 5%, 10%, and 20% of the total mutations in the sample, respectively. Cases where either the active or inactive class comprised fewer than 5% of samples were discarded (consistent with the protocol for our primary set of experiments) since these cases reduce the possible variation in the test set. Since class balance varied at each different setting of the activity threshold, distinct random test/train splits were sampled for each of the settings.
3.3.4. Construction of a preliminary combined-signature panel
We performed an exploratory set of experiments to determine whether regions from individual-signature
3.4. Software
We implemented
4. RESULTS
In the desired use case for a mutational signature panel, a clinician would sequence panel regions and use them to make a judgment about the mutational signatures that have acted on the patient's genome. Accordingly, a good panel is one where signature activity within panel regions is predictive of signature activity genome wide. Our experiments measure how well a panel makes this prediction with two complementary metrics: (1) we compute AUPR for a binary classification task which asks whether a signature is substantially active in a sample given the exposure of that signature in panel regions; and (2) we compute the Spearman correlation between signature exposure in panel regions and signature exposure genome wide. In the interest of clinical accessibility, we focus on
4.1. ScalpelSig outperforms baselines
Panels discovered by
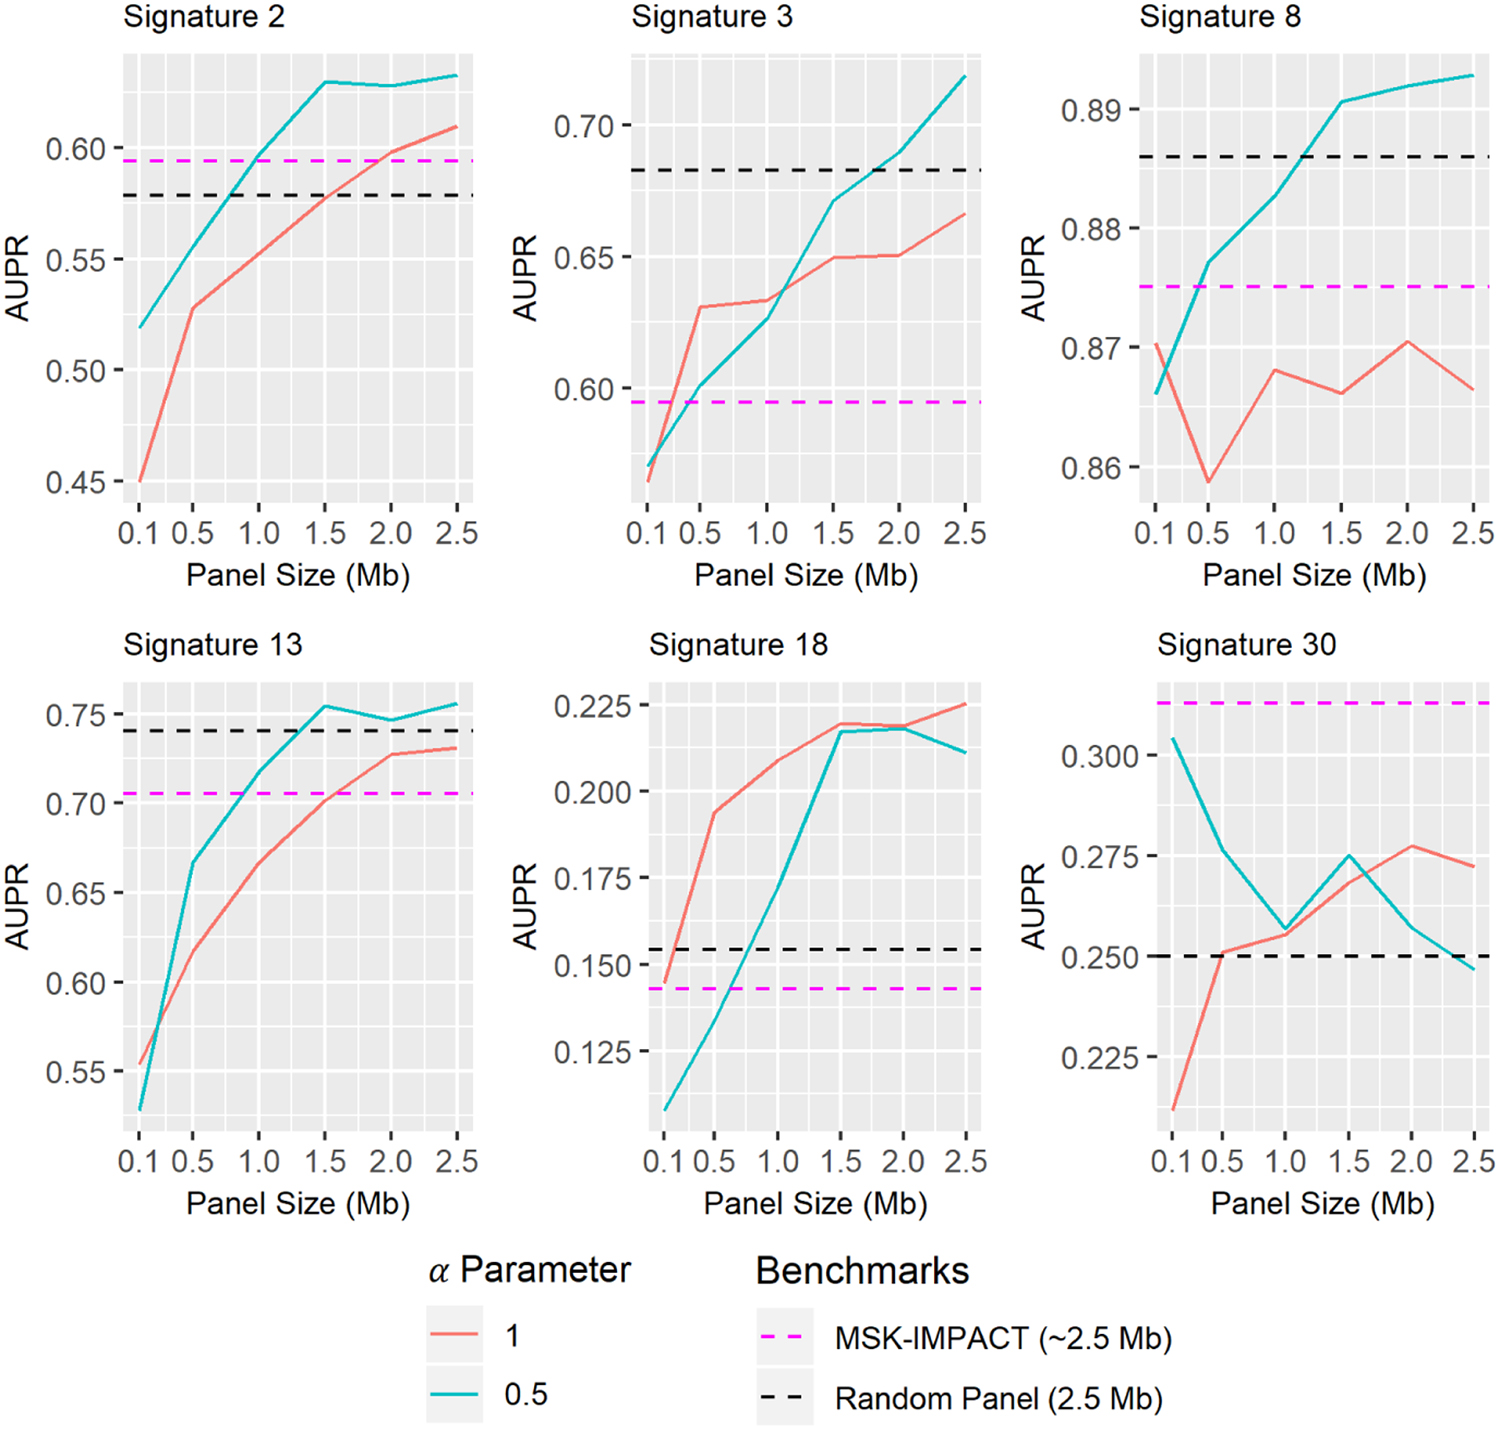
Assessment of genomic panels constructed with our framework for their ability to predict mutational signature activity at various panel sizes. Values shown are mean AUPR across 15 randomized test and train sets. Each plot tests distinct panels optimized for the detection of a particular mutational signature using two different settings of the
Spearman Correlation Between Exposures Computed Only from Panel Regions and Exposures Computed from Whole Genome Mutation Counts
Values shown are mean Spearman correlation coefficients across 15 randomized test and train sets. ScalpelSig is run with
MSK-IMPACT, Memorial Sloan Kettering Integrated Mutation Profiling of Actionable Cancer Target.
Classifications based on signatures extracted from WES are consistently more accurate than the other measurements, but this is to be expected since the exome (∼30 Mb) covers over ten times as much genetic material as the panels (
Comparison of ScalpelSig (
The right-most column gives the percentage of the performance gap between WES and the random panel that is bridged by our method.
AUPR, area under the precision-recall curve.
By this metric,
As an aside, it is worth noting that the MSK-IMPACT panel performs worse than the random baseline on all examined signatures except Signatures 2 and 30. The MSK-IMPACT panel was designed for the detection of common driver mutations, so it follows reasonably that the mutations it captures have a different distribution than the distribution of mutations over the whole genome (and consequently, the signatures obtained from its captured mutations may be inconsistent with genome-wide signatures). We additionally note that the random panel benchmark is in actuality given by the mean performance of 1000 panels with randomly selected windows (see Section 3)—thus while it is a useful point of comparison, it does not represent a clinically actionable assay, as the performance of any individual random panel is highly variable.
Finally, to assess the generalizability of the panels designed by
Evaluation of ScalpelSig (
Each row reports the results of a single ScalpelSig panel, trained on all 560 samples from the previous dataset. Spearman correlations with p-value ≥0.05 are not shown. The highest values in each row for each of the two evaluation metrics (Spearman and AUPR) are bolded.
4.2. Robustness of performance
In this section, we present several experiments demonstrating that the
4.2.1. Performance at smaller panel sizes
We investigated how performance of designed panels changed at different panel sizes, moving beyond our initial focus on the 2.5 Mb panel size used by MSK-IMPACT. One would naturally expect that the more genomic material is sampled, the better performance should become, since the number of observed mutations approaches the whole genome mutation count as the panel gets larger. This sensible intuition holds in most cases, but there are a few exceptions worth discussing. First, we note that panel performance is not a monotonically increasing function of panel size (Fig. 2). This phenomenon is unintuitive, but in fact observing additional genome regions is not guaranteed to increase accuracy and may even decrease it. To see this, it is important to understand that individual genome windows may have mutation distributions which differ starkly from the genome-wide distribution, due to variation in nucleotide composition and other factors. Adding such windows to a panel could produce a mutation distribution that misrepresents the genome-wide distribution, despite containing a greater number of mutations. This misleading distribution would result in a false impression of signature activity. Thus it is reasonably possible for performance to decline with the addition of certain windows.
We further observe that panels constructed with
4.2.2. Performance with limited training data
To investigate the amount of data required to effectively train
Spearman Correlation Between Exposures Computed Using Panel Regions and Exposures Computed from Whole Genome Mutation Counts, As Well As AUPR for Signature Activity Prediction, for Panels Constructed by ScalpelSig Using Various Amounts of Training Data
For each row, 15 randomized training sets were obtained using stratified sampling as detailed in the Section 3. The size of the training sets for each row is indicated in the Training Data column. The ScalpelSig algorithm was run separately on each of the training sets and evaluated using all of the held-out samples. Values shown are mean Spearman correlation coefficients and mean AUPR across the randomized trials. Spearman values where fewer than half of the trials yielded p-value <0.05 are marked with an asterisk.
4.2.3. Performance across varied activity thresholds
A critical component of the
We tested multiple values for the activity threshold (1%, 5%, 10%, 20%) and show these results in Table 6. We found that
Spearman Correlation Between Exposures Computed Using Panel Regions and Exposures Computed from Whole Genome Mutation Counts, for Panels Constructed Using Various Thresholds for Activity Classification
The Activity Threshold column gives the required percentage of mutations contributed by a signature for a sample to be considered “active.” That is, in the first row samples were classified as “active” if at least 1% of their mutations were contributed by Signature 2; in the second row samples were considered “active” if at least 5% (the default for this study) came from Signature 2, etc. For the ScalpelSig columns, and the MSK-IMPACT column, values shown are mean Spearman correlation coefficients across 15 randomized test and train sets. Different random test/train splits were sampled for each row. Cases where either the active or inactive class comprised fewer than 5% of the samples were discarded, since these cases reduce the possible variation in the test set. Spearman values where fewer than half of the trials yielded p-value <0.05 are marked with an asterisk.
4.3. Preliminary result for a combined-signature panel
In the present study we break down the problem of mutational signature detection from small amounts of genomic material by designing a distinct panel for each individual signature of interest. However, it would be ideal to detect the activity of multiple signatures simultaneously from the same genomic regions. We performed an exploratory set of experiments to determine whether regions from individual-signature
Preliminary Results from Assessing Genomic Panels Designed to Detect Multiple Signatures Simultaneously
The panels were constructed by combining windows from ScalpelSig (
5. DISCUSSION
While a growing body of literature attests to the efficacy of mutational signature activity as a predictive biomarker for targeted cancer therapies, the sequencing demands of almost all methods for MSA are not met by current clinical infrastructure. In this study we seek to address this problem with
In the present study, we train
Of the signatures investigated in this article, Signature 3 is arguably the most exciting as a clinically actionable biomarker. Signature 3 has been found to be correlated with biomarkers of homologous recombination repair deficiency (Nik-Zainal et al., 2016; Davies et al., 2017; Polak et al., 2017; Gulhan et al., 2019), which is a biomarker for PARP inhibitor therapy (Farmer et al., 2005). Recently, Gulhan et al. (2019) developed an algorithm for improved detection of Signature 3 from MSK-IMPACT panel data. Our results demonstrate that
For other future work, we plan to investigate other methods for inferring signature exposures and active signatures, including Huang et al. (2018)'s method for automatically detecting which signatures are active in each sample with confidence. While we show that
Footnotes
ACKNOWLEDGMENT
The authors thank Marina Knittel for her helpful suggestions during the design of the window scoring function.
AUTHOR DISCLOSURE STATEMENT
The authors declare they have no conflicting financial interests.
FUNDING INFORMATION
This research was supported by a grant from the United States—Israel Binational Science Foundation (BSF), Jerusalem, Israel. This project has been made possible, in part, by National Science Foundation Graduate Research Fellowship Grants No. DGE-1842165 to N.F. and DGE-1840340 J.F. This work was also funded, in part, by NSF award DGE-1632976 to J.F. This work was supported, in part, by the Intramural Research Program of the National Cancer Institute, Center for Cancer Research, NIH.