




Abstract
The comparison of DNA sequences is of great significance in genomics analysis. Although the traditional multiple sequence alignment (MSA) method is popularly used for evolutionary analysis, optimally aligning k sequences becomes computationally intractable when k increases due to the intrinsic computational complexity of MSA. Despite numerous k-mer alignment-free methods being proposed, the existing k-mer alignment-free methods may not truly capture the contextual structures of the sequences. In this study, we present a novel k-mer contextual alignment-free method (called kmer2vec), in which the sequence k-mers are semantically embedded to word2vec vectors, an essential technique in natural language processing. Consequently, the method converts each DNA/RNA sequence into a point in the word2vec high-dimensional space and compares DNA sequences in the space. Because the word2vec vectors are trained from the contextual relationship of k-mers in the genomes, the method may extract valuable structural information from the sequences and reflect the relationship among them properly. The proposed method is optimized on the parameters from word2vec training and verified in the phylogenetic analysis of large whole genomes, including coronavirus and bacterial genomes. The results demonstrate the effectiveness of the method on phylogenetic tree construction and species clustering. The method running speed is much faster than that of the MSA method, especially the phylogenetic relationships constructed by the kmer2vec method are more accurate than the conventional k-mer alignment-free method. Therefore, this approach can provide new perspectives for phylogeny and evolution and make it possible to analyze large genomes. In addition, we discuss special parameterization in the k-mer word2vec embedding construction. An effective tool for rapid SARS-CoV-2 typing can also be derived when combining kmer2vec with clustering methods.
1. Introduction
DNA sequence comparison is fundamental in bioinformatics, for example, phylogenetic analysis, species clustering, and homologous gene searching. DNA sequence comparison can be performed by alignment methods and alignment-free methods. Generally, multiple sequence alignment (MSA) method is accurate in sequence comparison, such as Clustal W (Thompson et al., 1994), multiple sequence alignment based on fast Fourier transform (MAFFT) (Katoh et al., 2002), and multiple sequence comparison by log-expectation (MUSCLE) (Edgar, 2004). However, MSA has a computational challenge when analyzing large and long sequence datasets. In recent years, alignment-free methods have developed rapidly, such as Feature Frequency Profile (k-mer) method (Sims et al., 2009), the k-mismatch average common substring (kmacs) method (Leimeister and Morgenstern, 2014), and Natural Vector method (Deng et al., 2011). The alignment-free methods transform biological sequences into numerical representations and then analyze them quantitatively; therefore, alignment-free methods can greatly improve the speed of sequence comparison and especially interpret sequence information.
The k-mer method is one of the best developed among alignment-free methods and it is used and improved by Blaisdell (1986), Wu et al. (1997), and Kantorovitz et al. (2007) among others. It has a large number of advantages and is widely used in genomics analysis. However, there are also some uncertainties in the traditional k-mer method. For example, the traditional k-mer method only counts the number and frequency of different k-mers and loses k-mer context relationship in a sequence.
Biological sequences can be regarded as an article and each k-mer is equivalent to a word in the article. Therefore, natural language processing (NLP) techniques can be used for processing biological sequences. In NLP, word2vec is the state-of-the-art method to embed a word into a numerical vector (Mikolov et al., 2013a,b). Word2vec gives specific vector representations to different words according to context information in a text corpus. Importantly, similar words with semantics have similar vector representations in word2vec embedding. Using the word2vec method for training, we can get the vector representations of different k-mers, and then we can study the relationship among biological sequences.
Word2vec method has been used to study protein sequences and has achieved good results in protein classification and disordered protein research (Asgari and Mofrad, 2015). In addition, it has also been used to analyze DNA sequences as dna2vec, which focuses on the relationship between summing of dna2vec vectors and nucleotides concatenation (Ng, 2017).
In this study, we propose a new alignment-free method based on word2vec embedding of k-mers in DNA sequences, focusing on phylogenetic analysis and species clustering, different from the application of dna2vec. The method is named as kmer2vec. The kmer2vec can truly reflect the original information and capture the k-mer contexts in the sequences. We also seek out appropriate parameters or strategies of the overall method construction process through control experiments. The test results show that kmer2vec performs well on coronavirus phylogeny, influenza virus clustering, and bacterial genomes clustering.
In addition, when combining kmer2vec with k-means methods, an effective tool for coronavirus typing can be derived, which also has an important role in the resolution of the coronavirus problem in today's world. Therefore, this method can provide new insights for the study of phylogeny and evolution, and make the comparison between large genomes possible. In addition, some interesting phenomena are also found in the process of constructing the method, which can be explained by biological theories.
2. Methods
A genome and DNA sequence can be considered as text documents, and the k-mers of a DNA sequence are words. Accordingly, we may use word embedding in NLP to numerically represent the k-mers in the DNA sequence. The k-mer embedding method of a DNA sequence is at the k-mer layer and sequence layer. Section 2 describes the transforming sequences in the two embedding layers.
2.1. word2vec word embedding
The word2vec method, proposed by Google (Mikolov et al., 2013a,b), embeds words into meaningful high-dimensional numerical vectors. The basic principle of the word2vec embedding is that words with similar contexts have similar semantics. Through the shallow neural network training on large text data, the word2vec method generates word embedding vectors in the hidden layer of the neural network. The architecture of the neural network includes the continuous bag-of-word (CBOW) model or the skip-gram model. In the training process, CBOW mainly predicts the word from the context words, while skip-gram mainly predicts the context words through a certain word. In the training process, the vector representation of each word is affected by its context vocabulary. If the context vocabulary of the two words is similar, the word vectors of the two words will also be similar. In this study, we use the open-source Gensim library (Řehůřek and Sojka, 2010) for training word2vec.
2.2. DNA sequence comparison using the k-mer word2vec vectors
We propose the following overall construction process of the genome comparison method, named kmer2vec method (Fig. 1).

The overall construction process of the kmer2vec method.
(1) Divide the training DNA sequences into a series of k-mers words. (2) Use the word2vec method to train the k-mer word2vec vectors. (3) Divide the sequences under study into a series of k-mer words, note that if a k-mer of the DNA sequences under study does not appear in the training dataset, its vector contains all zeros. (4) Take the average and variance of all the k-mer word vectors of each sequence to form the sequence vector. (5) Calculate the pairwise distance of the corresponding sequence vectors to quantify the difference among the sequences.
2.3. Optimization of method parameters and strategies
The optimal results of the kmer2vec method depend heavily on parameters or strategies of constructing the method. The parameters and strategies in the kmer2vec method are studied and selected as a stable procedure as follows.
Training dataset: Both the size and the species source of the training dataset may affect the final comparison result. When comparing DNA sequences, the candidate sequences shall be included in the word2vec training.
k-mer: Different k values are likely to lead to different results. According to result of the method optimization, the optimal k value is 4.
Division method of overlapping/nonoverlapping: When dividing sequences into k-mers, either overlapping or nonoverlapping can be selected. Given a DNA sequence, for example, AGGTAACAA (n = 9, length), using overlapping division, it can be decomposed into (n − k + 1) k-mers (k = 3), AGG GGT GTA TAA AAC ACA CAA. After a k-mer is taken, the starting position changes from i to i + 1 (i is the present position), and then the next k-mer will be taken. If the nonoverlapping method is used, the sequence is divided into AGG TAA CAA, a total of [n/k] k-mers, where “[]” means rounding to an integer. After a k-mer is taken, the starting position changes from i to i + k and then we can take another k-mer. If k = 4, the sequence is then divided into two 4-mers: AGGT AACA. Note that if the number of the last remaining bases is less than k, the incomplete k-mer is excluded.
Parameters of word2vec model training: The following parameters are changed to adapt to our research. The first parameter (min count) is the minimum number of occurrences of a word. If a word appears few times, it may be misspelled, and it could be ignored in training. However, k-mers do not have spelling mistakes, and the smaller the “min count” is, the more likely it is that the training dataset contains all the k-mers from the nucleic acid sequences to be studied. Therefore, here, we set the “min count” to 1, although its default value is 5. The second parameter is “sg”: Its default value is 0, which means the CBOW algorithm is used.
From the research of Mikolov et al. (2013a), when using the skip-gram algorithm, the training speed is relatively slow, but the accuracy of the trained word vectors is relatively high. According to our datasets, we choose the skip-gram algorithm here, that is, let “sg” = 1. In particular, according to previous studies, the parameter “vector size” in general datasets has little effect on the accuracy of word vectors. After a simple attempt, it is found that the training results of 100-, 200-, and 300-dimensional vectors have no significant difference.
From our result analysis, a 100-dimensional vector is sufficient for training, so we choose the default 100-dimensional vectors. In addition, it should be noted that there is a very important parameter in the selection of training parameters that may have a great impact on the results, that is, the “window size,” which indicates how to use the information of the text context. We mainly focus on the “window size” in the training parameters of the word2vec model.
Numerical representation of a DNA sequence by its kmer2vec vectors: After obtaining the k-mer word vectors of a sequence, to further represent the sentence with these k-mer vectors, we directly take the average of each vector to construct a 100-dimensional vector, or combine the average and the variance of k-mer vectors as a 200-dimensional vector. If a DNA sequence can be divided into n k-mers of

Let vv = (

Therefore, when choosing the average of vectors to construct a 100-dimensional vector, the sequence vector is
Distance metrics: To compare DNA sequences, we measure the distance between the corresponding vectors to indicate the difference between the sequences. We mainly investigate the pros and cons between commonly used distance metrics: the cosine distance and the Euclidean distance in comparing the sequence vectors.
The reasons why we choose the two distance metrics are as follows. First, the reason for choosing Euclidean distance is that it is the most intuitive and widely used distance formula for the calculation. Its effectiveness has been demonstrated in a lot of important application areas, for example, clustering problems (Madhulatha, 2012). In addition, Euclidean distance is thought as the primary metric in many specific methods such as K-means algorithm (Hartigan and Wong, 1979), Natural Vector method (Deng et al., 2011), and so on. As a result, in our method, we take Euclidean distance into consideration. Second, the reason for choosing cosine distance is related to word2vec. In the word2vec model, the similarity between word vectors is often measured by cosine similarity such as the Gensim library (Řehůřek and Sojka, 2010). Correspondence with, we also choose cosine distance as a possibly more appropriate distance formula.
For two vectors: v1 = (

where
The Euclidean distance between two vectors is defined in Equation (4).

2.4. Data source
The genome datasets for method construction used in this study are dataset 1 (whole genomes of 16 coronaviruses for phylogenetic analysis, about 500 kb), dataset 2 (whole genomes of the 16 coronaviruses and some other coronaviruses in National Center for Biotechnology Information [NCBI], about 2.5 Mb), and dataset 3 (whole genomes of the 16 coronaviruses for phylogenetic analysis and the sequence of Streptococcus agalactiae strain NGBS128 chromosome, about 2.5 Mb).
The species clustering test datasets used in this study are bacterial genome dataset and influenza virus neuraminidase (NA) gene dataset.
The genome GenBank/GISAID access numbers of the datasets are provided in the Supplementary Materials.
What's more, to further demonstrate the universality of the method in a larger scale, we use 18,698 sequences of SARS-CoV-2, which contains 8456 early sequences, 9250 Delta mutants and 992 Omicron mutants.
2.5. IRB waiver statement
This study does not collect animal samples and patient information, and therefore the IRB approval is not required.
3. Results
To investigate the stability of the method and determine the optimal parameters or strategies in the method construction process, we use 16 coronavirus genomes in the test study. Because the phylogenetic tree of the 16 coronavirus genomes obtained by the MSA MUSCLE method conforms to biological properties, the phylogenetic trees constructed by kmer2vec under different parameters or strategies are compared with the MSA phylogenetic tree to determine the suitable parameter or strategy combination. The accuracy is measured by the Pearson correlation coefficient (PCC) (Lee Rodgers and Nicewander, 1988) of the two genetic distance matrices obtained by our kmer2vec method and the MSA MUSCLE method. The higher the PCC is, the more similar the two genetic distance matrices are.
Because the number of combinations of parameters or strategies is large, it is impractical to test all parameter combinations. In addition, the mutual influence among different parameters or strategies can be small, it is also unnecessary to conduct all the experiments. We mainly use the following ways to study according to the order of logic or importance, the influence of the parameters or strategies on the method effect is studied one by one. In the overall exploring process, we mainly adopt the method of control experiments. When studying a certain parameter or strategy, randomly determine several groups of other parameters or strategies, and then change the parameter or strategy to be studied to determine how to choose. After a certain parameter or strategy is determined, the determined parameter value or strategy selection is used when studying other parameters or strategies.
3.1. Process and results of exploring appropriate parameters or strategies
3.1.1. Verifying training stability
Because the initialization of the word vectors in each training is determined by random seeds in the word2vec model, we first verify the stability of each training with the same parameter combination. Five groups of combinations of parameters or strategies are randomly determined, followed by three training. Each training seeks a pairwise distance matrix of the word vectors of different k-mers. Then, we compared the PCC between the two and two of the three distance matrices to verify the stability of the word vectors formed by each training (Table 1). Three more pieces of training and subsequent calculations are then carried out to verify the stability of the tree results by inspecting the PCC between the genetic distance matrix obtained by our method and the genetic distance matrix obtained by MSA MUSCLE method (Table 2).
Pearson Correlation Coefficient Results of the First Three Pieces of Training
“Cases of parameter combination” show the combination of parameters or strategies in each group. “PCC of k-mer distance matrices (1–2)” means the results of PCC between k-mer distance matrices obtained by the first training and the second training. “PCC of k-mer distance matrices (1–3)” and “PCC of k-mer distance matrices (2–3)” are analogous to “PCC of k-mer distance matrices (1–2).”
PCC, Pearson correlation coefficient.
Pearson Correlation Coefficient Results of the Second Three Pieces of Training
“Cases of parameter combination” show the combination of parameters or strategies in each group. “PCC of genetic distance matrices (4)” means the results of PCC between genetic distance matrices obtained by kmer2vec and multiple sequence alignment MUSCLE method under the fourth training. “PCC of genetic distance matrices (5)” and “PCC of genetic distance matrices (6)” are analogous to “PCC of genetic distance matrices (4).” MUSCLE, multiple sequence comparison by log-expectation.
Under the five randomly selected parameter or strategy combinations, PCCs of k-mer distance matrices are all above 0.85, and most of them are above 0.95, which means that the word vectors obtained in each training are strongly correlated and very stable. Table 2 shows that for each combination of the test, the final accuracy difference of the three pieces of training is within 0.01. The final result of each training is very stable as well. In particular, from subsequent trials, we find that occasionally the difference of the results is greater than 0.01. However, it occurs very few times and the impact on the final tree or clustering results is negligible. So it does not influence the overall stability of training. In general, this experiment verifies the stability of each training under the same parameter or strategy combination and lays the foundation for the subsequent construction of this method.
3.1.2. Determining the window size
Since the word2vec model training is the core part of the method, we first determine the parameters of the word2vec model. To investigate the impact of window size on the method accuracy, we select six window sizes: 5, 6, 12, 18, 24, and 30. Among them, the default value is 5 and other window sizes are multiples of 3 to better explore its biology significance. We determine the optimal window size as follows: First, randomly determine five groups of combinations of parameters or strategies, and change the value of window size in each group to obtain the genetic distance matrices. After that, we can compare the PCCs between each genetic distance matrix obtained by our method and the matrix obtained by the MSA MUSCLE method (Fig. 2).
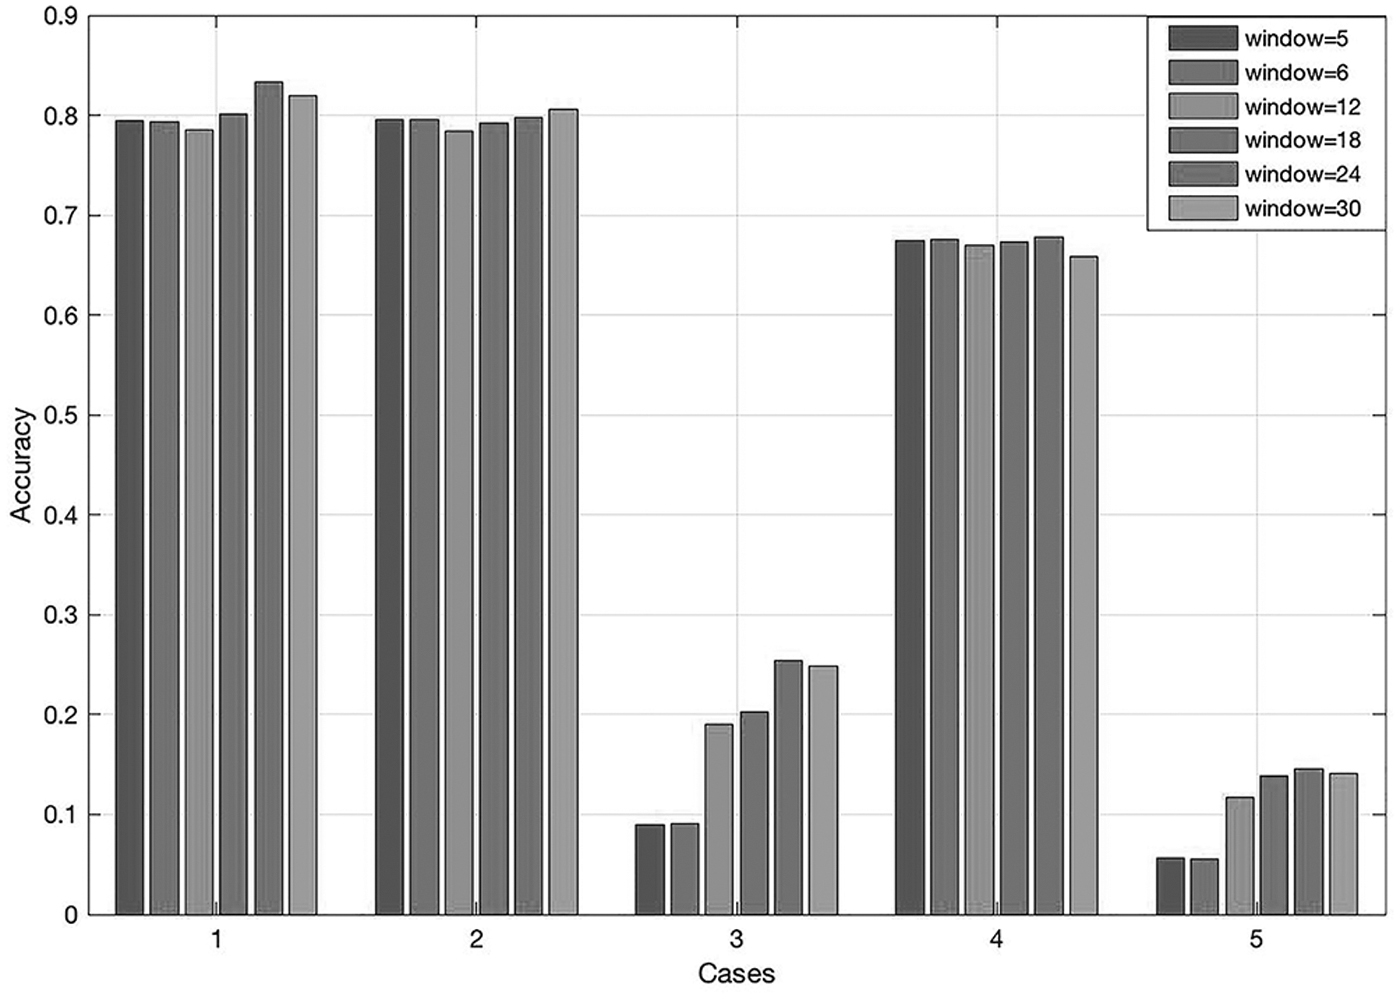
The accuracy of our methods with different window sizes in five groups. “Cases” show the combination of parameters or strategies except window size in each group. Specifically, case 1 is the combination of dataset 1, k = 5, overlapping, average+variance, and Euclidean distance. Case 2 is the combination of dataset 2, k = 4, overlapping, average, and Euclidean distance. Case 3 is the combination of dataset 1, k = 3, nonoverlapping, average, and cosine distance. Case 4 is the combination of dataset 3, k = 3, overlapping, average+variance, and cosine distance. Case 5 is the combination of dataset 2, k = 6, nonoverlapping, average, and Euclidean distance.
Moreover, Table 2 shows that although the results of each training under the same parameter or strategy combination are stable, there are still very small differences. Therefore, the PCCs obtained here are the median of three pieces of training. Moreover, PCCs obtained in our other trials below are all the median of three pieces of training and we will not repeat the instruction.
The results show that in most cases, when the value of window size is 24, the correlation coefficient reaches the highest value. Although the differences of each training, other parameters or strategies, and other factors may have an impact on it, in general, it is more appropriate to set the window size to 24.
3.1.3. Determining overlapping/nonoverlapping
The k-mer segmentation in DNA sequences has a significant impact on the accuracy of the method. After determining the parameters of the word2vec model, we explore the choice of two segmentation approaches, overlapping/nonoverlapping. We determine the optimal segmentation strategy as follows: First, randomly determine five groups of combinations of parameters or strategies, and then change the strategies of overlapping/nonoverlapping in each group to obtain the genetic distance matrices. After that, we get the PCCs between each genetic distance matrix obtained by our method and the matrix obtained by the MSA method MUSCLE. According to the test results, we can determine the choice of overlapping/nonoverlapping. The test results are shown in Table 3.
The Accuracy of Our Methods with Different Choices of Overlapping/Nonoverlapping in Five Groups
“Cases of parameter combination” show the combination of parameters or strategies except for overlapping/nonoverlapping in each group. “PCC of genetic distance matrices (overlapping)” means the results of PCCs when choosing overlapping. “PCC of genetic distance matrices (nonoverlapping)” means the results of PCCs when choosing nonoverlapping.
In all cases of the experiment, the accuracy of the method using overlapping is significantly higher than using nonoverlapping. It is likely because that when using overlapping, after taking the “average” or the “average+variance,” the different starting positions will not have significant impact on the accuracy. However, when using nonoverlapping, the different starting positions will have a negative influence on the accuracy just like the “frame-shift mutation” effect (Ripley, 1990) in biology significance, resulting in the accuracy that nonoverlapping is poor.
3.1.4. Choices of DNA sequence vector representation
We then explore the choice of DNA sequence vector representation, focusing on the pros and cons of the two options: “average” and “average+variance.” We determine the strategy by the following method: First, randomly determine five groups of combinations of parameters or strategies, and then change the strategies of “average” and “average+variance” in each group to obtain the genetic distance matrices. After that, we can get the PCCs between each genetic distance matrix obtained by our method and the matrix obtained by the MSA method MUSCLE. According to the test results, we can determine the choice of “average” and “average+variance.” The test results are shown in Table 4.
The Accuracy of kmer2vec with Different Choices of “Average”/“Average+Variance” in Five Groups
“Cases of parameter combination” show the combination of parameters or strategies except “average”/“average+variance” in each group. “PCC of genetic distance matrices (average)” means the results of PCCs when choosing “average.” “PCC of genetic distance matrices (average+variance)” means the results of PCCs when choosing “average+variance.”
The two strategies of “average” and “average+variance” have similar effects on the whole, but the effect of “average+variance” is slightly better than that of “average.” This may be because “average+variance” leverages more information in the genome and variance can amplify the differences of genomes, making the method more accurate and more stable. Therefore, we choose the “average+variance” strategy.
3.1.5. Determining the distance metric
Different distance formulas may lead to different results. After determining the choice of nucleic acid sequence vector representation, we then explore the choice of vector distance, focusing on the pros and cons of cosine distance and Euclidean distance. We determine the strategy by the following method: First, randomly determine five groups of combinations of parameters or strategies, and then change the distance formula in each group to obtain the genetic distance matrices. After that, we can get the PCCs between each genetic distance matrix obtained by our method and the matrix obtained by the MSA method MUSCLE. According to the test results, we can determine the choice of cosine distance and Euclidean distance. The results are in Table 5.
The Accuracy of kmer2vec with Different Choices of Cosine Distance and Euclidean Distance in Five Groups
“Cases of parameter combination” show the combination of parameters or strategies except for the distance formula in each group. “PCC of genetic distance matrices (Cosine)” means the results of PCCs when choosing cosine distance. “PCC of genetic distance matrices (Euclidean)” means the results of PCCs when choosing Euclidean distance.
Although cosine similarity is often used to express the similarity of word vectors, the experimental results show that the effect of using Euclidean distance is significantly better than using cosine distance. Considering the overall situation, the Euclidean distance is more appropriate. From our point of view, it may be because Euclidean distance measures both the dissimilarity of k-mers and also the frequency of k-mers (content), while cosine distance only compares the dissimilarity.
3.1.6. Determining the k value and exploring the impact of the training dataset on the results
Now, we determine the two parameters, the training dataset and the k value, on the impacts of the method accuracy. We conduct a comprehensive study of the two factors as follows: Other parameters or strategies are determined based on the previous research, and there are three choices of training dataset: dataset 1, dataset 2, and dataset 3. Therefore, we can determine three groups of combinations of parameters or strategies, and then change the k value in each group to obtain the genetic distance matrices. After that, we can get the PCCs between each genetic distance matrix obtained by our method and the matrix obtained by MUSCLE. According to the test results, we can determine the k value and consider the influence of the training dataset. The test results are shown in Figure 3.
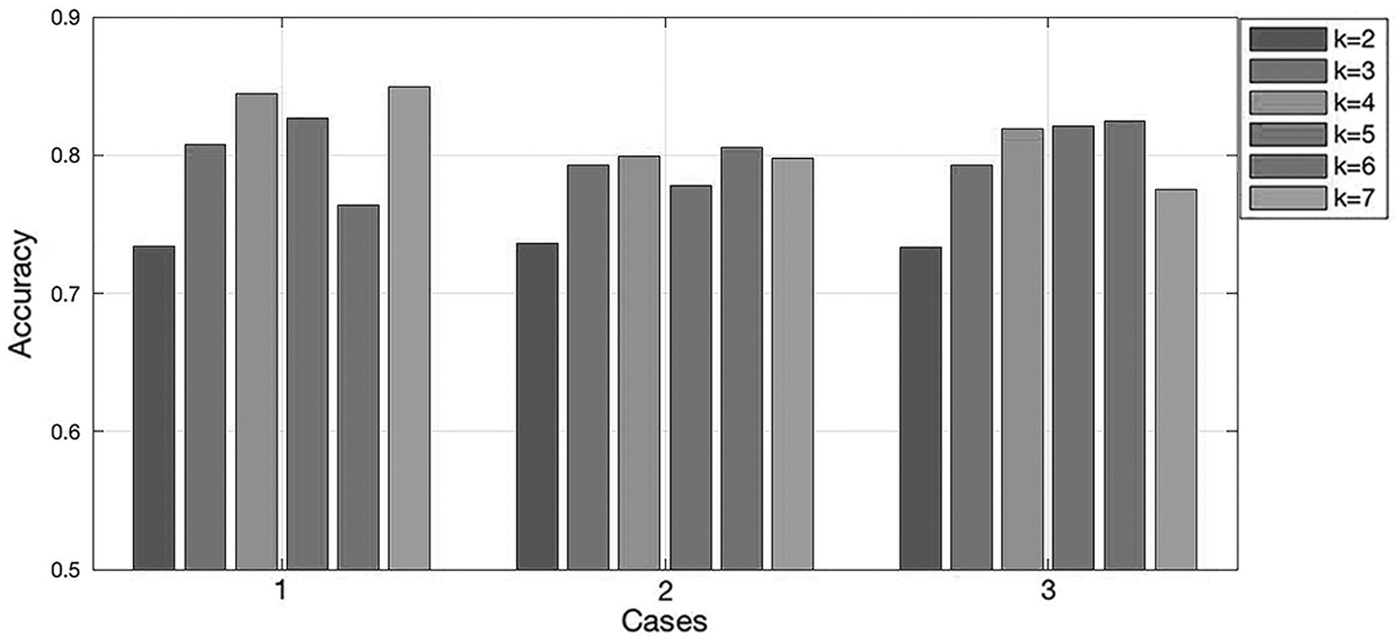
The accuracy of kmer2vec with different k values in three groups. “Cases” show the combination of parameters or strategies except for the k value in each group. Specifically, case 1 is the combination of dataset 1, overlapping, window = 24, average+variance, and Euclidean distance. Case 2 is the combination of dataset 2, overlapping, window = 24, average+variance, and Euclidean distance. Case 3 is the combination of dataset 3, overlapping, window = 24, average+variance, and Euclidean distance.
It can be seen from the results that in terms of the influence of the k value, the final results are relatively not accurate when k = 2 and k = 3. It is probably because there are few kinds of k-mers when k = 2 and k = 3, which have limitations when distinguishing different nucleic acid sequences. In general, the difference among k = 4–7 is not much. So when k value is higher than 4, increasing the k value will not make the accuracy improving significantly. Considering the results of the three groups, it is appropriate to choose 4 as the k value.
As for the training dataset, the species sources of dataset 1 and dataset 2 are very similar, but the sizes of the two datasets are quite different. Therefore, this experiment ignores the difference in the species source and compares the two to explore the influence of the size of the training dataset on the final result. In the case of dataset 1, the training has basically reached saturation, and then increasing the size of the dataset will not have a large gain on the training effect. When k = 4, k = 5, and k = 7, the effect of dataset 2 is slightly lower than that of dataset 1, which may be caused by the difference in species source that is originally tried to be ignored.
Dataset 2 and dataset 3 have similar sizes, but their species sources are different. The test results of the two are not much different, and the species source has little effect on the accuracy of the final result. This may be because the difference between the word vectors obtained by the two datasets is not large. Or it may be because the word vectors trained by the two are quite different, but due to the stability of the method, as long as the word vectors have a discriminatory power, the final effect can be guaranteed.
We explore the reason in the following way: In the cases of k = 2–7 (other parameters or strategies are determined by the previous experiments), the difference in the word vectors obtained from dataset 2 and dataset 3 is measured by comparing the PCCs between the two distance matrices of corresponding k-mers in each training. In addition, we also use k = 3 (other parameters or strategies are determined by the previous experiments) as an example. We use the T-distributed stochastic neighbor embedding (T-SNE) method (Van der Maaten and Hinton, 2008) to perform dimensionality reduction clustering on the word vectors trained from dataset 2 and dataset 3 to display the results intuitively. The test results are shown in Table 6 and the results of T-SNE are shown in Figure 4.
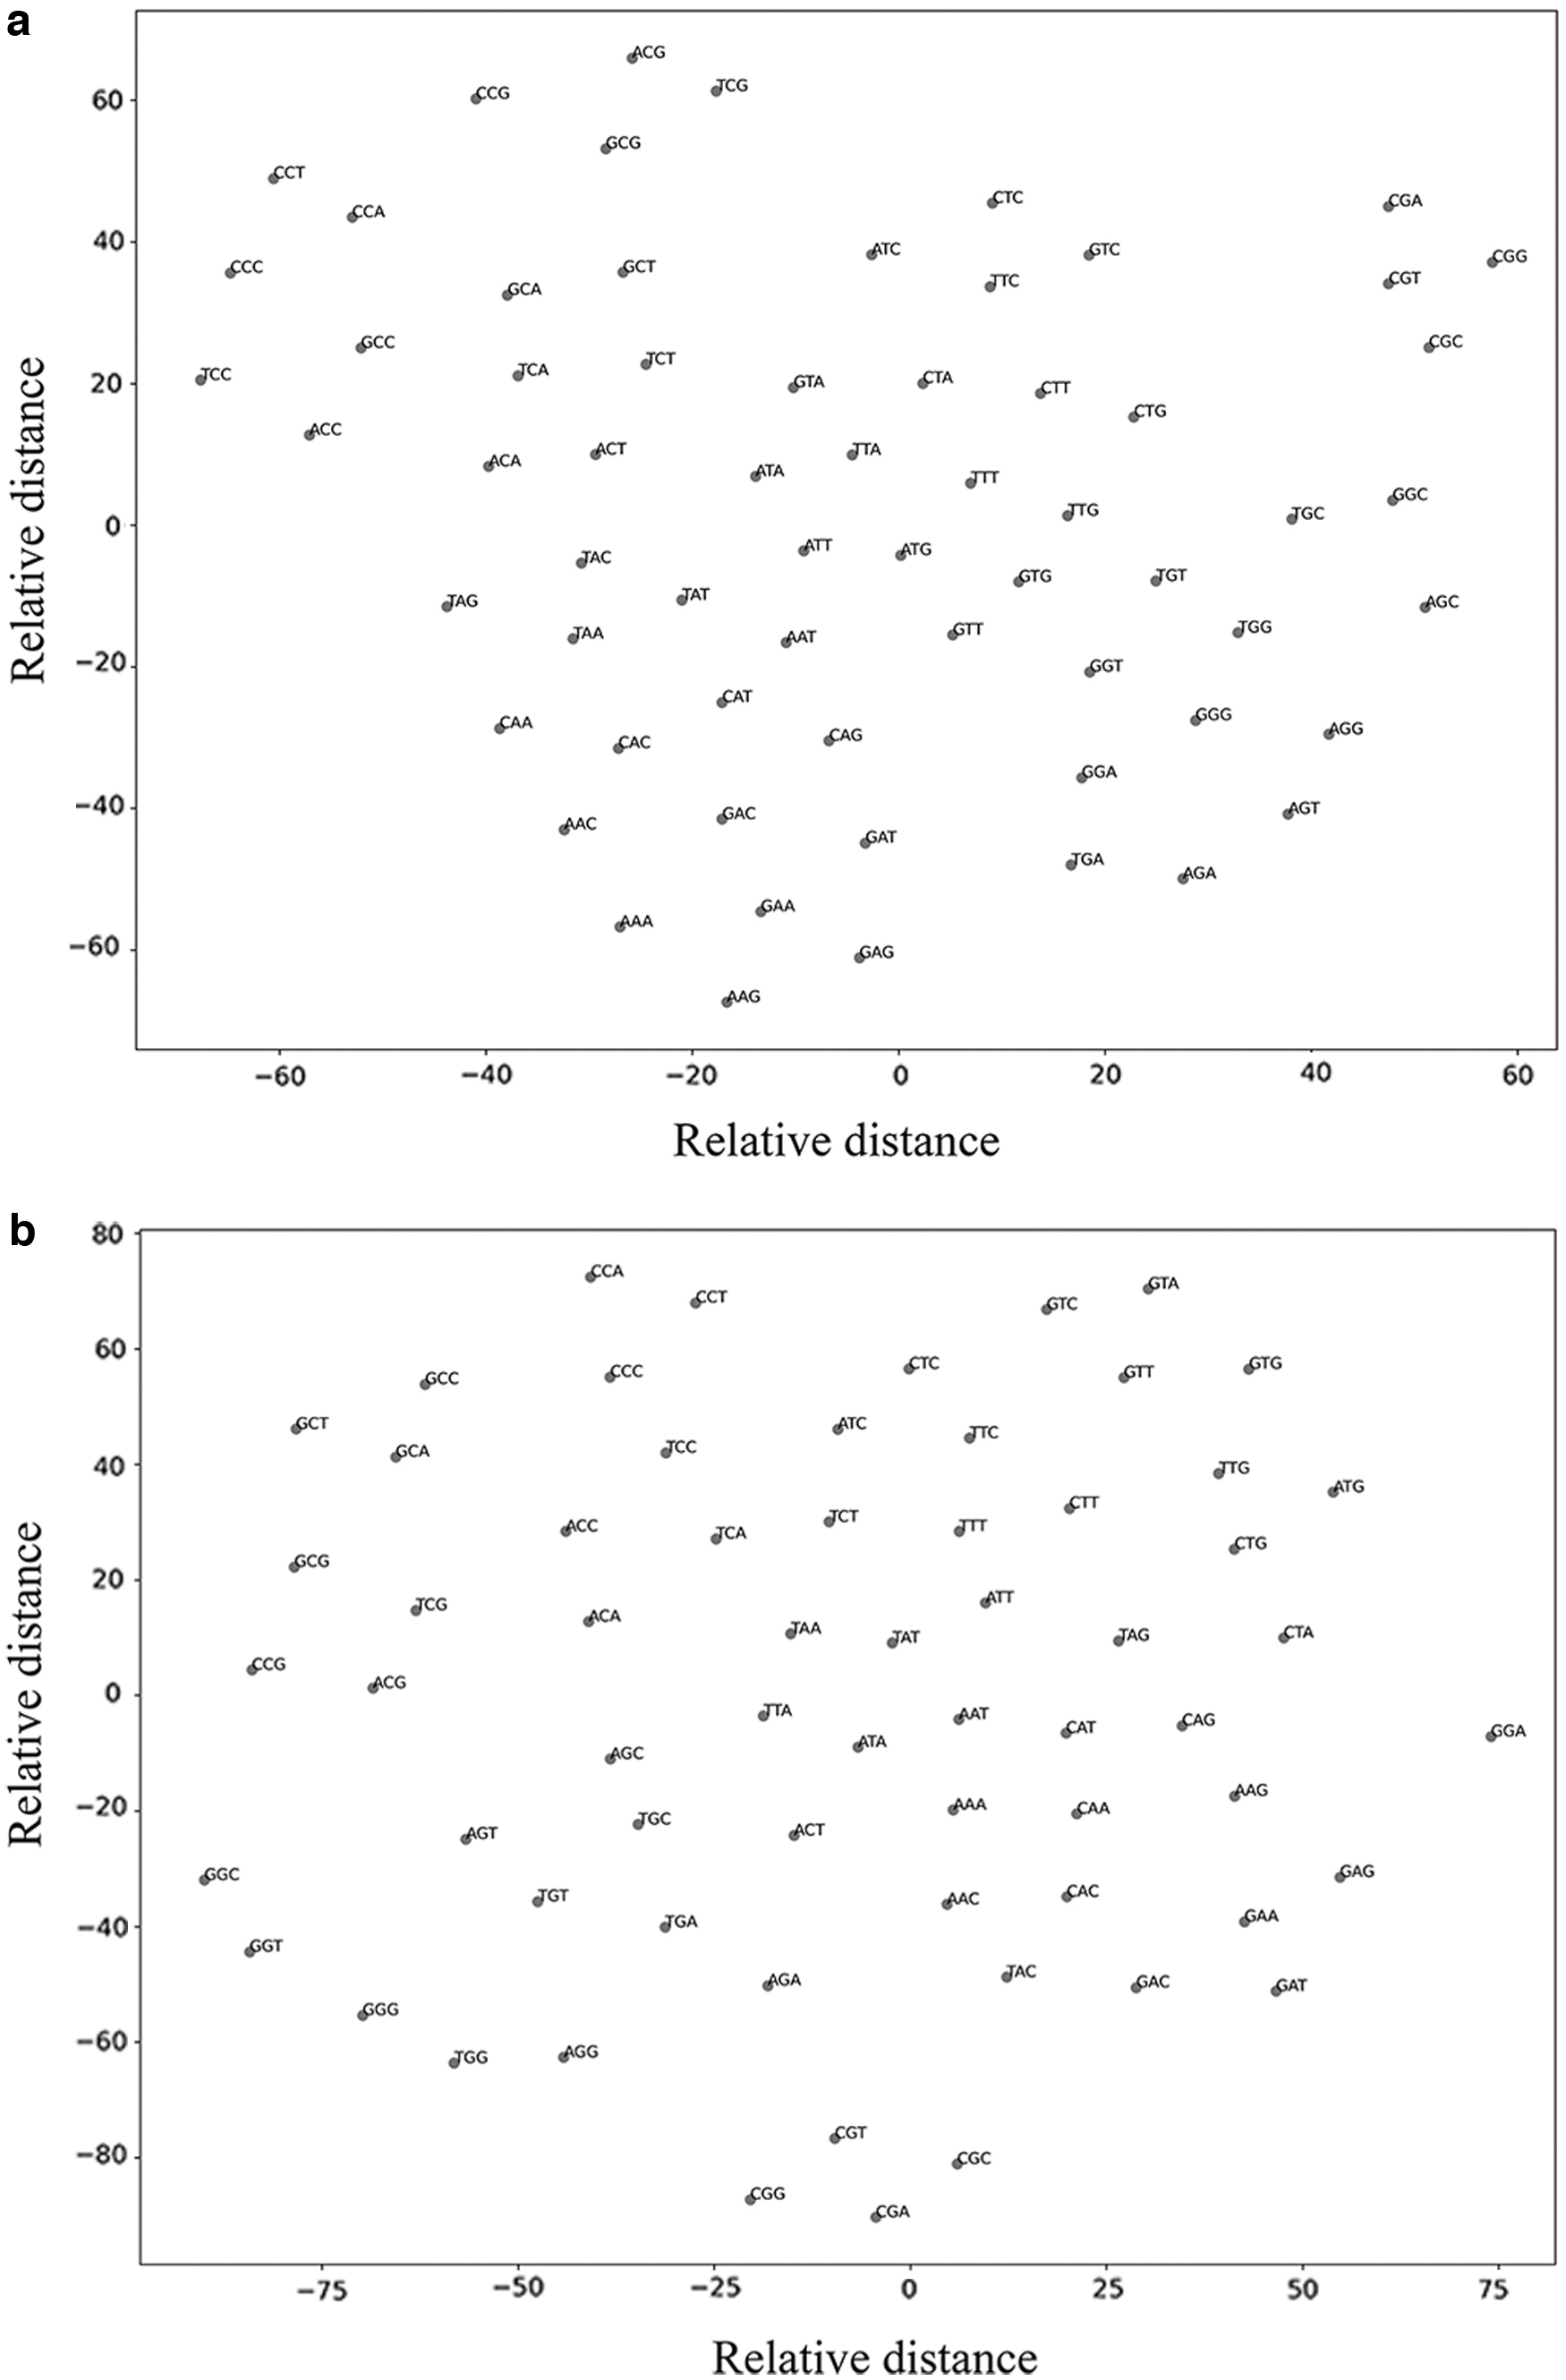
The T-SNE clustering results of k-mer vectors trained from dataset 2/dataset 3. The x-axis and the y-axis are actually convenient measures of relative distances between individual points to be displayed in the two-dimensional plane, having no specific meaning;
The Pearson Correlation Coefficients Between the Two Distance Matrices of Corresponding k-Mers in Training from Dataset 2 and Dataset 3
“Cases” show the combination of parameters or strategies in each group. “Test (dataset 2–dataset 3)” means the PCCs between the two distance matrices obtained from dataset 2 and dataset 3.
From the test results of Section 3.1.1, the correlation of the corresponding distance matrices trained from the same dataset in the overlapping case is above 0.95. When choosing different k values, the PCCs of the corresponding k-mer distance matrices trained from dataset 2 and dataset 3 are significantly lower than the results obtained from the same training datasets. This result indicates that the source of the species influences the trained word vectors. When k = 7, due to different training datasets, the types of 7-mers are not the same, so we do not calculate the PCCs between their corresponding distances. Although the source of the species influences the result of the word vectors trained, since the correlation is basically around 0.7–0.8 when k = 3–6, the distance between word vectors trained by different species has basic similarity.
In a word, there is both commonality and characteristics between the k-mer distances trained by different source species. Commonality may be the editing distances between word vectors because the editing distance can represent the evolutionary relationship between k-mers (evolutionary process includes point mutations, insertions, and deletions). This part of the information is common in the biological world, so the distance between word vectors has some basic similarities. The characteristics should be information specific to different species, which leads to a decrease in relevance. Simply, word vector distance can be understood as the difference between k-mers in the comprehensive lexical information, which includes both evolutionary information and biologically specific information.
Therefore, the distance matrices of the corresponding word vectors trained by different species correlate but the correlation cannot reach particularly high. For instance, we use k = 3 to make T-SNE dimensionality reduction clustering figures and they can also visually show the result above. The 3-mers trained by dataset 2 and dataset 3 are mainly clustered according to base differences, and generally the fewer base differences, the easier it is to get together. The two clustering figures are similar but clearly show some differences, which are derived from information specific to different species sources.
When k = 2, the correlation between the k-mer distances trained by different species is extremely low. This may be because there are few vocabulary types formed when k = 2, which leads to the impact of the training dataset on the word vector becoming large. However, although the correlation between the k-mer distances trained by different species is low when k = 2, the overall effect of nucleic acid sequence comparison is not much different. As long as the word vector has a degree of differentiation, the final effect can be guaranteed, which also verifies the stability of the method from another aspect.
3.2. Phylogenetic tree test
The above experiment shows that the optimal parameters in kmer2vec for accurately comparing DNA sequences are k-mer size k = 4, overlapping, window = 24, “average+variance,” and Euclidean distance. Moreover, the size and the species source of the training dataset will also have a minor impact on the results but can be mitigated by adding the DNA sequence under study into the training dataset. In the following test, we use the previously determined parameters or strategies to study the 16 nucleic acid sequences and obtain the distance matrix. Then we use the Unweighted Pair-group Method with Arithmetic Mean (UPGMA) (Sokal, 1958) method to build the phylogenetic tree. For comparison purposes, we also use the conventional k-mer method and the MSA method MUSCLE to obtain the distance matrices of the 16 nucleic acid sequences and then use the UPGMA method to build the trees.
The traditional k-mer method has been described in different forms (Sims et al., 2009; Yu et al., 2013). However, the key points are the same, that is, using the k-mer frequencies to indicate the sequences.
The details about the traditional k-mer method we used for comparison here are as follows. (1) Determining the k value and dividing the sequences: We should first determine the k value. For our datasets, after experiments, we find that k = 6 and k = 7 are all good choices. Then, we divide the sequences into a series of k-mers using the overlapping strategy. (2) Calculating the frequencies of different k-mers: For comparison, we determine the order of different k-mers according to their letters. Then, we calculate the frequencies of different k-mers and use them to form a vector of the sequence according to their orders. (3) Calculating the distance: We calculate the distances among different sequences through their vectors. The distance formula chosen here is the Jensen-Shannon Divergence (Sims et al., 2009), which is commonly used in the k-mer method.
Figure 5 is the results obtained by kmer2vec, traditional k-mer method (k = 6, which shows the best result among k = 2–7) and MUSCLE. We build the phylogenetic trees using Molecular Evolutionary Genetics Analysis X (Kumar et al., 2018).
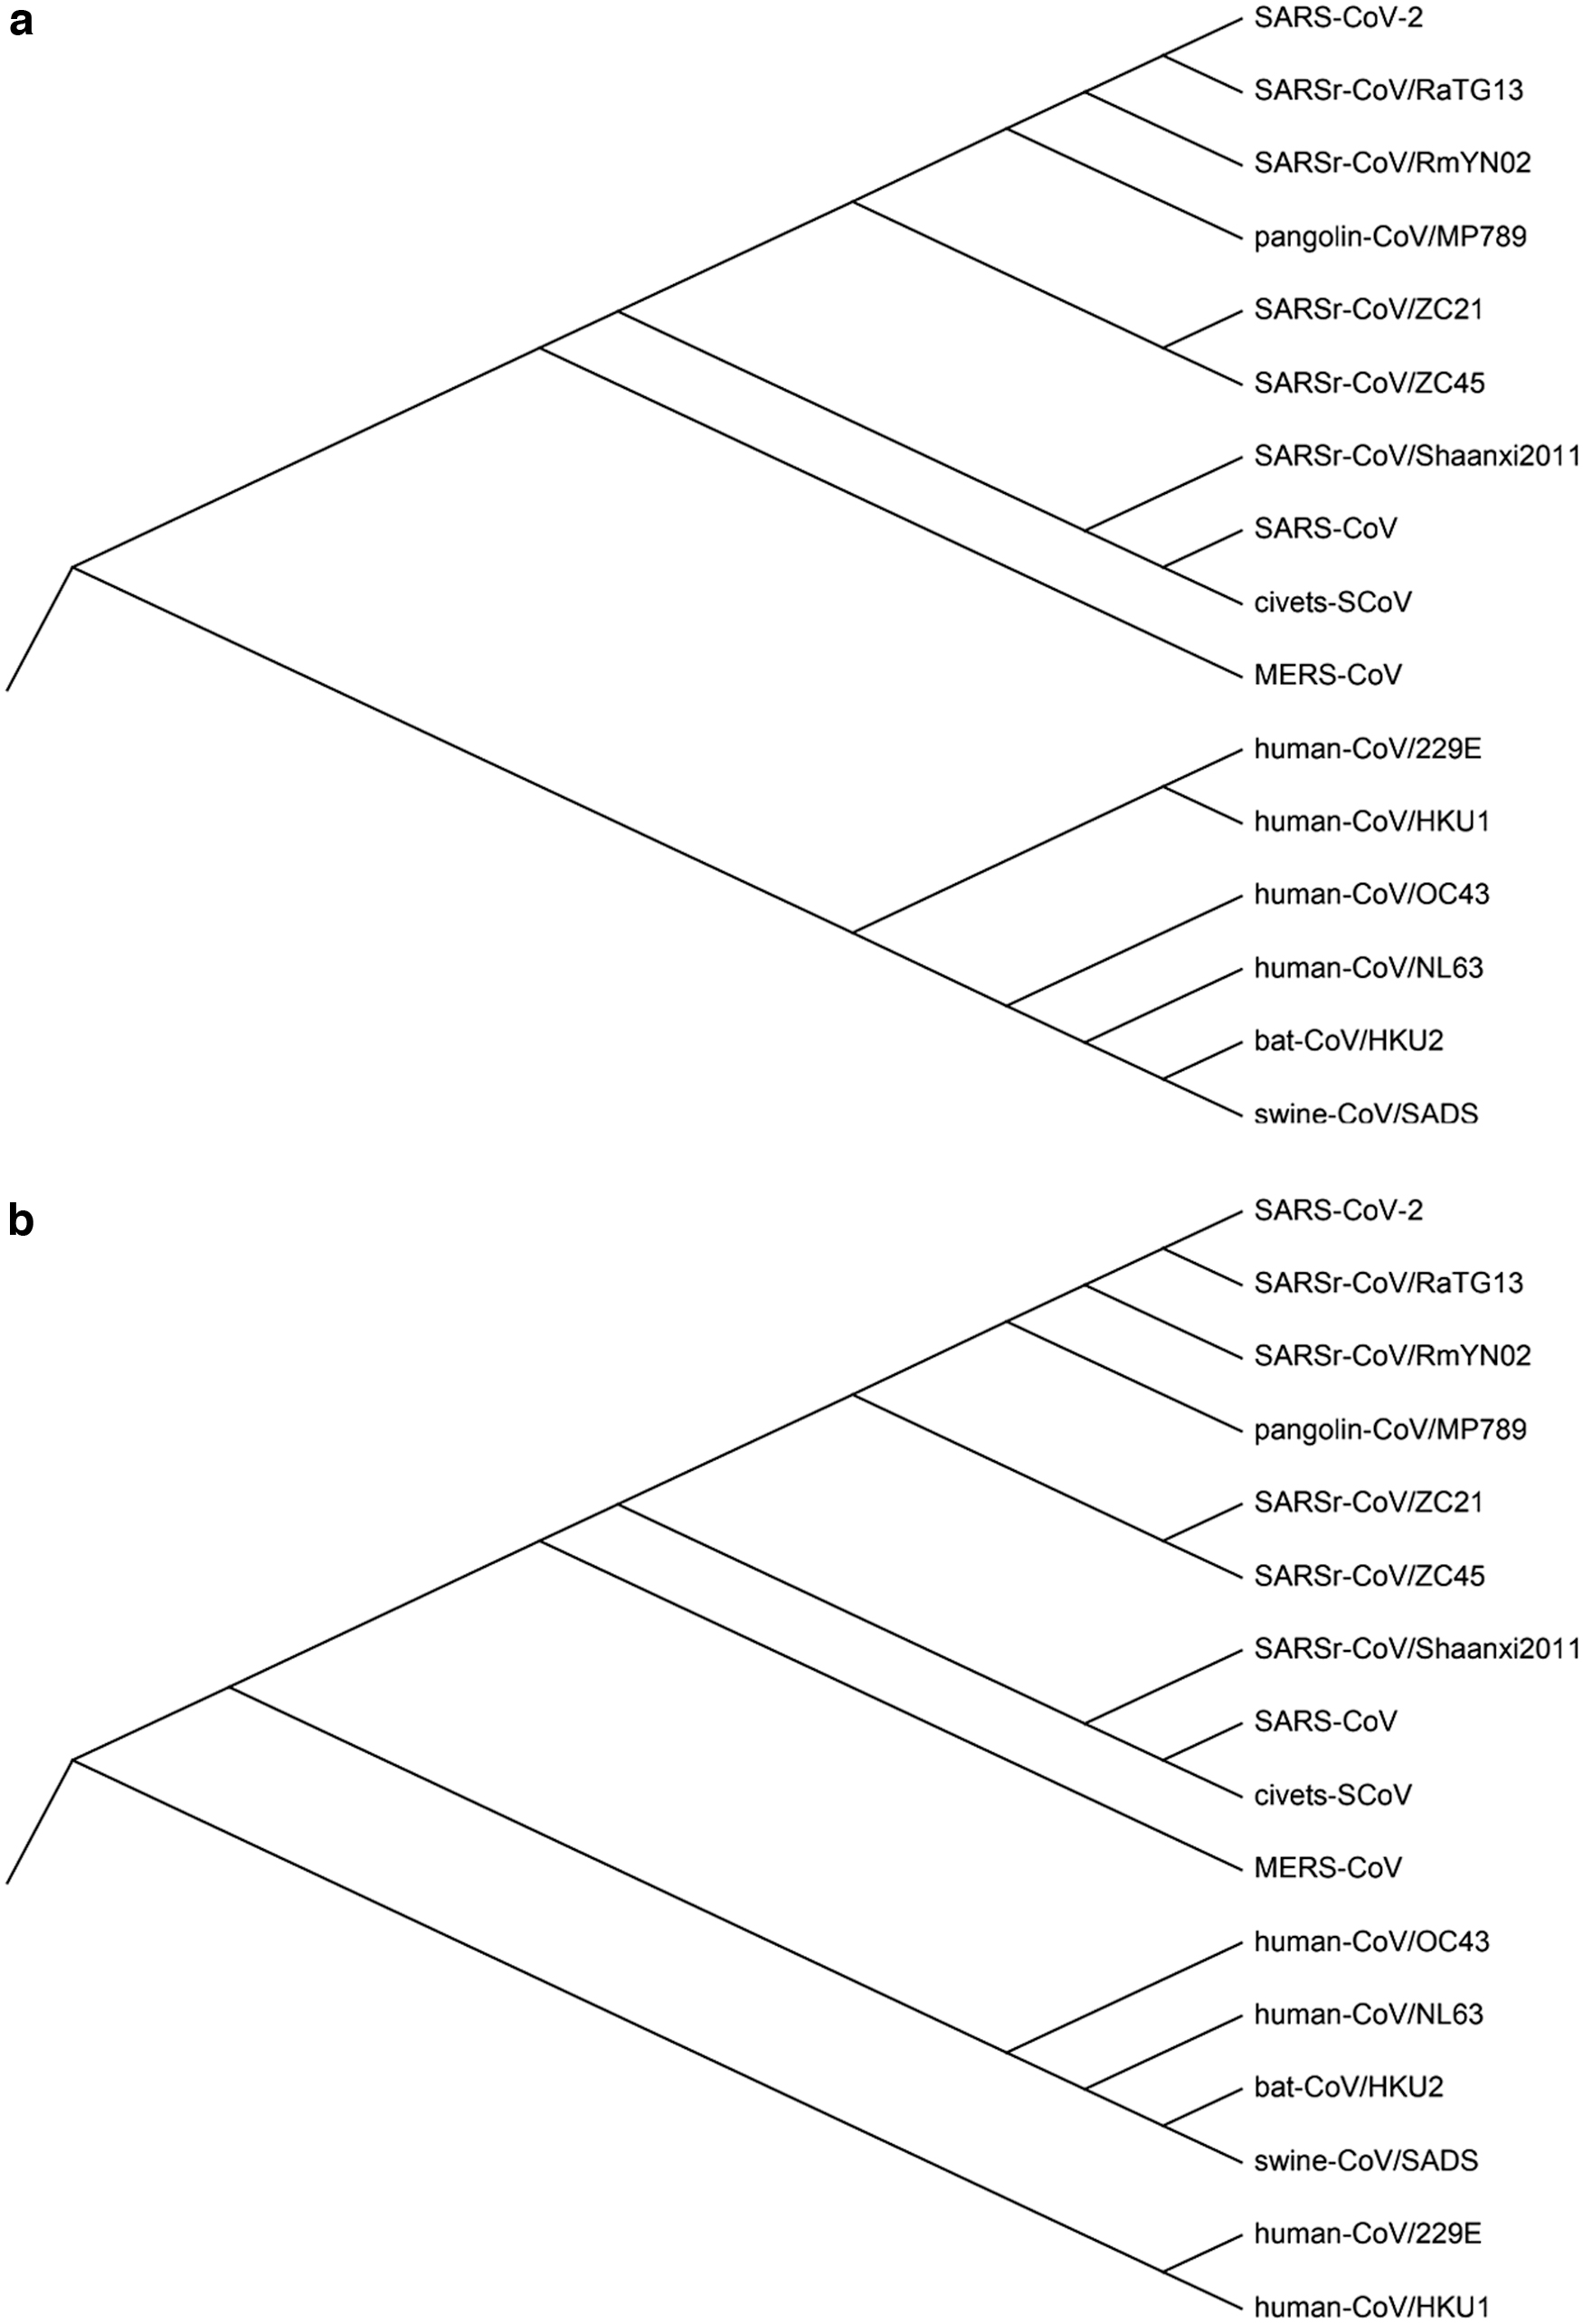
The phylogenetic trees of the 16 coronaviruses using
These results show that the proposed kmer2vec alignment-free method may achieve the same phylogenetic trees built by the MSA method. The evolutionary tree based on the kmer2vec method conforms to the biological properties of the coronaviruses, and its main issue is the classification of human-CoV/229E. Both human-CoV/229E and human-CoV/NL63 belong to the
In addition, such outliers also may be due to the similarity of the overall periodic structure of human-CoV/HKU1 and human-CoV/NL63, which leads to the incorrect separation of human-CoV/229E and human-CoV/NL63. But in any case, on the whole, the evolutionary tree that our approach has made is basically proper in biological significance. For instance, bat-CoV/HKU2 and swine-CoV/SADS are clustered together, which conforms to the biological properties well (Yu et al., 2020). In addition, Figure 5 demonstrates that kmer2vec is better than the traditional k-mer method as well, due to the fact that the human-CoVs are separated in the phylogenetic tree obtained by the traditional k-mer method. Therefore, the kmer2vec method based on word2vec can be used for DNA sequence comparison.
3.3. Clustering test
3.3.1. Clustering effect test of bacteria
To further verify the effectiveness of kmer2vec, we test the method for clustering whole bacterial genomes. For comparison, we cluster the bacterial genomes by the traditional k-mer method as well. As shown in Figure 6, the dots of the same color indicate that these bacteria belong to the same taxa. If the dots of the same color are all clustered together, it means that the clustering effect is good. It can be seen from Figure 6 that, overall, the clustering effect of kmer2vec is pretty good. However, the traditional k-mer method (k = 6, which shows the best result among k = 2–7) cannot distinguish Thermoplasma and Archaeoglobus, which both contain similar species living in high temperature and acid environments.
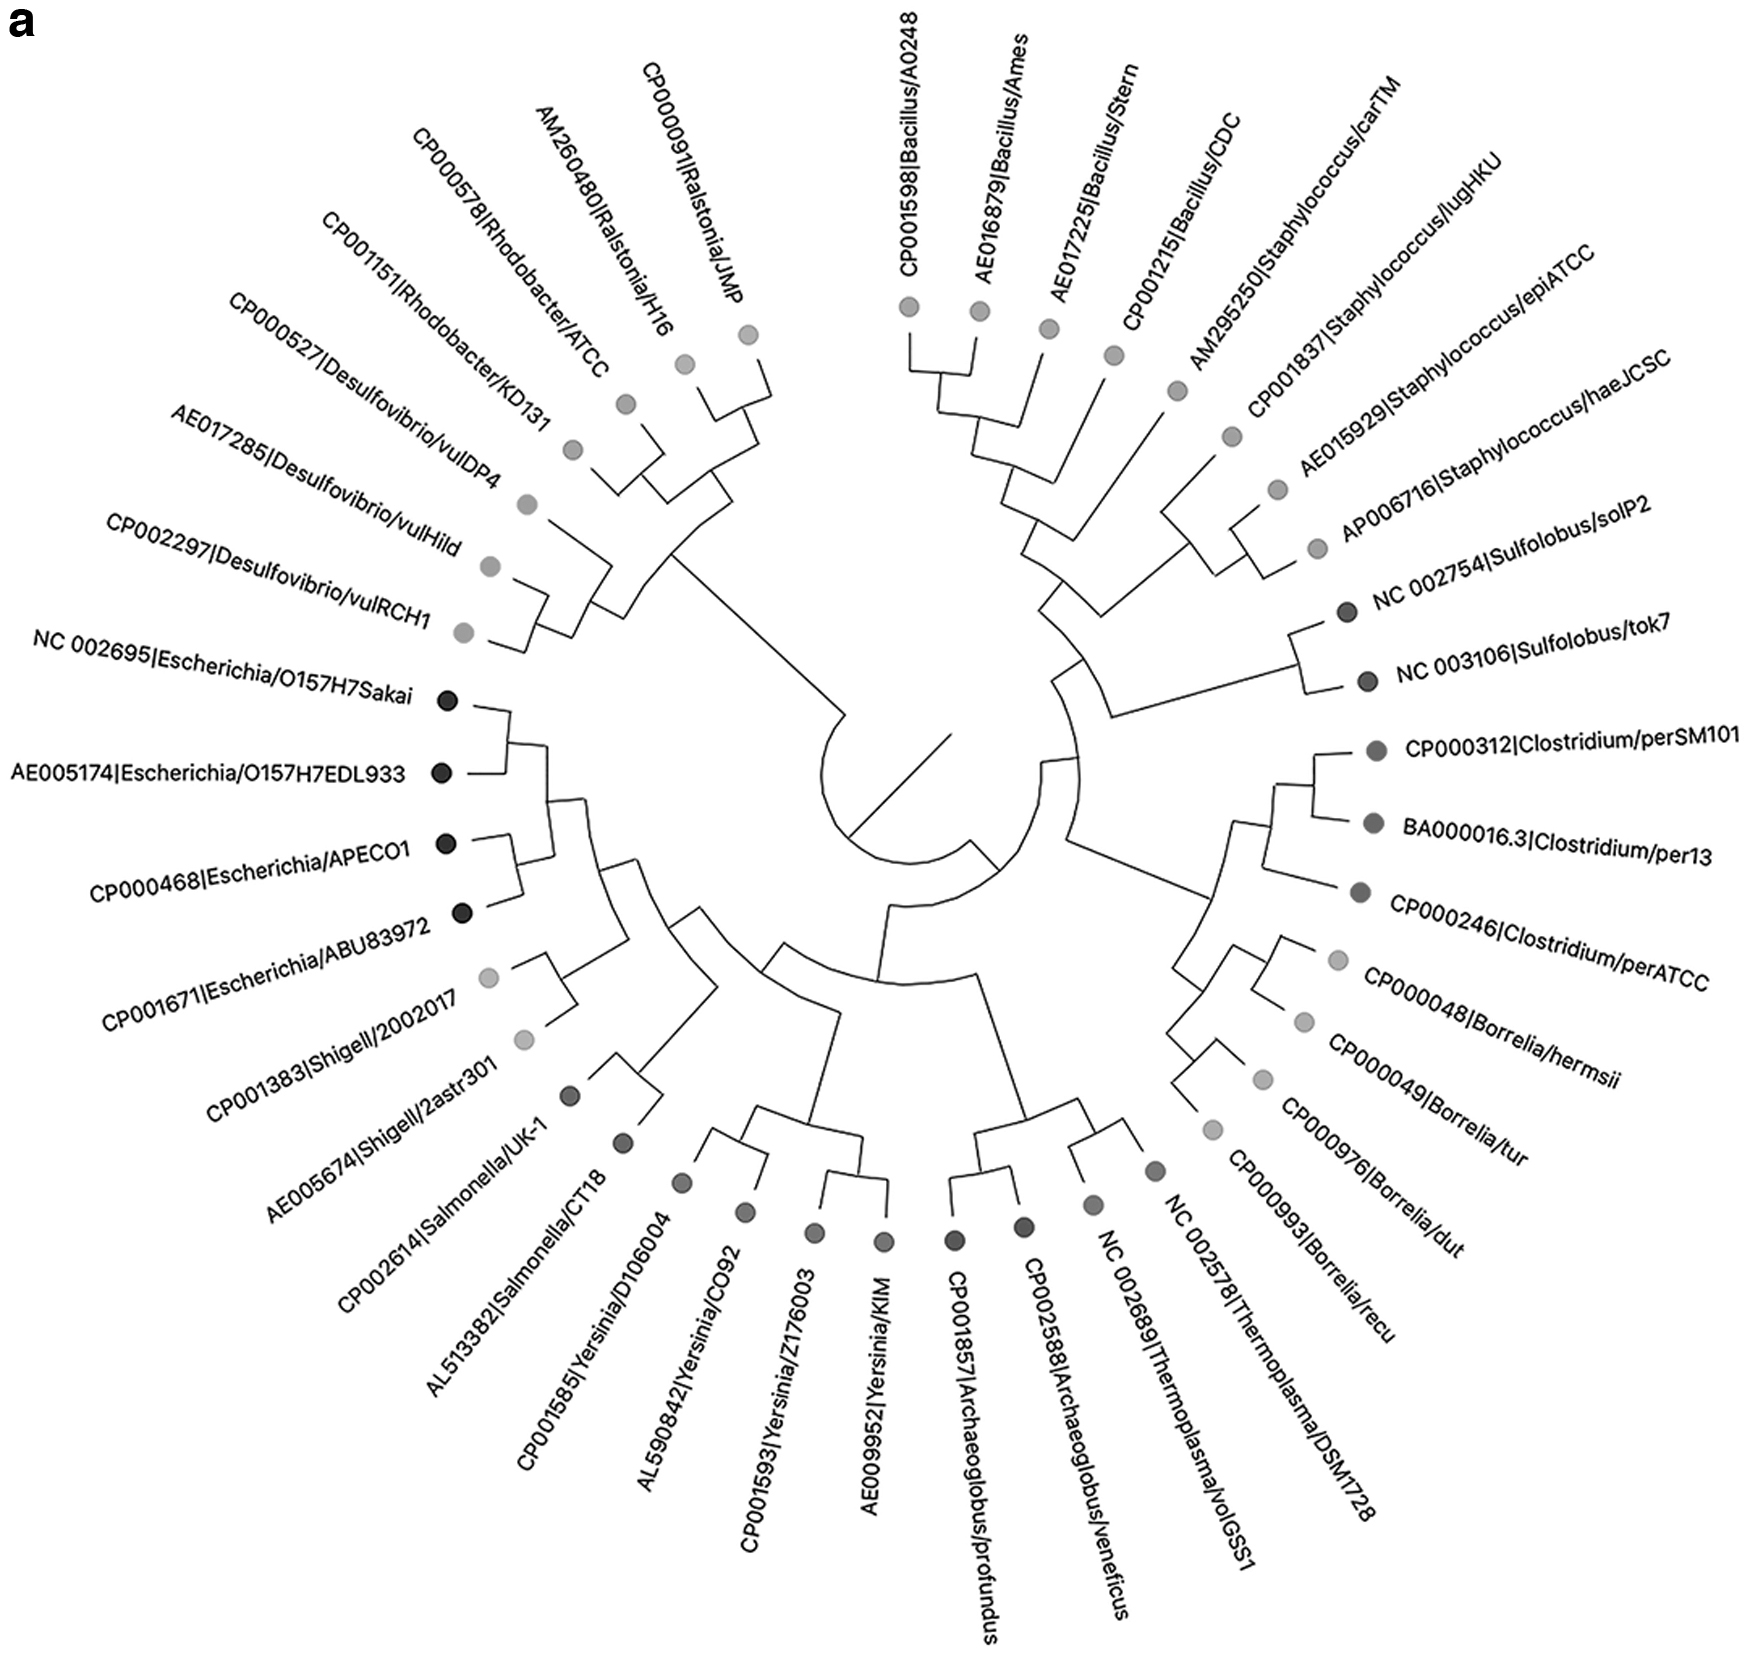
The clustering results of bacteria by kmer2vec/traditional k-mer method.
Kmer2vec has a good effect for separating them, which may be because kmer2vec considers the k-mer context information and can better analyze similar whole genomes. What's more, the clustering test of bacterial genomes can also show the advantage of kmer2vec in time using compared with the MSA method. The test can be finished within 1 hour using kmer2vec (when setting the parameter “epoch” to “1” in the word2vec model), however, it cannot be finished within 1 day using the MSA method on the same computing platform.
3.3.2. Clustering effect test of influenza viruses
Next, we use the NA gene dataset of influenza viruses to test the clustering effect of viruses by both kmer2vec and the traditional k-mer method (k = 6, which shows the best result among k = 2–7). From the results in Figure 7, we can see that the clustering effects of kmer2vec and the traditional k-mer method are both good, making all the species of the same taxa clustered together, which fully meets our expectations. However, the H3N2 influenza viruses have a closer relationship with H7N3 and H5N1 viruses by kmer2vec, while using the traditional k-mer method, the H3N2 influenza viruses are closer to H1N1 viruses. According to the results obtained by MSA method and the biological properties of influenza viruses, kmer2vec is more accurate than the traditional k-mer method. In addition, this test proves that kmer2vec can also be used for specific gene comparison.
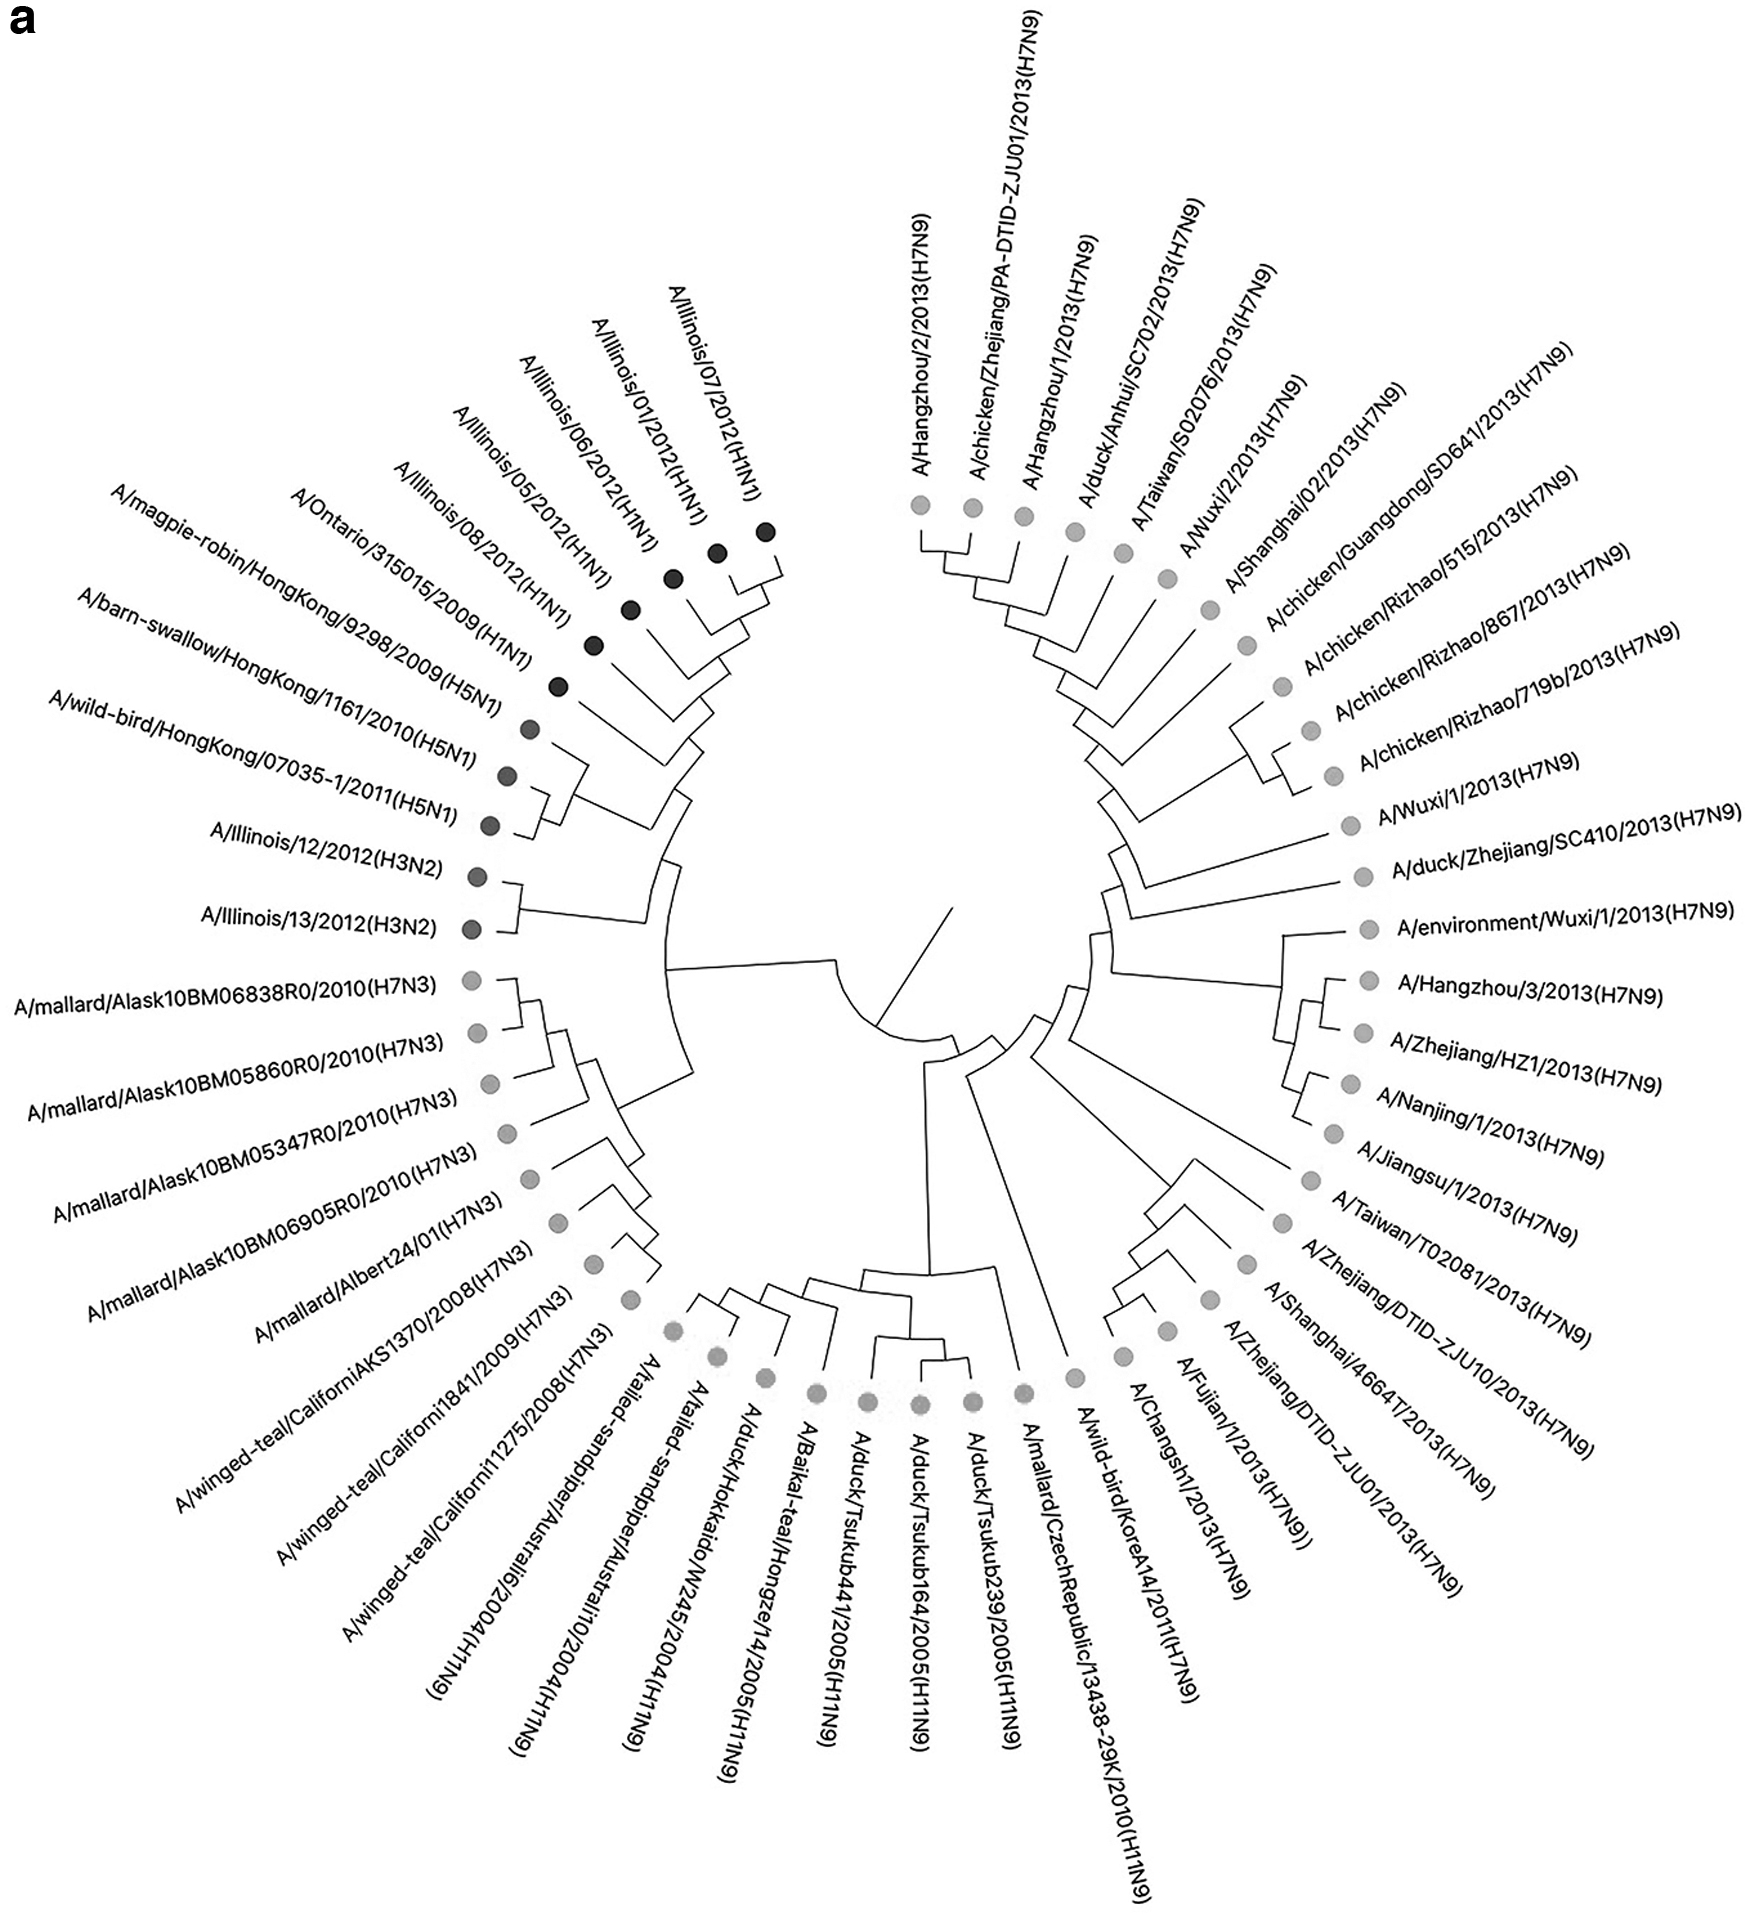
The clustering result of influenza viruses by kmer2vec/traditional k-mer method.
The above experiments have proved that the method constructed based on word2vec is reliable and robust in DNA sequence comparison and has very bright applications.
3.4. Classification test of coronaviruses in a larger scale
The above experiments show the effectiveness of kmer2vec on phylogeny and clustering in small datasets. To further demonstrate the universality of the method in a larger scale, we want to do some other experiments. Combined with the coronavirus problem in today's world, we hope to verify the effect of kmer2vec on coronavirus typing. When in a large scale, it is impossible to show the phylogenetic tree. Therefore, we choose to show the classification results. We use 18,698 sequences of SARS-CoV-2, which contains 8456 early SARS-CoV-2 sequences, 9250 Delta mutants, and 992 Omicron mutants.
As there are many “N”s in the sequences except “A”s, “T”s, “C”s and “G”s, which will have a bad influence on the accuracy, we remove only “N”s from each genome. Because of the overlapping strategy, the removal of “N”s is practicable and will not have too much bad influence. We first use kmer2vec to get the vector of each sequence and then use the k-means method (Hartigan and Wong, 1979) to classify the sequences according to their corresponding vectors. Finally, we use the T-SNE method for dimension reduction and visualization of the clusters (Fig. 8).

Classification test of SARS-CoV-2 variants in a larger scale. Each point represents a genome sequence. Center-area points represent the early SARS-CoV-2 sequences from January 1, 2020 to May 20, 2020, left-area points represent Delta variants (December 22, 2021–January 22, 2022, USA) and lower-right-area points represent Omicron variants (December 1, 2021–January 22, 2022). The red stars show the cluster centers.
The final accuracy of the classification experiment is over 99.6% and the running speed is much faster than MSA methods. The results prove the effectiveness of our method (k = 4) in a large scale. In addition, the results also show that kmer2vec can be a good tool for rapid coronavirus classification.
3.5. An interesting phenomenon
We find an interesting phenomenon during the experiment using the 16 coronaviruses. When choosing the nonoverlapping strategy, under the three kinds of datasets, when k = 3 and k = 6, there is a trough in the accuracy. However, this phenomenon does not occur under the overlapping strategy shown in Figure 3. The specific situation of the interesting phenomenon is shown in Figure 9.
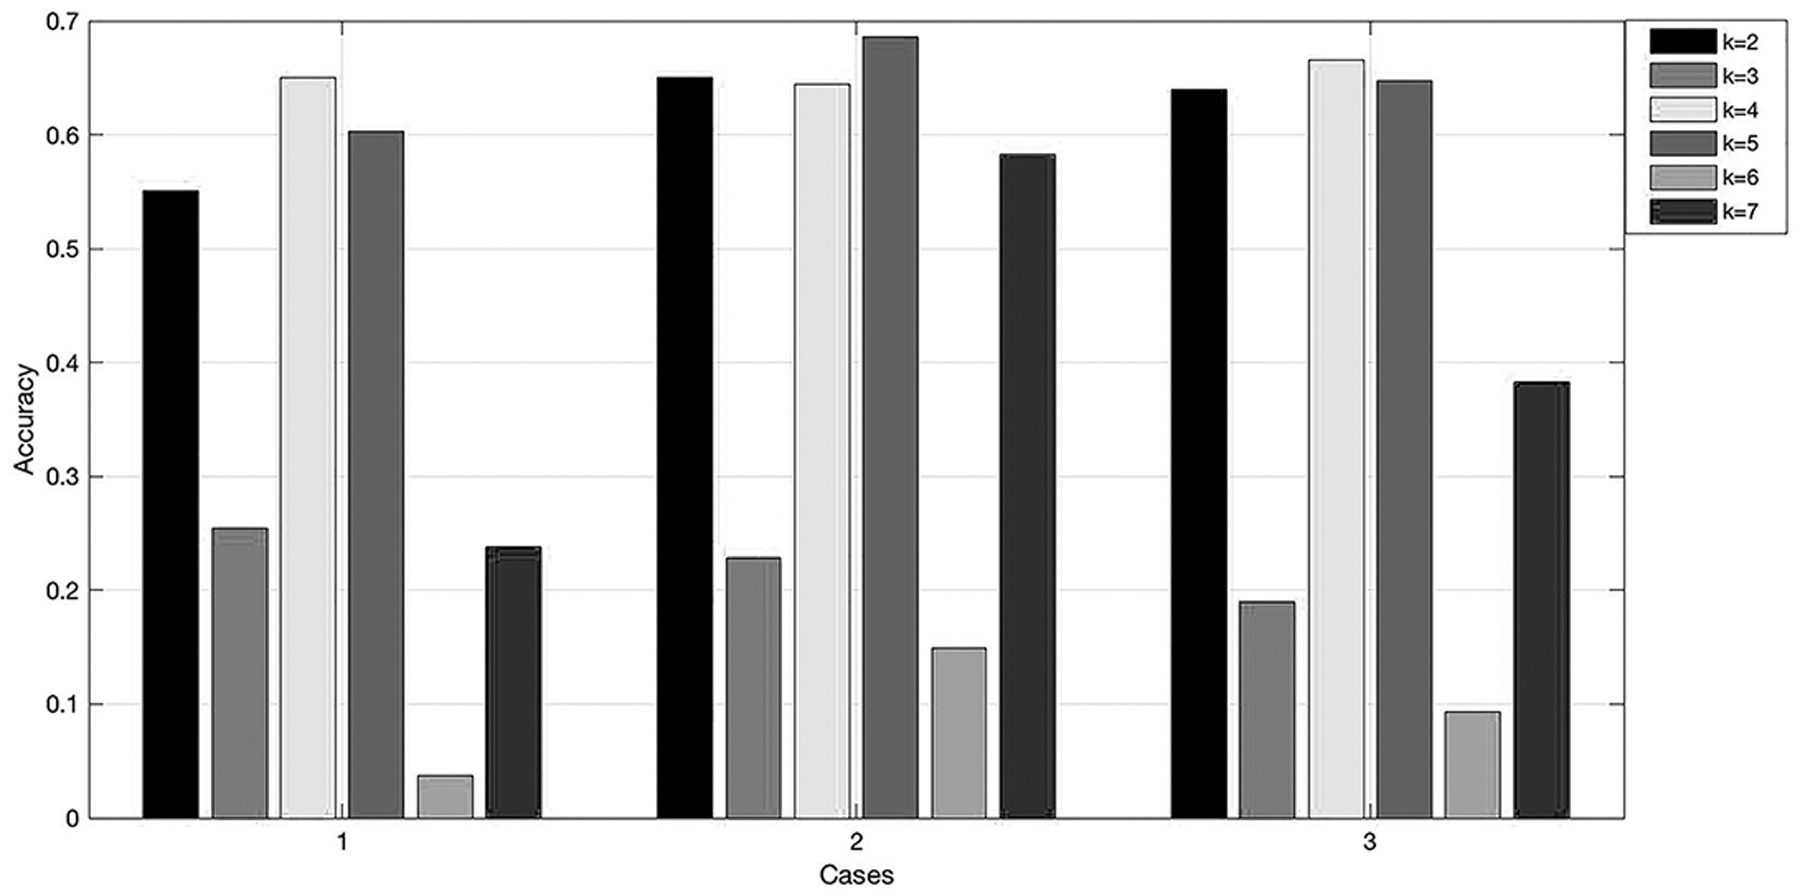
The accuracy of our methods with different k values in three groups using the nonoverlapping method. “Cases” show the combination of parameters or strategies except for the k value in each group. Specifically, case 1 is the combination of dataset 1, nonoverlapping, window = 24, average+variance, and Euclidean distance. Case 2 is the combination of dataset 2, nonoverlapping, window = 24, average+variance, and Euclidean distance. Case 3 is the combination of dataset 3, nonoverlapping, window = 24, average+variance, and Euclidean distance.
It can be seen from the figure that there is a trough in the accuracy of genetic distance in the three groups when k = 3 and k = 6. When using dataset 1 for training, although the accuracy rate of k = 7 is also low, from the comparison of dataset 2 and dataset 1 we can know that this is mainly because the size of the training dataset is not enough. The reason for the low accuracy of genetic distance when k = 3 and k = 6 may be due to the triplet codon theory (Crick et al., 1961). When k is a multiple of 3, the change of the starting position has the greatest impact on the accuracy of genetic distance, similar to the impact of frame-shift (Ripley, 1990), resulting in a trough in the accuracy.
4. Discussion
The computational experiments and results demonstrate that the proposed kmer2vec method performs well in the comparison of DNA sequences, such as phylogeny and species classification of whole genomes. The kmer2vec method can extract the semantic information of k-mers through the context of DNA sequences. The k-mer word segmentation method and vector representation of DNA sequences also contribute to the accuracy and performance of the method. However, our method also has limitations, which lead to the small deviation of the phylogenetic tree of coronaviruses and abnormal result that Staphylococcus/carTM is clustered with Bacillus bacteria in bacterial genomes clustering test.
After obtaining the kmer2vec vectors, our method represents a DNA sequence by taking the average and variance of the k-mer word vectors. This approach can normalize and avoid the large proportion of the length information of DNA sequences. However, this process ignores the length information of nucleic acid sequences. In addition, different k-mer words occupy different positions in the segmentation, and their position information is not well considered in the average and variance of k-mer word vectors. Therefore, our method compares DNA sequences mainly through the similarity of the overall pattern of the sequences. Although our method has good performance in DNA sequence comparison in most cases, the method can be greatly improved if we can find a suitable method considering length information and location information in a proper way, which will also be the focus of our future work.
In addition, an interesting phenomenon is discovered during the process of determining parameters, which coincides with corresponding biological theories. We find that when choosing the nonoverlapping strategy, under the three kinds of datasets, when k = 3 and k = 6, there is a trough in the accuracy. However, this phenomenon does not occur under the overlapping strategy. Specifically speaking, the interesting aspects of this phenomenon are as follows. To begin with, this phenomenon demonstrates again that word2vec can indeed extract information on the biological significance of sequences from another perspective. In addition, it implies that word vector information extracted from biological sequences is mainly carried through triplet codons, which means that the triplet codons are the bridge between numerical information and biological properties. Another interesting point is that this phenomenon reminds us when designing and using computational methods, it is necessary for us to integrate them with biological meaning, and only then can we more effectively extract the biological information we need from our data. What's more, when combining kmer2vec with k-means methods, an effective tool for coronavirus typing can be derived, which also has an important role in the resolution of the coronavirus problem in today's world.
Word2vec embedding also has other significance. Genomes and protein sequences are information texts, the texts are the results of life genetic information and biochemical properties. There is much effort in the research community for finding effective (and scientific) numerical embeddings of gene (Kwan and Arniker, 2009) and protein information (Kawashima et al., 2007) because only numerical representation can be operated by most mathematical and computer science algorithms except direct string comparisons. Word2vec can be a successful solution to the numerical representations of genome and protein sequences although there are still many theoretical problems and different understandings of the algorithm. Our experiments on phylogeny and clustering can demonstrate that the trained word2vec contains both contextual (positional) information of the sequences, and very importantly, the content information of the sequence.
Thus, the word2vec can be an effective numerical k-mer, but more than k-mers because word2vec contains both contextual and composition information. This word2vec vectors of genomes or protein sequences are the result of the global and local genetic information (in DNA sequences) and biochemical properties (in protein sequences).
Footnotes
Authors’ Contributions
R.R.: Programming and software, data curation, result analysis and visualization, writing—original draft, and revising. C.Y.: Conceptualization, methodology, investigation and result validation, and writing—review and editing. S.S.-T.Y.: Conceptualization, methodology, funding acquisition, project administration, and writing—review and editing.
Acknowledgments
Prof. Stephen S.-T. Yau is grateful to the National Center for Theoretical Sciences for providing an excellent research environment while part of this research was done.
Author Disclosure Statement
The authors declare they have no known competing financial interests or personal relationships that could have appeared to influence the work reported in this article.
Funding Information
This work is supported by National Natural Science Foundation of China (NSFC) grant (12171275), Tsinghua University Spring Breeze Fund (2020Z99CFY044), Tsinghua University start-up fund, and Tsinghua University Education Foundation fund (042202008).

References
Supplementary Material
Please find the following supplemental material available below.
For Open Access articles published under a Creative Commons License, all supplemental material carries the same license as the article it is associated with.
For non-Open Access articles published, all supplemental material carries a non-exclusive license, and permission requests for re-use of supplemental material or any part of supplemental material shall be sent directly to the copyright owner as specified in the copyright notice associated with the article.
