
Abstract
Assay for transposase-accessible chromatin sequencing (ATAC-seq) has become one of the most widely used sequencing methods in studies of gene regulation, aiming to identify open chromatin sites and decipher how chromatin accessibility regulates gene expression. However, due to a lack of programming experience or minimal bioinformatics training, it is difficult for biologists to fully explore and interpret ATAC-seq results. Despite several available programs or websites that allow researchers to analyze and visualize ATAC-seq data, several limitations exist. ATAC-seq data differential expression analysis (ATAC-DEA), a web application that facilitates the exploration and visualization of differential peak analysis and annotation from ATAC-seq data, was developed (www.atac-dea.xyz:3838/ATAC-DEA). ATAC-DEA uses DiffBind and ChIPpeakAnno to process differential peak and annotation analysis results. ATAC-DEA has five features: (1) runs on a web server; (2) processes three files into one small file, which is used as the input for ATAC-DEA; (3) availability of various downloadable plots; (4) multifactor analysis and customized contrast model; and (5) annotates individual, overlapped, and differential peaks. It provides an easy-to-use user interface (UI) design for users to explore the data and modify the parameters interactively based on experimental purposes. ATAC-DEA allows biologists to generate user-friendly visual results from ATAC-seq downstream analysis.
INTRODUCTION
Assay for transposase-accessible chromatin sequencing (ATAC-seq) has been widely used in studies of gene regulation, especially in the field of epigenetics. Compared with other epigenetic sequencing methods, ATAC-seq is a simple and time-efficient method that captures open chromatin sites from a relatively small number of cells (Buenrostro et al., 2013). ATAC-seq data analysis consists of four steps, including (1) raw data quality control (QC) and alignment; (2) peak calling; (3) downstream analysis, including differential peak analysis and peak annotation; and (4) motif enrichment and activity analysis, nucleosome positioning, and regulatory network reconstruction with other omics data (Yan et al., 2020).
Several bioinformatics analysis tools have been developed for ATAC-Seq data analysis, including atacR (Shrestha et al., 2018), ATAC-pipe (Zuo et al., 2019), esATAC (Wei et al., 2018), GUAVA (Divate and Cheung, 2018), DEBrowser (Kucukural et al., 2019), I-ATAC (Ahmed and Ucar, 2017), recoup (Moulos, 2021), and snakePipes (Bhardwaj et al., 2019). Among these tools, atacR, ATAC-pipe, esATAC, and GUAVA were designed exclusively for ATAC-seq data analysis, and DEBrowser, I-ATAC, recoup, and snakePipes were designed not only for ATAC-seq but also for other omics data, such as RNA-seq and ChIP-Seq.
These existing tools have many advantages (Table 1); however, these tools require input files in certain formats, such as FASTQ or BAM format. These files are typically large in size [Gigabyte (GB) level] and require certain software to handle and process. Therefore, researchers with no programming experience or little bioinformatics training might find these tools difficult to use. In addition, most applications are highly platform dependent, and the operating environment is restricted. Although many graphical interfaces have been designed for user-friendly demands, the customized analysis of these applications is limited.
Comparison Between ATAC-DEA and Other ATAC-Seq Data Analysis Tools
Comparison Between ATAC-DEA and Other ATAC-Seq Data Analysis Tools
To enable biologists to achieve preferable and visual results, we used Shiny to develop an ATAC-seq differential peak and annotation application [ATAC-seq data differential expression analysis (ATAC-DEA)]. Regarding the functions of ATAC-DEA, we mainly focused on the differential peak analysis and peak annotation that are both essential in ATAC-seq downstream analysis. In ATAC-DEA, we employ the approaches of DiffBind (Stark and Brown, 2011) and ChIPpeakAnno (Zhu et al., 2010) to perform analysis and design the operation panels for users to precisely control the analysis procedure and obtain visual results.
ATAC-DEA has five advantages: (1) researchers can directly use ATAC-DEA through webpages without downloading or installing packages; (2) users can preprocess three large files into one small file, which is used as the input for ATAC-DEA; (3) users can visualize data in various types of plots to explore the experimental results; (4) ATAC-DEA was designed to provide an easy-to-use, interactive, and visual interface; and (5) most functions are modularized so that users can customize the analysis based on experimental purposes.
Programming language
ATAC-DEA is implemented in R as a Shiny application. The webpage is free to access (www.atac-dea.xyz:3838/ATAC-DEA). The source code can be downloaded from GitHub (https://github.com/sufangwang-npu/ATAC-DEA). ATAC-DEA is accessed by users through two methods: (1) run ATAC-DEA directly through the webpage; (2) download the source code and drive the package in R or RStudio locally. ATAC-DEA consists of four sections: (1) upload, (2) analysis, (3) visualization, and (4) download. Following is an account of details in each step.
Data preparation
Because BAM files are inconvenient to transfer and upload, we designed this step in our protocol to transform the large BAM files into smaller peak data collection files. Then, users can work with this small input file. Three files are needed for data preparation: (1) DEList is a comma-separated value (.csv) sample sheet that needs to be created by users. The DEList contains the condition of each sample and the path under which each file is saved; (2) mapping results files (generally.bam file) are needed, and each sample has one BAM file; (3) peak calling results files (generally.bed file) derived from peak callers, such as MACS2 (v2.2.7), are also required (Zhang et al., 2008).
The three files need to be processed to obtain the correct format that can be utilized by ATAC-DEA. A local shiny application was designed for users to easily prepare these files. The application processes the three required files and outputs a peak data collection file as input for ATAC-DEA. Users can follow the instructions on the ATAC-DEA website to prepare the files.
Data analysis
ATAC-DEA takes two files as input: (1) the peak data collection file (generated from data preparation) and (2) peak calling results files (.bed). The first step of differential expression (DE) analysis is the establishment of a contrast model. ATAC-DEA employs two methods to establish a contrast model: (1) A specific contrast model is established according to the factor selected by users. Single-factor and multiple-factor analysis are both allowed in ATAC-DEA, and ATAC-DEA will establish the contrast model based on the user's choice; (2) all possible contrasts are established by ATAC-DEA automatically. ATAC-DEA will search all possible contrasts and arrange them in an interactive table, and users can select one of them to establish the contrast model.
After the establishment of the contrast model, users can press the “Do analysis” button and explore the analysis results by selecting available tabs, including Data Report, DE Analysis, and Peak Annotation, in the sidebar of ATAC-DEA. In DE analysis, ATAC-DEA identifies loci exhibiting significant differences using DESeq2 (v1.34.0; Love et al., 2014) or edgeR (v3.36.0; Robinson et al., 2010).
ATAC-DEA enables binding site annotation from humans and mice. This information reveals the relevant genes of each peak and output figures to illustrate the distribution of genomic elements. The significance of the overlapped genes was determined, and ATAC-DEA merged peaks across replicates to obtain the distances between peak location and nearest transcription start site and nearest genes based on their genomic location. Analysis for overrepresented Gene Ontology (GO) terms and Kyoto Encyclopedia of Genes and Genomes (KEGG) pathways can be accomplished using ChIPpeakAnno's getEnrichedGO and getEnrichedPATH functions, respectively.
Data visualization
The results of differential peaks analysis are displayed using the following formats: (1) A DE report table contains chromosome, peak position (start and end site of each peak), log2FoldChange (log2FC), and the false discovery rate (FDR); (2) a DE annotation table contains annotated features and symbols of each DE peak; (3) principal component analysis (PCA) plots are used to provide further insight into how samples are clustered; (4) interactive volcano plots highlight significantly differential peaks based on evidence of binding affinity (counted by differences in read densities). The volcano plot is interactive, and users may select the points on the plot to view the information of corresponding peaks; (5) a binding affinity heatmap allows users to view the patterns of differential peaks; (6) two bubble plots show the biological process of GO and KEGG enrichment analyses of differential peaks.
The results of the DE report table, volcano plot, KEGG, and GO analyses can be adjusted using the “Filter” tab. FDR and log2FC control the threshold of each plot.
Peak annotations are displayed in several diagrams: (1) A Venn diagram shows the number of overlapped peaks across replicates; (2) a genomic element distribution plot is used to summarize the distribution of peaks over different types of features, such as introns, exons, enhancers, proximal promoters, 3′ untranslated regions (UTRs), and 5′ UTRs; (3) Bubble plots show the biological process of GO and KEGG enrichment analysis for each sample and the overlaps between samples.
Data download
All tables (DE report table and annotation report table) and figures created by ATAC-DEA can be directly downloaded from the website. Table files are provided in .csv format, and high-quality figure files are provided in .jpeg format.
RESULTS
ATAC-DEA design and workflow
ATAC-DEA was developed using R language. The webpage of ATAC-DEA is composed of three panels (Supplementary Fig. S1 in Supplementary File S1). Panel 1 provides a description of ATAC-DEA. Panel 2 is a sidebar in which users can select functions and customize parameters. Panel 3 is the functional interface to operate the analysis and display the results. Panel 2 contains six sections: (1) Instruction; (2) Upload Your Data: upload user's data and do analysis; (3) Data Report: two interactive tables contain the result of DE analysis; (4) Filter: the parameter settings of FDR, log2FC, and the differential analysis method; (5) DE Analysis: figures including PCA, volcano plot, heatmap and bubble plot of enriched biological process of GO, and KEGG; (6) Peak Annotation: the result of peak annotation, including Venn plot, genomic element distribution plot, pie plot of annotated peaks, and bubble plot of enriched biological process of GO and KEGG.
The ATAC-DEA workflow includes five steps (Fig. 1): (1) data preparation; (2) data upload: use example data or upload user's own data; (3) data analysis: establish contrast model, process differential peak and annotation analysis; (4) data visualization; and (5) data download.

Workflow of ATAC-seq data differential peak and annotation analysis application (ATAC-DEA). ATAC-DEA, ATAC-seq data differential expression analysis; ATAC-seq, assay for transposase-accessible chromatin sequencing; DE, differential expression; GO, Gene Ontology; KEGG, Kyoto Encyclopedia of Genes and Genomes; PCA, principal component analysis.
The five most important features of ATAC-DEA are as follows: (1) users can run it on the webpage directly without downloading the source code; (2) users only need to upload small-size data as input; (3) it provides different types of visual results to allow users to fully explore the data, which may assist users better understanding the biological questions or phenomenon hidden in the data; (4) it has personalized settings to establish the contrast model (i.e., users can design their own single-factor or multifactor model, or ATAC-DEA can determine all possible contrast models, and users choose one of them that they would like to compare); and (5) the peaks in each individual sample and the differential peaks can be annotated, and this feature is currently only available through ATAC-DEA.
First, to demonstrate the utility of ATAC-DEA, we used the sequencing data of five breast cancer cell lines with different responses to tamoxifen against the transcription factor Era (Ross-Innes et al., 2012). Three cell lines were responsive to tamoxifen treatment, and the remaining two cell lines were resistant. The sample sheet, aligned reads, and peak files of the data were directly downloaded at http://https://www.cruk.cam.ac.uk/core-facilities/bioinformatics-core/software/diffbind. These files were processed following our data preparation step to get the peak data collection file, which was used as the input file for ATAC-DEA. For DE analysis, we considered the response to tamoxifen as the main factor.
Using ATAC-DEA, we output the same results as the original article, demonstrating the accuracy of our application (Supplementary Fig. S2 in Supplementary File S1). Next, we annotated two replicates of the BT474 cell line. Most peaks were identified in both replicates (898), and a small number of peaks were uniquely identified in each sample (Fig. 2A). The genomic element distribution of peaks in each sample showed consistency between replicates (Fig. 2B, C). We also performed GO analysis for two replicates of the BT474 cell line. The top 23 biological processes were plotted as a bubble plot (Fig. 2D). One annotation report of peaks was also created, which contains the feature name, location, strand, distance to peaks, and symbol of each peak (Supplementary Table S1 in Supplementary File S2).
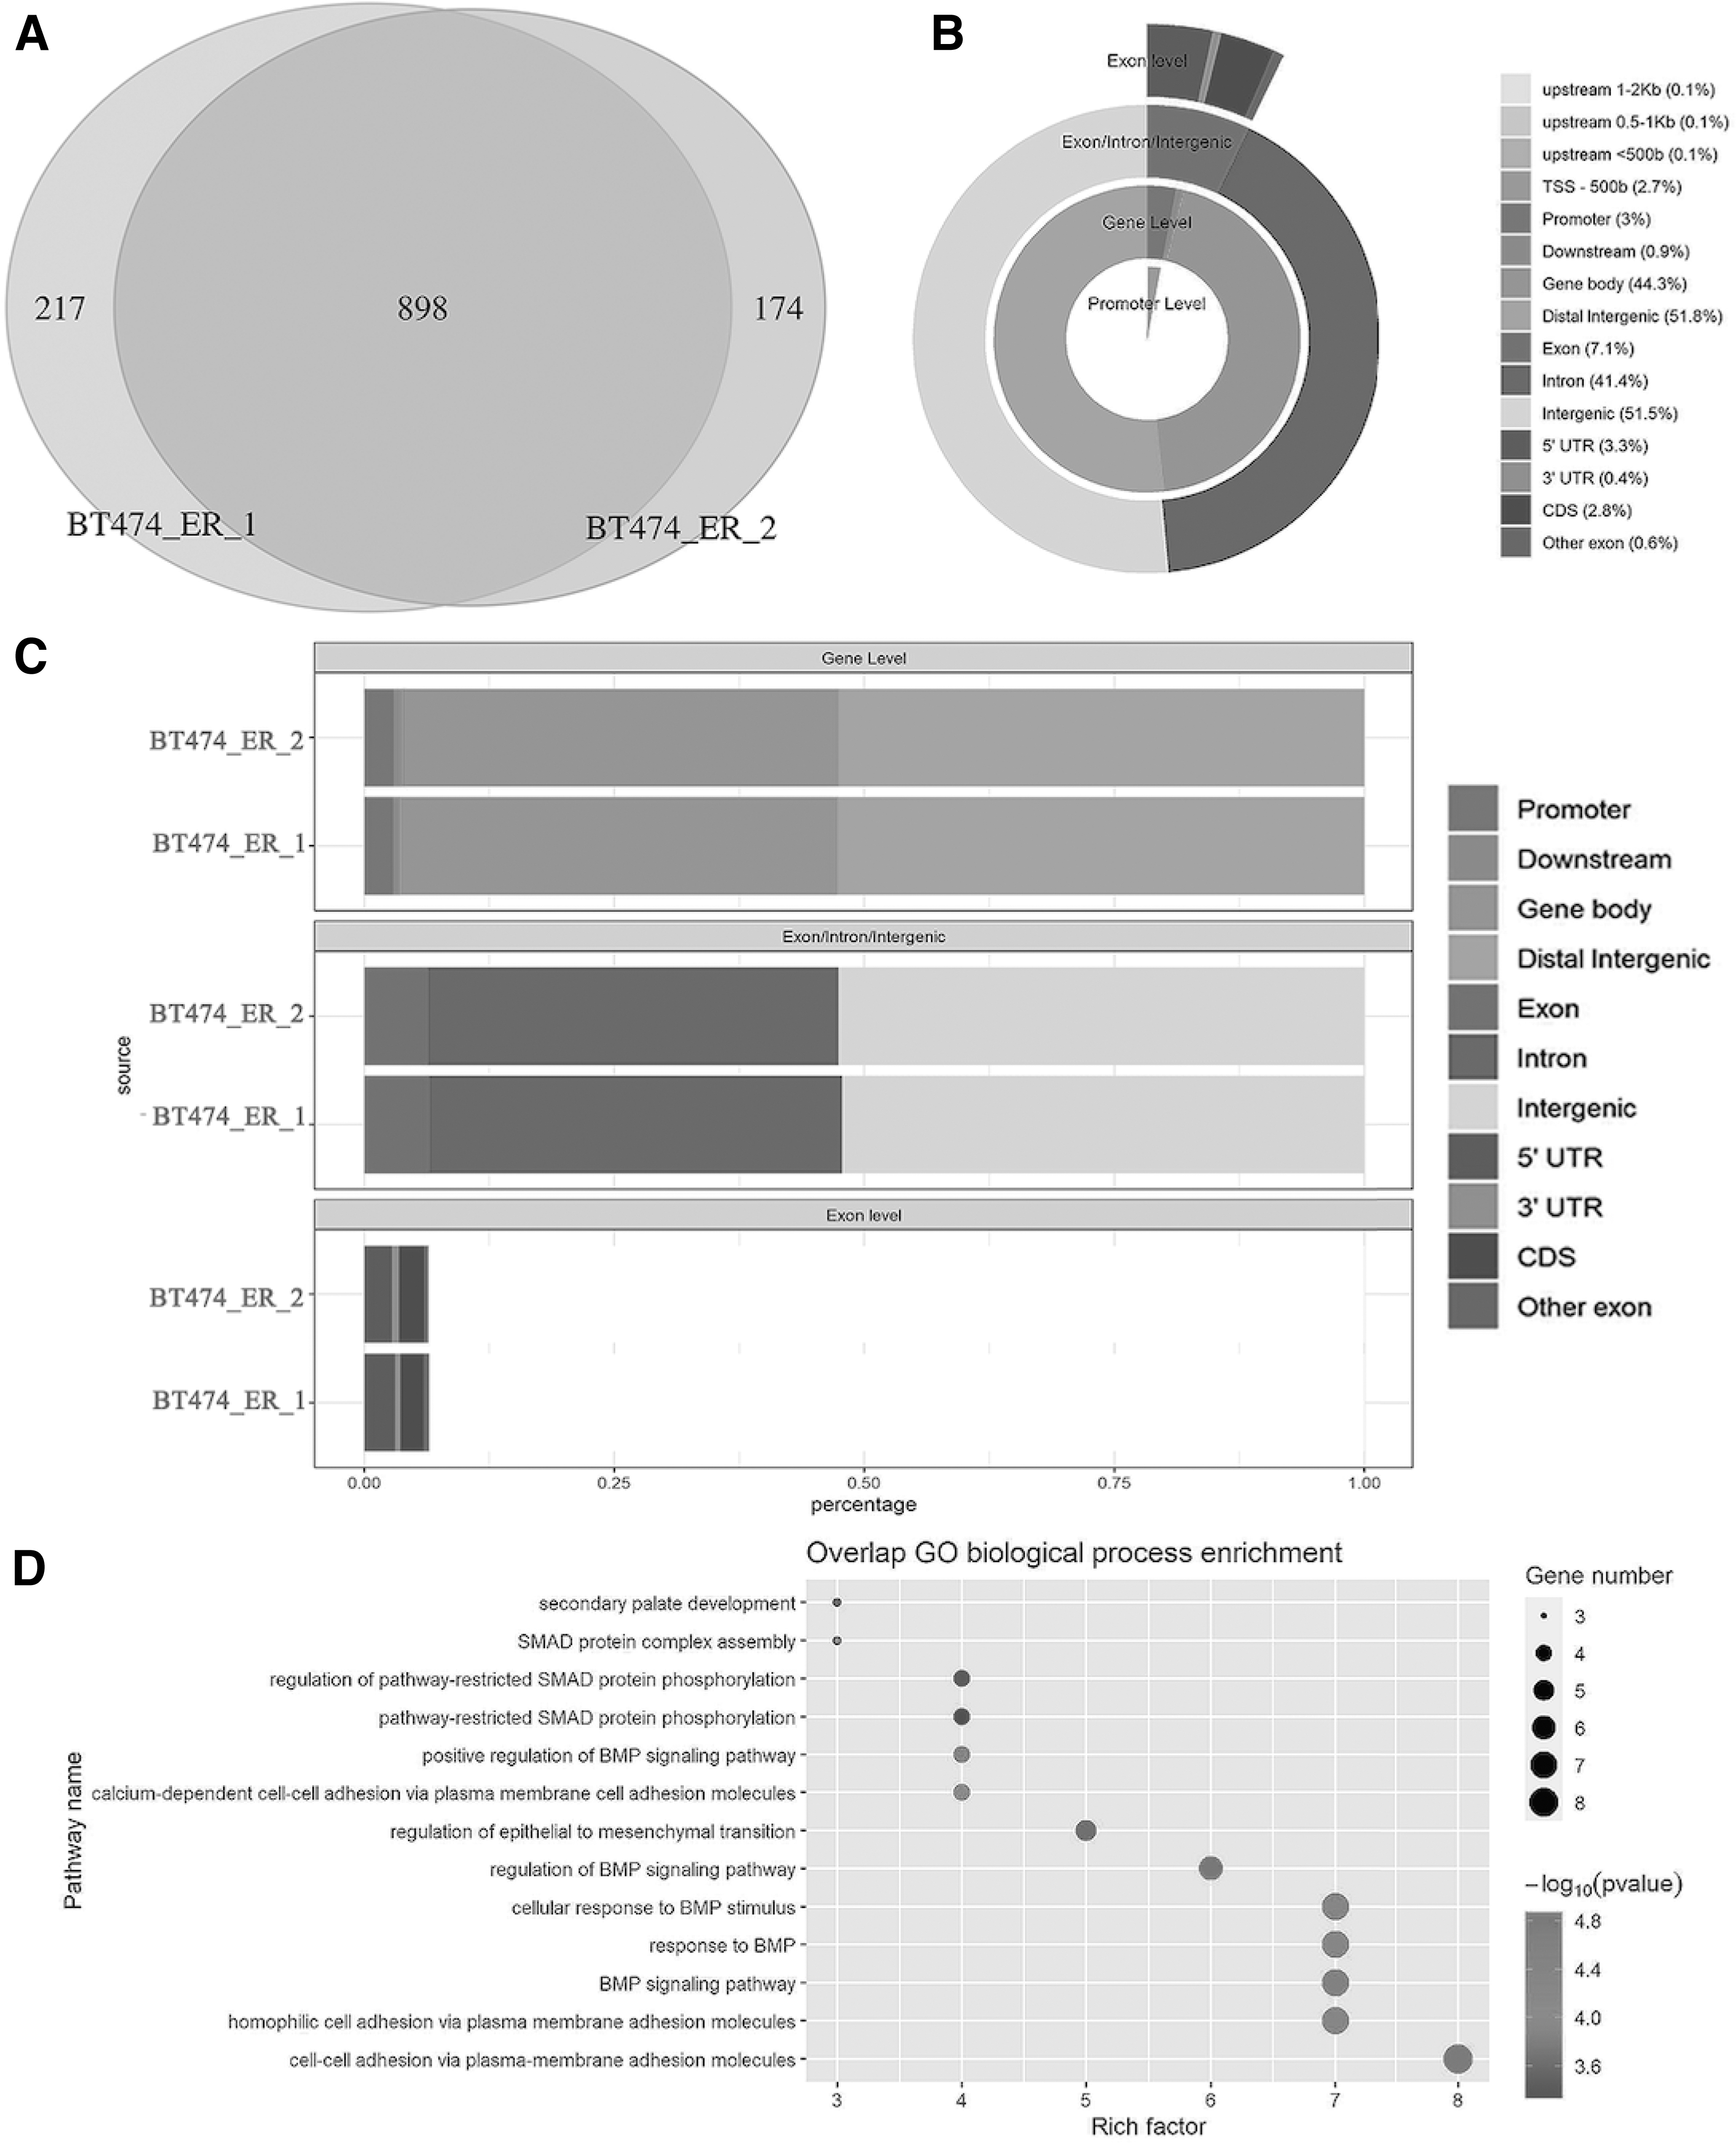
Validation of ATAC-seq data in annotation analysis.
Second, to further demonstrate the advantages of ATAC-DEA, we used recently published ATAC-seq data, which assessed the dynamics of chromatin changes during mouse lens fiber and epithelium differentiation (Zhao et al., 2019). The data sets contain two types of cells (embryonic E14.5 and newborn P0.5). Each type of cell had two developmental stages (epithelium and fiber), with two replicates for each. Therefore, a total number of eight samples were sequenced. We downloaded the sequencing reads from NCBI Sequence Read Archive (SRA) database and used bowtie2 (Langmead and Salzberg, 2012) for mapping. Then we used MACS2 (Zhang et al., 2008) for peak calling to obtain the peak files. We used our data preparation step to process these files to get the peak data collection file, which was used as the input for ATAC-DEA.
To identify the differences between types of cells and developmental stages, the original article used single-factor design and conducted four pairwise comparisons. However, in ATAC-DEA, we could use multifactor design to analyze the data. In multifactor design, the statistical model takes types of cells and developmental stage into account; thus, one model can identify the differential chromatin sites, which better reflects the true differences and reduces the workload. Then, E14.5 and P0.5 lens epithelial and fiber cells with two replicate each were compared using ATAC-DEA. We used a single-factor model and multifactor model to analyze the data. In single-factor analysis, the results aligned well with the original article (Supplementary Fig. S3 in Supplementary File S1).
In multifactor analysis, we used FDR ≤0.005 and log2FC ≥ ±0.5 as thresholds. We plotted the differential chromatin accessibility sites as a volcano plot (Fig. 3A), and the numbers of upregulated and downregulated peaks were 1125 and 132, respectively (Fig. 3B). PCA using all the differential peaks separated the eight samples into two corresponding pathways (Fig. 3C), indicating the accuracy of ATAC-DEA. Through hierarchical cluster analysis, two branches were clearly separated based on developmental stage (Fig. 3D), further supporting the advantages of ATAC-DEA. In addition, we annotated all the differential peaks, and the top 21 biological processes were plotted (Fig. 4A). Several important pathways, such as cell proliferation, cell differentiation, cell apoptosis, and cell migration, were revealed.
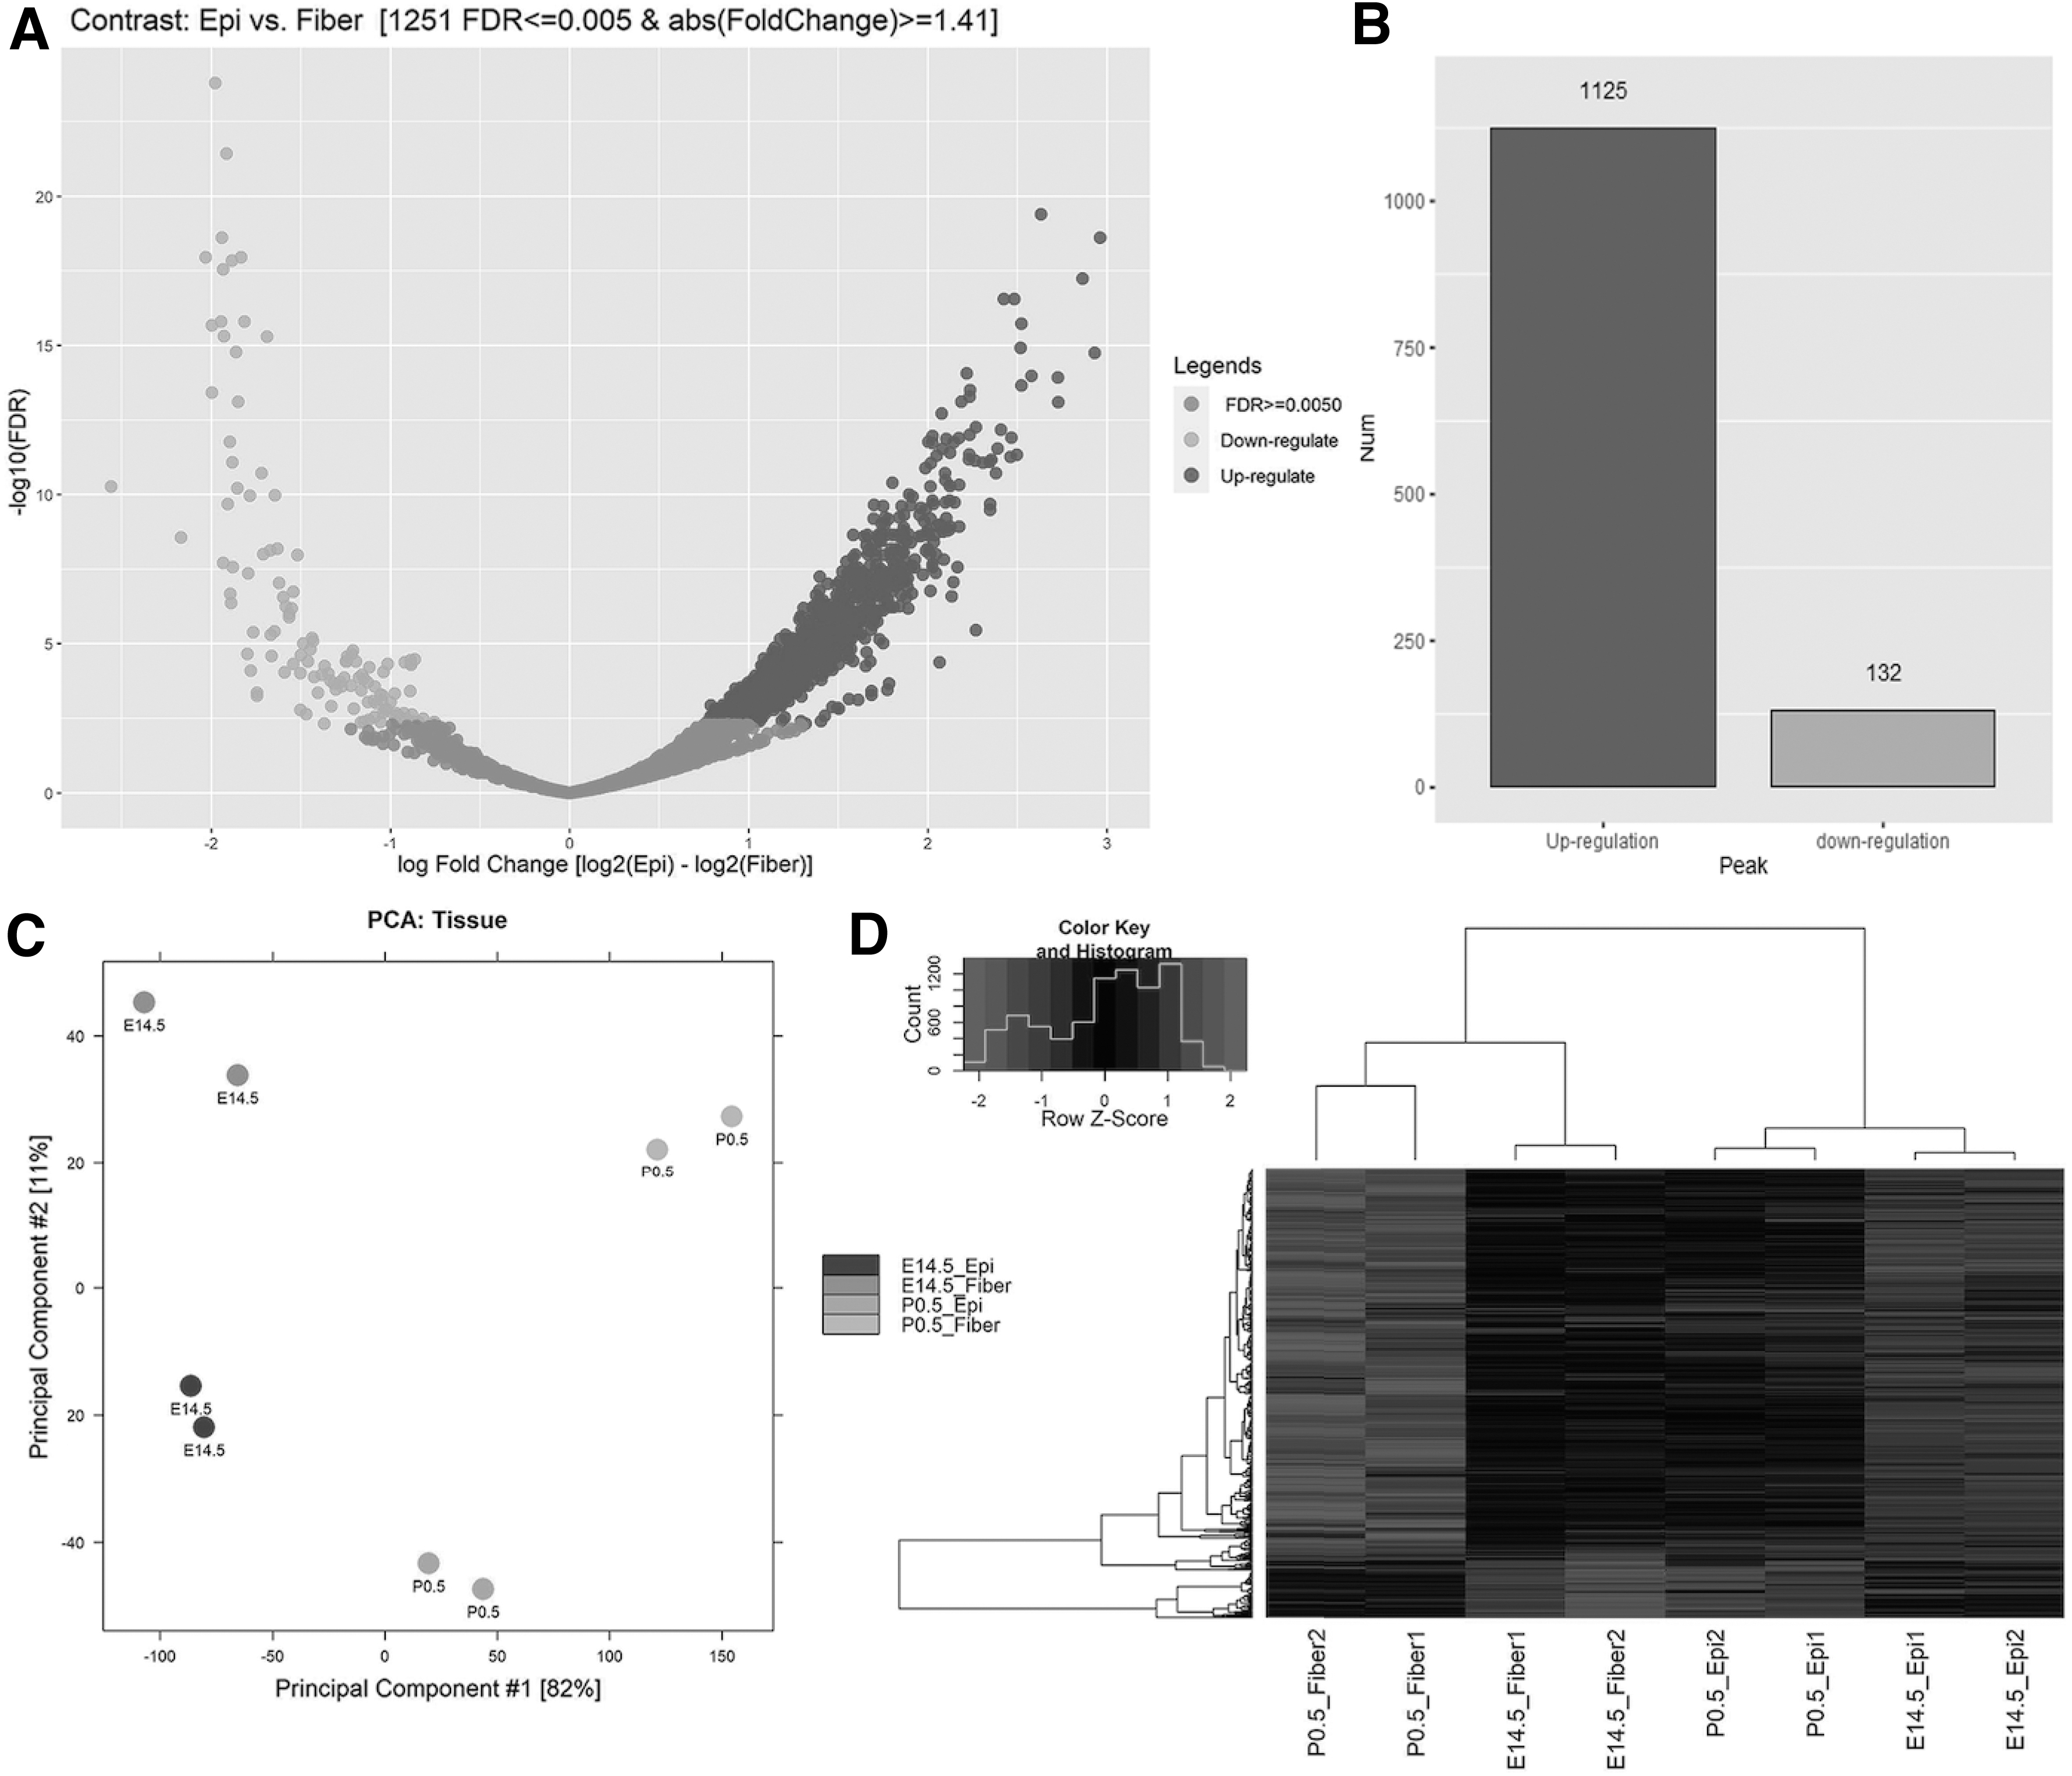
Validation of the ATAC-seq data with multifactor contrast model in DE analysis.
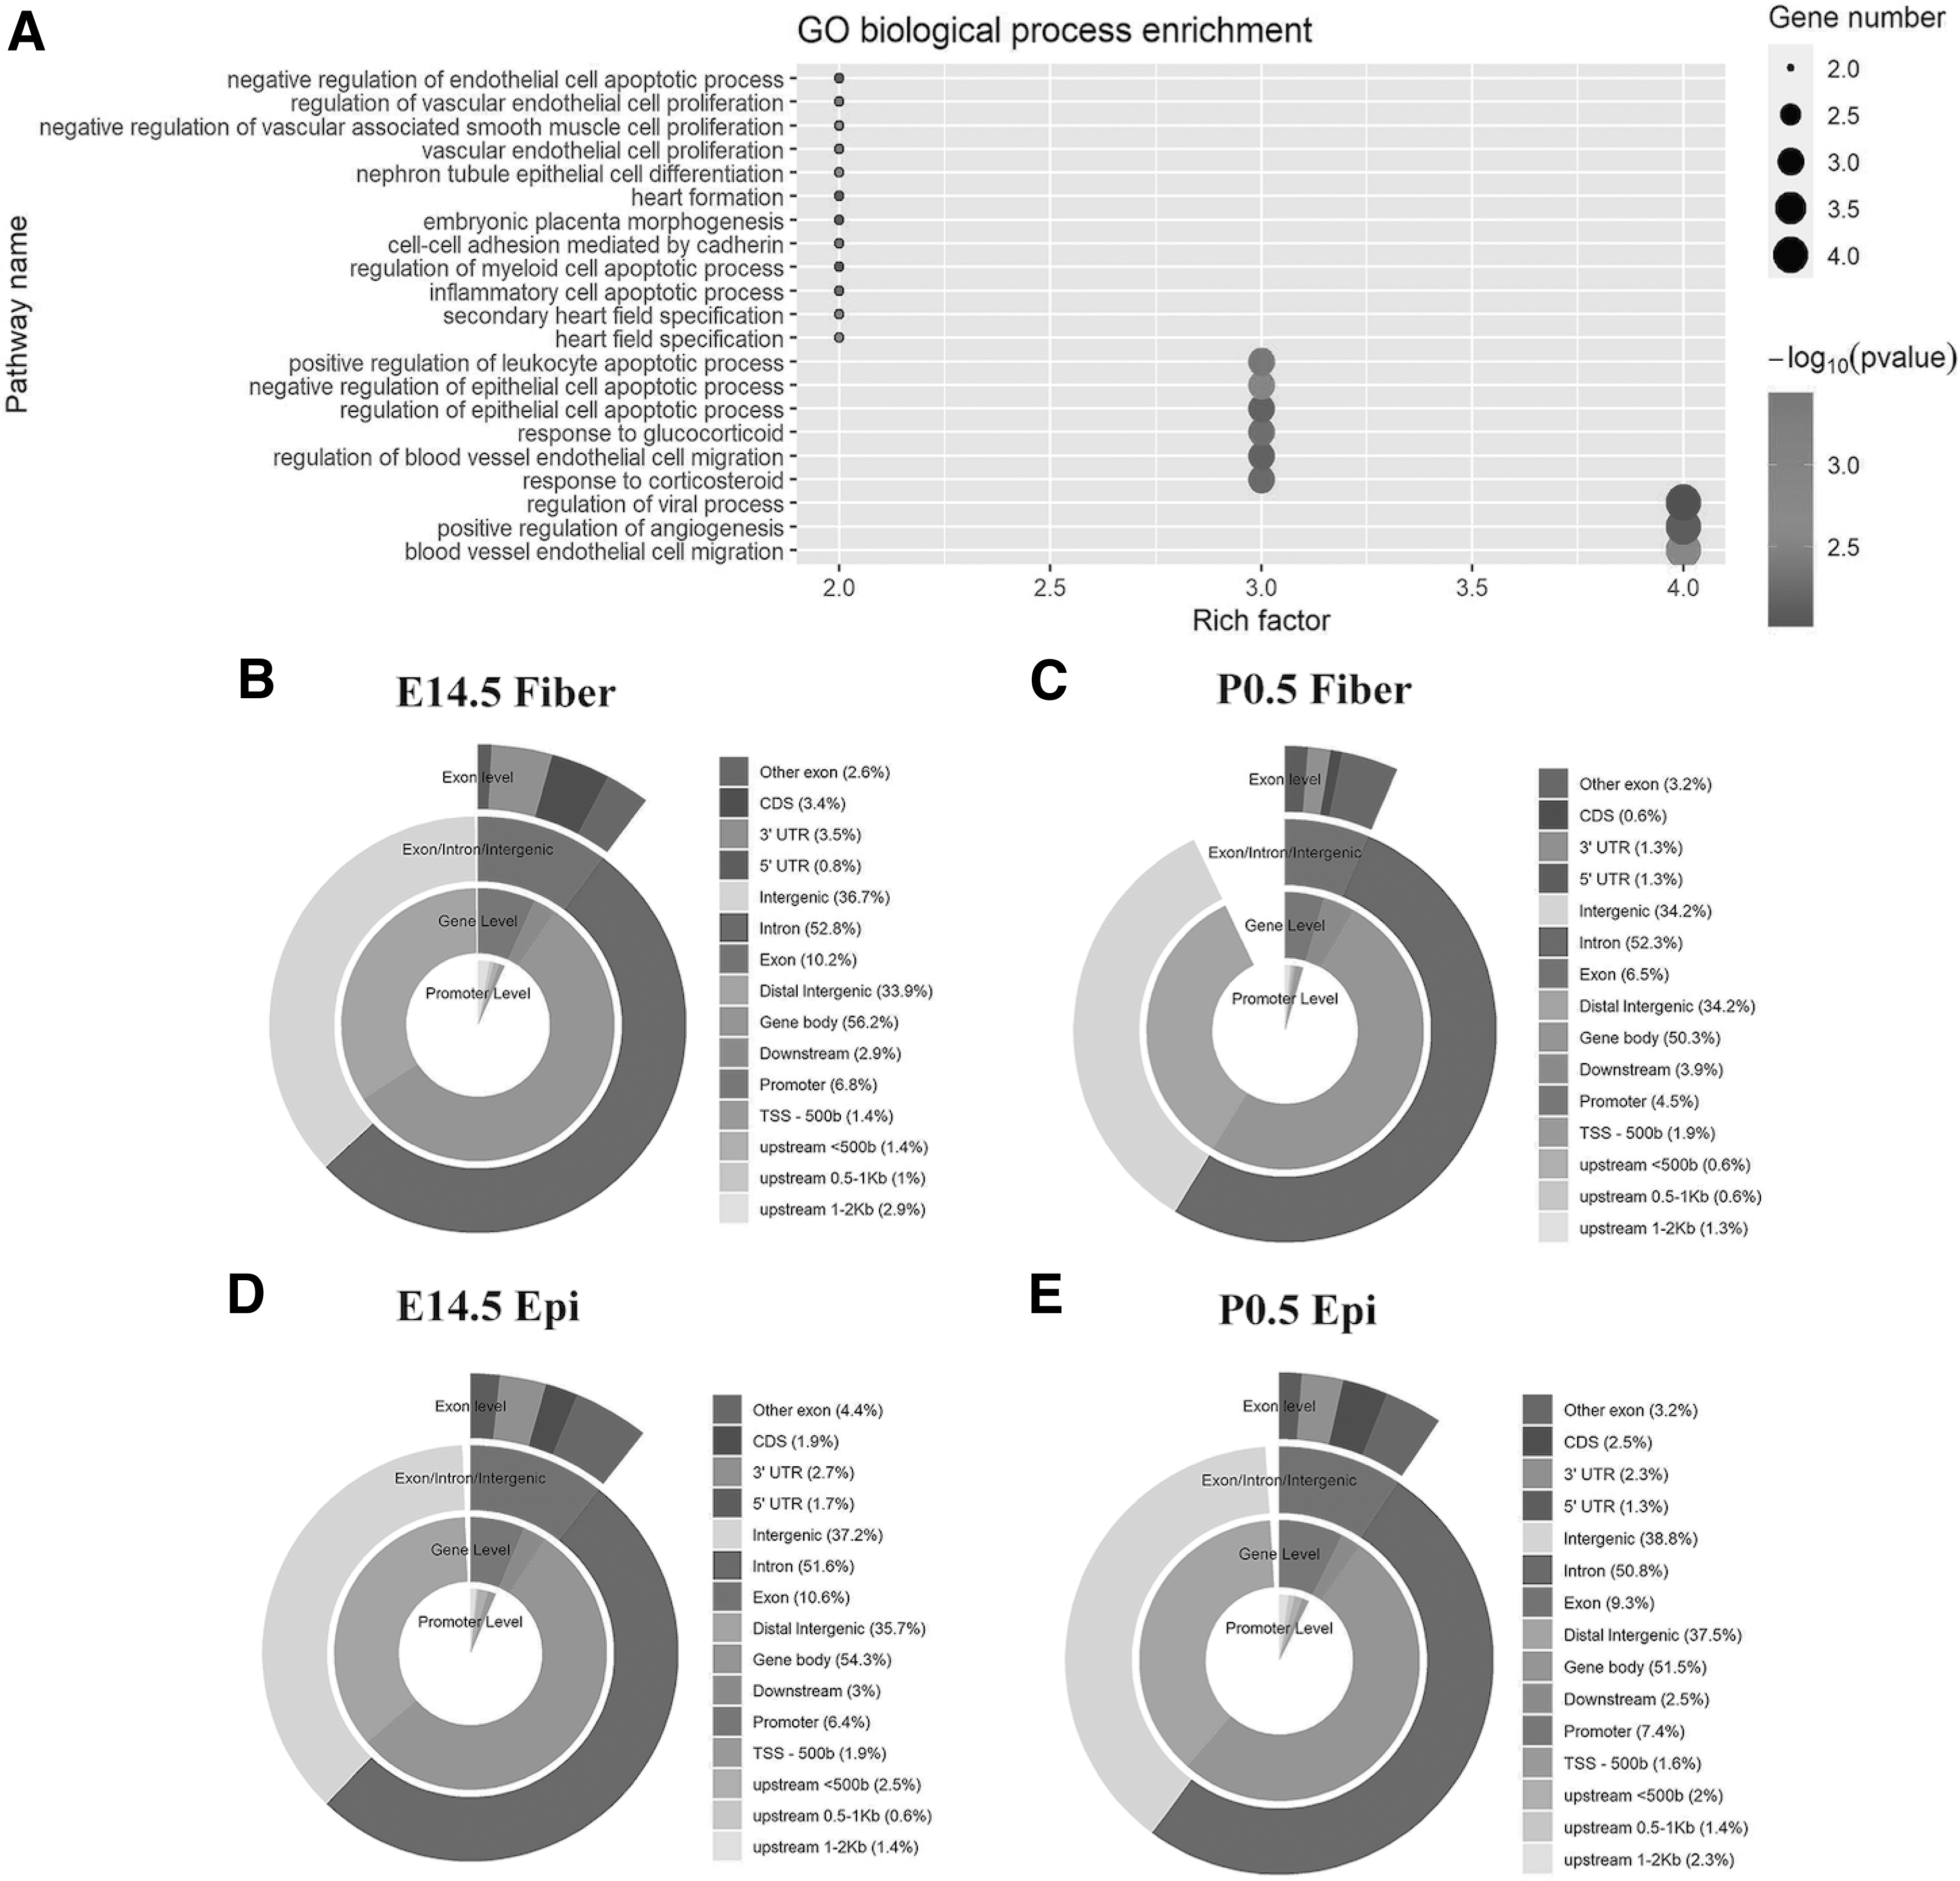
Validation of the ATAC-seq data with annotating the differential and overlapping peaks.
In addition to annotating the differential peaks, ATAC-DEA can also annotate peaks in each sample and overlapping peaks between samples. For example, we annotated the genomic distribution of elements for overlapping peaks between two replicates for each condition (Fig. 4B–E). The distribution at four levels (promoter level, gene level, exon/intron/intergenic level, and exon level) is shown. With more detailed annotation, the differences among conditions are more easily observed, which better assists biologists in identifying the biological mechanism.
Using the aforementioned two validation examples, we demonstrated that ATAC-DEA is a powerful tool for researchers to analyze ATAC-seq data and generate ideal results. Its multifactor design and ability to annotate differential peaks provides more valuable information to researchers. In addition, all the tables and figures generated by ATAC-DEA can be downloaded directly, and the figures are of high quality.
In this research, we provided a new starting point for users analyzing ATAC-seq data. The large BAM file can be transformed into a small file so that users can start from this file, and there is no need to repeat the previous steps, such as QC and mapping. ATAC-DEA facilitates the analysis and visualization of differential peak and annotation, which provides a friendly, interactive, and visual interface for users to design a contrast model using single and multiple factors, and modify the parameters according to the experimental purpose. Various types of plots are available, and the volcano plot is interactive such that users can explore the details of each peak. In addition, the two validation examples revealed that ATAC-DEA is applicable and could improve the results given its advanced settings. Thus, this program is more useful for biologists with limited programming skills. In conclusion, this application is of great significance for downstream analyses of ATAC-seq data.
Footnotes
AUTHORs' CONTRIBUTIONS
S.Z. developed the tool, performed the experiments, and wrote the draft. S.W. initiated and supervised the project, and revised the article.
AUTHOR DISCLOSURE STATEMENT
The authors declare they have no conflicting financial interests.
FUNDING INFORMATION
This study was funded by the National Natural Science Foundation of China (Grant No. 31800781).
References
Supplementary Material
Please find the following supplemental material available below.
For Open Access articles published under a Creative Commons License, all supplemental material carries the same license as the article it is associated with.
For non-Open Access articles published, all supplemental material carries a non-exclusive license, and permission requests for re-use of supplemental material or any part of supplemental material shall be sent directly to the copyright owner as specified in the copyright notice associated with the article.