
Abstract
The R package Continuous Glucose Monitoring Time Series Data Analysis (CGMTSA) was developed to facilitate investigations that examine the continuous glucose monitoring (CGM) data as a time series. Accordingly, novel time series functions were introduced to (1) enable more accurate missing data imputation and outlier identification; (2) calculate recommended CGM metrics as well as key time series parameters; (3) plot interactive and three-dimensional graphs that allow direct visualizations of temporal CGM data and time series model optimization. The software was designed to accommodate all popular CGM devices and support all common data processing steps. The program is available for Linux, Windows, and Mac at GitHub.
INTRODUCTION
Continuous glucose monitoring (CGM) is an effective tool to measure glucose concentration in the interstitial fluid at a relatively short gap of 5–15 minutes over a few days. Using CGM in patients with diabetes could improve glycemic control owing to the continuous monitoring (Battelino et al, 2019). Recently, a few software tools had been developed to facilitate better interpretation of CGM data (Broll et al, 2021; Millard et al, 2020; Vigers et al, 2019; Zhang et al, 2018), demonstrating various glucose fluctuation metrics associated with diabetes complications (Hirsch, 2015).
However, CGM by nature produces time series data, which could be decomposed into three components of trend, seasonality, and residuals originated from random glucose fluctuation. Time series analysis of this type of data has been fruitful in other fields such as stock price prediction (Devi et al, 2013; Rhif et al, 2019). It is expected comprehensive mining of CGM time series data could lead to breakthrough in accurate risk prediction of glycemic event and long-term complications (Hall et al, 2018; Kovatchev, 2017; Kovatchev and Clarke, 2008). In this study, we developed a software for Continuous Glucose Monitoring Time Series Data Analysis (CGMTSA) to provide essential functions that facilitate time series analyzes of CGM data.
RESULTS
CGMTSA provides three groups of functions for quality control, metrics calculation, and data visualization. As shown in Figure 1, in each group, we implemented methods to bring out the time series features of CGM data.
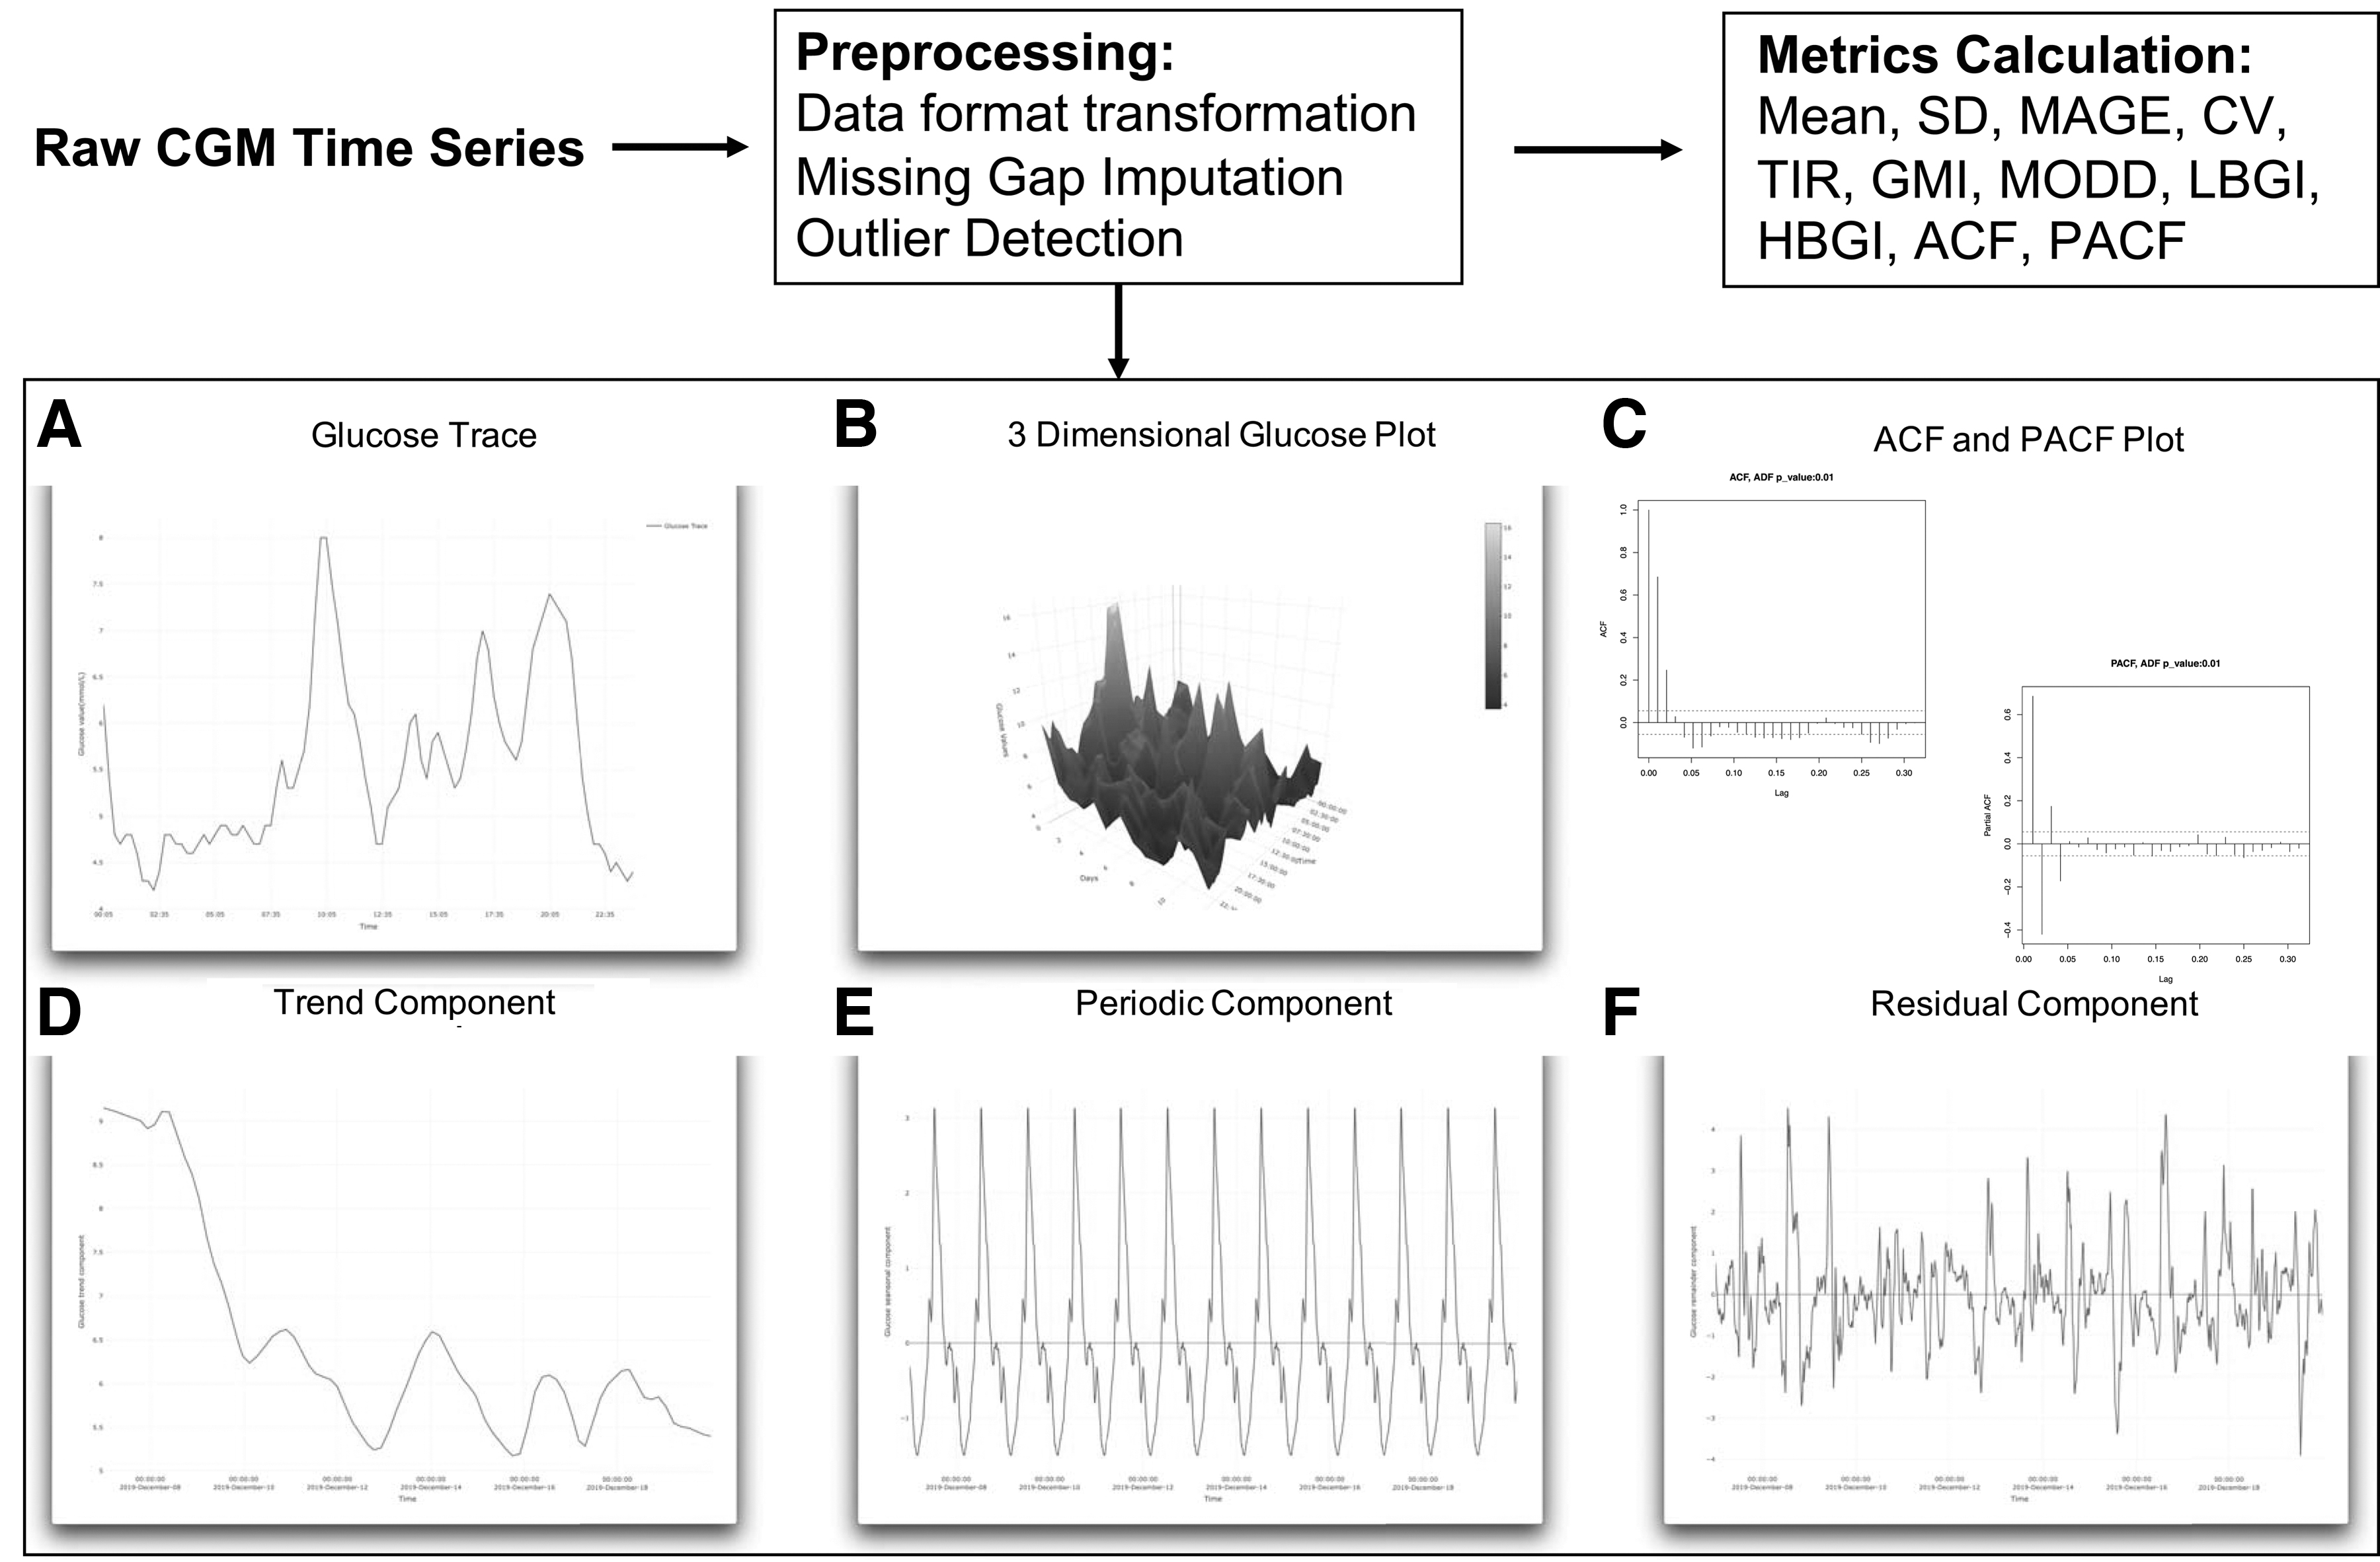
Workflow of continuous glucose monitoring time series data analysis. ACF, autocorrelation coefficients; CGM, continuous glucose monitoring; CV, coefficients of variation; GMI, Glucose Management Indicator; HBGI, high blood glucose index; LBGI, low blood glucose index; MAGE, mean amplitude of glycemic excursion; MODD, mean of daily difference; PACF, partial autocorrelation coefficients; SD, standard deviation; TIR, time in range.
CGMTSA focuses on using time series methods to dissect temporal characteristics embedded in CGM data. As shown in Table 1, based on time series methods, the new functions in CGMTSA, including imputation, outlier detection, autocorrelation coefficients (ACF) and partial autocorrelation coefficients (PACF) calculation, three-dimensional plot, and decomposition plot, compare with existing CGM software.
New Functions in Continuous Glucose Monitoring Time Series Data Analysis Compared with Existing Continuous Glucose Monitoring Software
ACF, autocorrelation coefficients; ADO, aggregate daily overlay; AGP, ambulatory glucose profile; CGM, continuous glucose monitoring; CGMTSA, Continuous Glucose Monitoring Time Series Data Analysis; PACF, partial autocorrelation coefficients.
CGMTSA can read original data from devices made by all major suppliers, which take different formats such as Abbott FreeStyle Libre, Dexcom G6, and Medtronic Ipro2. To tackle the challenge of missingness, three commonly used imputation methods were provided, including linear regression, autoregressive integrated moving average (ARIMA) model, and seasonally decomposed (SEADEC) missing value imputation model. Given that the seasonal component of CGM data could negatively influence the accuracy of imputation, ARIMA and SEADEC performs imputation on the deseasonalized series, which may achieve more accurate imputation than the linear regression (Moritz and Bartz-Beielstein, 2017; Moritz et al, 2015).
Similarly, ARIMA was also used in CGMTSA to identify additive outliers and innovational outliers in CGM data outliers, which often originate from mechanical pressure on the sensor or patient motion that could significantly bias data interpretation (Chen and Liu, 1993; Cryer and Chan, 2008; Facchinetti et al, 2016). To allow users to conveniently obtain the processed results, the “auto.arima” function with default parameters in the forecast package was used to automatically fit the optimal ARIMA model (Hyndman and Khandakar, 2008). The processed CGM data points will be labeled with these quality control flags (Supplementary Fig. S1).
METRICS CALCULATION
CGMTSA outputs commonly used glycemic metrics. The measures of blood glucose variability presented include standard deviation, coefficient of variation, mean of daily difference, time in range, and mean amplitude of glycemic excursion, which are recommended by international consensus on the use of CGM (Danne et al, 2017). CGMTSA also calculates low blood glucose index and high blood glucose index that are recommended to estimate the risk of hypoglycemia and hyperglycemia (Kovatchev et al, 1997).
For key time series parameters of ACF and PACF, CGMTSA outputs the first five sequential coefficients in ACF and PACF. By estimating correlations between current values of a time series and its lagged values, coefficients of ACF and PACF could be used to optimize the performance of time series regression models.
DATA VISUALIZATION
CGMTSA constructs an interactive three-dimensional plot of date, time and glucose level using R packages plotly (Fig. 1B and Supplementary Fig. S2) (Inc. and P.T. Collaborative Data Science, 2015). This will allow investigators direct visualizations of the day-to-day change in glucose levels at various time points, which could hardly be achieved in traditional two-dimensional plots.
To help validate the assumption of stationarity in a time series data set, CGMTSA calculates the statistics of augmented Dickey–Fuller test and plots ACF of ACF and PACF (Fig. 1C, Supplementary Figures S3, and S4).
To disentangle the complexity of CGM data, CGMTSA uses additive decomposition to plot the trend, seasonality, and residual components as interactive plots. The trend measures the change of blood glucose over sliding time windows (Fig. 1D and Supplementary Fig. S5). The seasonal component averages the detrended glucose values at certain time point across days to reflect the periodicity of glucose fluctuation (Fig. 1E and Supplementary Fig. S6). After removing the trend and seasonal background, the residual component plot could highlight random glycemic events such as those induced by medical or lifestyle interventions (Fig. 1F and Supplementary Fig. S7).
DISCUSSION AND CONCLUSIONS
We presented an open-source R package CGMTSA for more comprehensive analyses of time series data from all common CGM devices. With a focus on dissecting the temporal characteristics embedded in CGM data, specific functions for quality control, metrics calculation, and visualization were introduced to pave the way for novel downstream medical and biological investigations.
Given that more CGM products are increasingly available, CGMTSA will be continuously updated to support efficient data processing for those new CGM devices such as NutriSense and SIGNOS. The current version of CGMTSA utilized default parameters of “auto.arima” function to fit the optimal ARIMA model. Future updates with options to manually config the parameters selection would enable more accurate imputation and outlier detection. These updates will allow CGMTSA to serve a wider user group with high-quality CGM data as input to supervised and unsupervised learning in clinical and epidemiological studies. Although we have wrapped automated time series model fit and parameter selection functions in CGMTSA, it requires primary R knowledge for nonprogrammers to use CGMTSA. Installation of CGMTSA can be done with two R commands in the GitHub page. However, current unavailability of CGMSTA on Comprehensive R Archive Network (CRAN) may increase the difficulty of installation.
In summary, compared with other CGM software that focuses on amplitude and fluctuations of glucose, CGMTSA focuses on using time series methods to dissect temporal characteristics embedded in CGM data. Through time series methods, CGMTSA can derive more reliable data sets that would enable more robust statistical modeling and accurate risk predictions.
Footnotes
ACKNOWLEDGMENTS
We would like to thank all of the involved researchers for reading and commenting on the article.
AUTHORs' CONTRIBUTIONS
J.S. and K.Z. designed CGMTSA and contributed to the writing of the article. J.S. and Z.L. developed and implemented CGMTSA. B.W. tested and fixed bugs of CGMTSA. S.L, Z.N., and L.Y. provided lots of useful comments in this study. All authors approved the final version of the article.
AUTHOR DISCLOSURE STATEMENT
The authors declare they have no conflicting financial interests.
FUNDING INFORMATION
This study was supported by the National Key R&D Program of China under Grant Nos. 2018YFC2001003 and 2018YFC2001002.
References
Supplementary Material
Please find the following supplemental material available below.
For Open Access articles published under a Creative Commons License, all supplemental material carries the same license as the article it is associated with.
For non-Open Access articles published, all supplemental material carries a non-exclusive license, and permission requests for re-use of supplemental material or any part of supplemental material shall be sent directly to the copyright owner as specified in the copyright notice associated with the article.