
Abstract
Protein succinylation is a novel type of post-translational modification in recent decade years. It played an important role in biological structure and functions verified by experiments. However, it is time consuming and laborious for the wet experimental identification of succinylation sites. Traditional technology cannot adapt to the rapid growth of the biological sequence data sets. In this study, a new computational method named SuccSPred2.0 was proposed to identify succinylation sites in the protein sequences based on multifeature fusion and maximal information coefficient (MIC) method. SuccSPred2.0 was implemented based on a two-step strategy. At first, high-dimension features were reduced by linear discriminant analysis to prevent overfitting. Subsequently, MIC method was employed to select the important features binding classifiers to predict succinylation sites. From the compared experiments on 10-fold cross-validation and independent test data sets, SuccSPred2.0 obtained promising improvements. Comparative experiments showed that SuccSPred2.0 was superior to previous tools in identifying succinylation sites in the given proteins.
1. INTRODUCTION
Post-translational modifications (PTMs) are considered an important biological mechanism and studied extensively that impacts the diversified structures and functions of the proteome (Meng et al., 2018). Many researchers found that lysine succinylation was a novel widespread reversible protein PTM in the past few years (Huang et al., 2019). Lysine succinylation plays important roles in autophagy, mitochondrial metabolism, and gene expression. In the meantime, many human diseases are closely related to the dysregulation of lysine succinylation such as inflammation, neurodegenerative, and allergic dermatitis. (Ao et al., 2021). So, to better understand the mechanism of succinylation, it is urgent to develop accurate and efficient tools for identifying succinylation sites.
Studies have confirmed that protein succinylation modifications are ubiquitous in prokaryotes and eukaryotes. Succinylation was initially shown to occur at the active site of homoserine transsuccinylase. Docosahexaenoic acid can promote the succinylation of lysine residues and may have certain effects on the central nervous system. And succinic acid can also promote succinylation in Escherichia coli (Kawai et al., 2006). In mycobacterium tuberculosis, the processes of transcription, translation, stress response, and protein interaction are also related to succinylated proteins (Xie et al., 2015).
At present, mass spectrometry and high-throughput biotechnology have been widely used in the identification of PTM sites. However, due to the time-consuming and laborious traditional experimental methods, many rapid bioinformatics tools have emerged in recent years to predict succinylation sites in proteins, which makes up for the shortcomings of traditional technologies (Chen et al., 2019; Li et al., 2020). The first predictor SucPred identified succinylation sites using many feature descriptors and support vector machine (SVM) classifier (Zhao et al., 2015). iSuc-PseAAC combined the position-specific tendency of peptides into a general form of pseudo amino acid composition (Pse-AAC) (Xu et al., 2015b).
SuccFind employed sequence-derived features and evolutionary-derived information of sequence to predict the succinylation sites. Furthermore, a two-step feature selection strategy was used to further optimize the classification (Xu et al., 2015a). SuccinSite utilized three sequences encoding patterns to extract the properties combined with a random forest (RF) classifier to help understand the mechanism of lysine succinylation (Hasan et al., 2016). SuccinSite2.0 took the composition of profile-based amino acid and orthogonal binary features (Hasan et al., 2017). Position-specific scoring matrix (PSSM)-Suc introduced PSSM and evolutionary information of amino acids to identify succinylated sites (Dehzangi et al., 2017).
Success efficiently extracted the bigram features from the structural and evolutionary information of amino acids to predict succinylation sites (Lopez et al., 2018). SucStruct utilized structural features and k-nearest neighbors (KNNs) to deal with imbalance data set so as to improve prediction of succinylation sites (Lopez et al., 2017). The pSuc-Lys and iSuc-PseOpt predicted models were proposed by Jia. pSuc-Lys used Pse-AAC and ensemble RF method (Jia et al., 2016b). And, iSuc-PseOpt took advantage of sequence-coupling effects and the processing technique on imbalanced data set (Jia et al., 2016a).
SSEvol-Suc primarily utilized the information from the secondary structure and PSSM to predict succinylation sites using AdaBoost classifier. It obtained a better improvement than iSuc-PseAAC, iSuc-PseOpt, SuccinSite, and pSuc-Lys methods (Dehzangi et al., 2018). PSuccE utilized information gain to select the key features from the fused features, finally employed an ensemble SVM classifiers to predict lysine succinylation sites (Ning et al., 2018). GPSuc employed the Wilcoxon rank to select the key features (Hasan and Kurata 2018). HybridSucc integrated a hybrid-learning architecture, fused a deep neural network, and penalized logistic regression algorithms using 10 types of features (Ning et al., 2020).
DeepSuccinylSite utilized the embedding and one hot encoding to predict succinylation sites (Thapa et al., 2020). SSKM_Succ eliminated the redundant features in three kinds of sequence features using a two-step feature selection strategy (Ning et al., 2022). Incremental feature selection (IFS)-LightGBM combined the LightGBM and the IFS method to select the optimal features from the multiple information features (Zhang et al., 2020). iSuc-ChiDT employed chi-square statistical difference table encoding and improved the sensitivity and overall accuracy compared with other predictors (Zeng et al., 2022).
Although many of the mentioned methods achieve good performances in the prediction of succinylation sites, there is still a lot of room for improvement (Zhu et al., 2020). At first, it is necessary to explore effective feature extraction methods for protein sequences, because the quality of features will directly affect the predicting effect. Then, designing an effective dimensionality reduction method is very important to accurately identify succinylation sites, for example, feature selection strategies and ranking strategies. (Yang et al., 2021). In addition, experimental data sets and machine learning model framework also affect the effect of succinylation sites recognition. These issues are all very important and critical events.
2. METHODS
2.1. Data sets
The cross-validation data set is derived from dbPTM (Huang et al., 2016), which integrates open literature, public resources, and 11 PTM-related biological databases. All samples were lysine-centered sequence fragments extracted from 2599 protein sequences with a fixed window size of 21. The sample is considered positive if the lysine at the center of the sample has been experimentally proven to be succinylation site, and negative otherwise. In addition, the SMOTE algorithm is used to balance the number of positive and negative samples (Blagus and Lusa 2013).
Figure 1 shows the amino acid frequency distribution of positive and negative samples. It can be seen that lysine was the most enriched, whereas cysteine (C) and tryptophan (W) were the lowest. The frequencies of alanine (A), aspartate (D), glutamic acid (E), glycine (G), and lysine (K) in positive samples were higher than those in negative samples. The frequencies of cysteine (C), phenylalanine (F), histidine (H), methionine (M), and formaldehyde (N) in the positive samples were lower than those in the negative samples. The frequencies of isoleucine (I) are approximately equal in positive and negative samples.
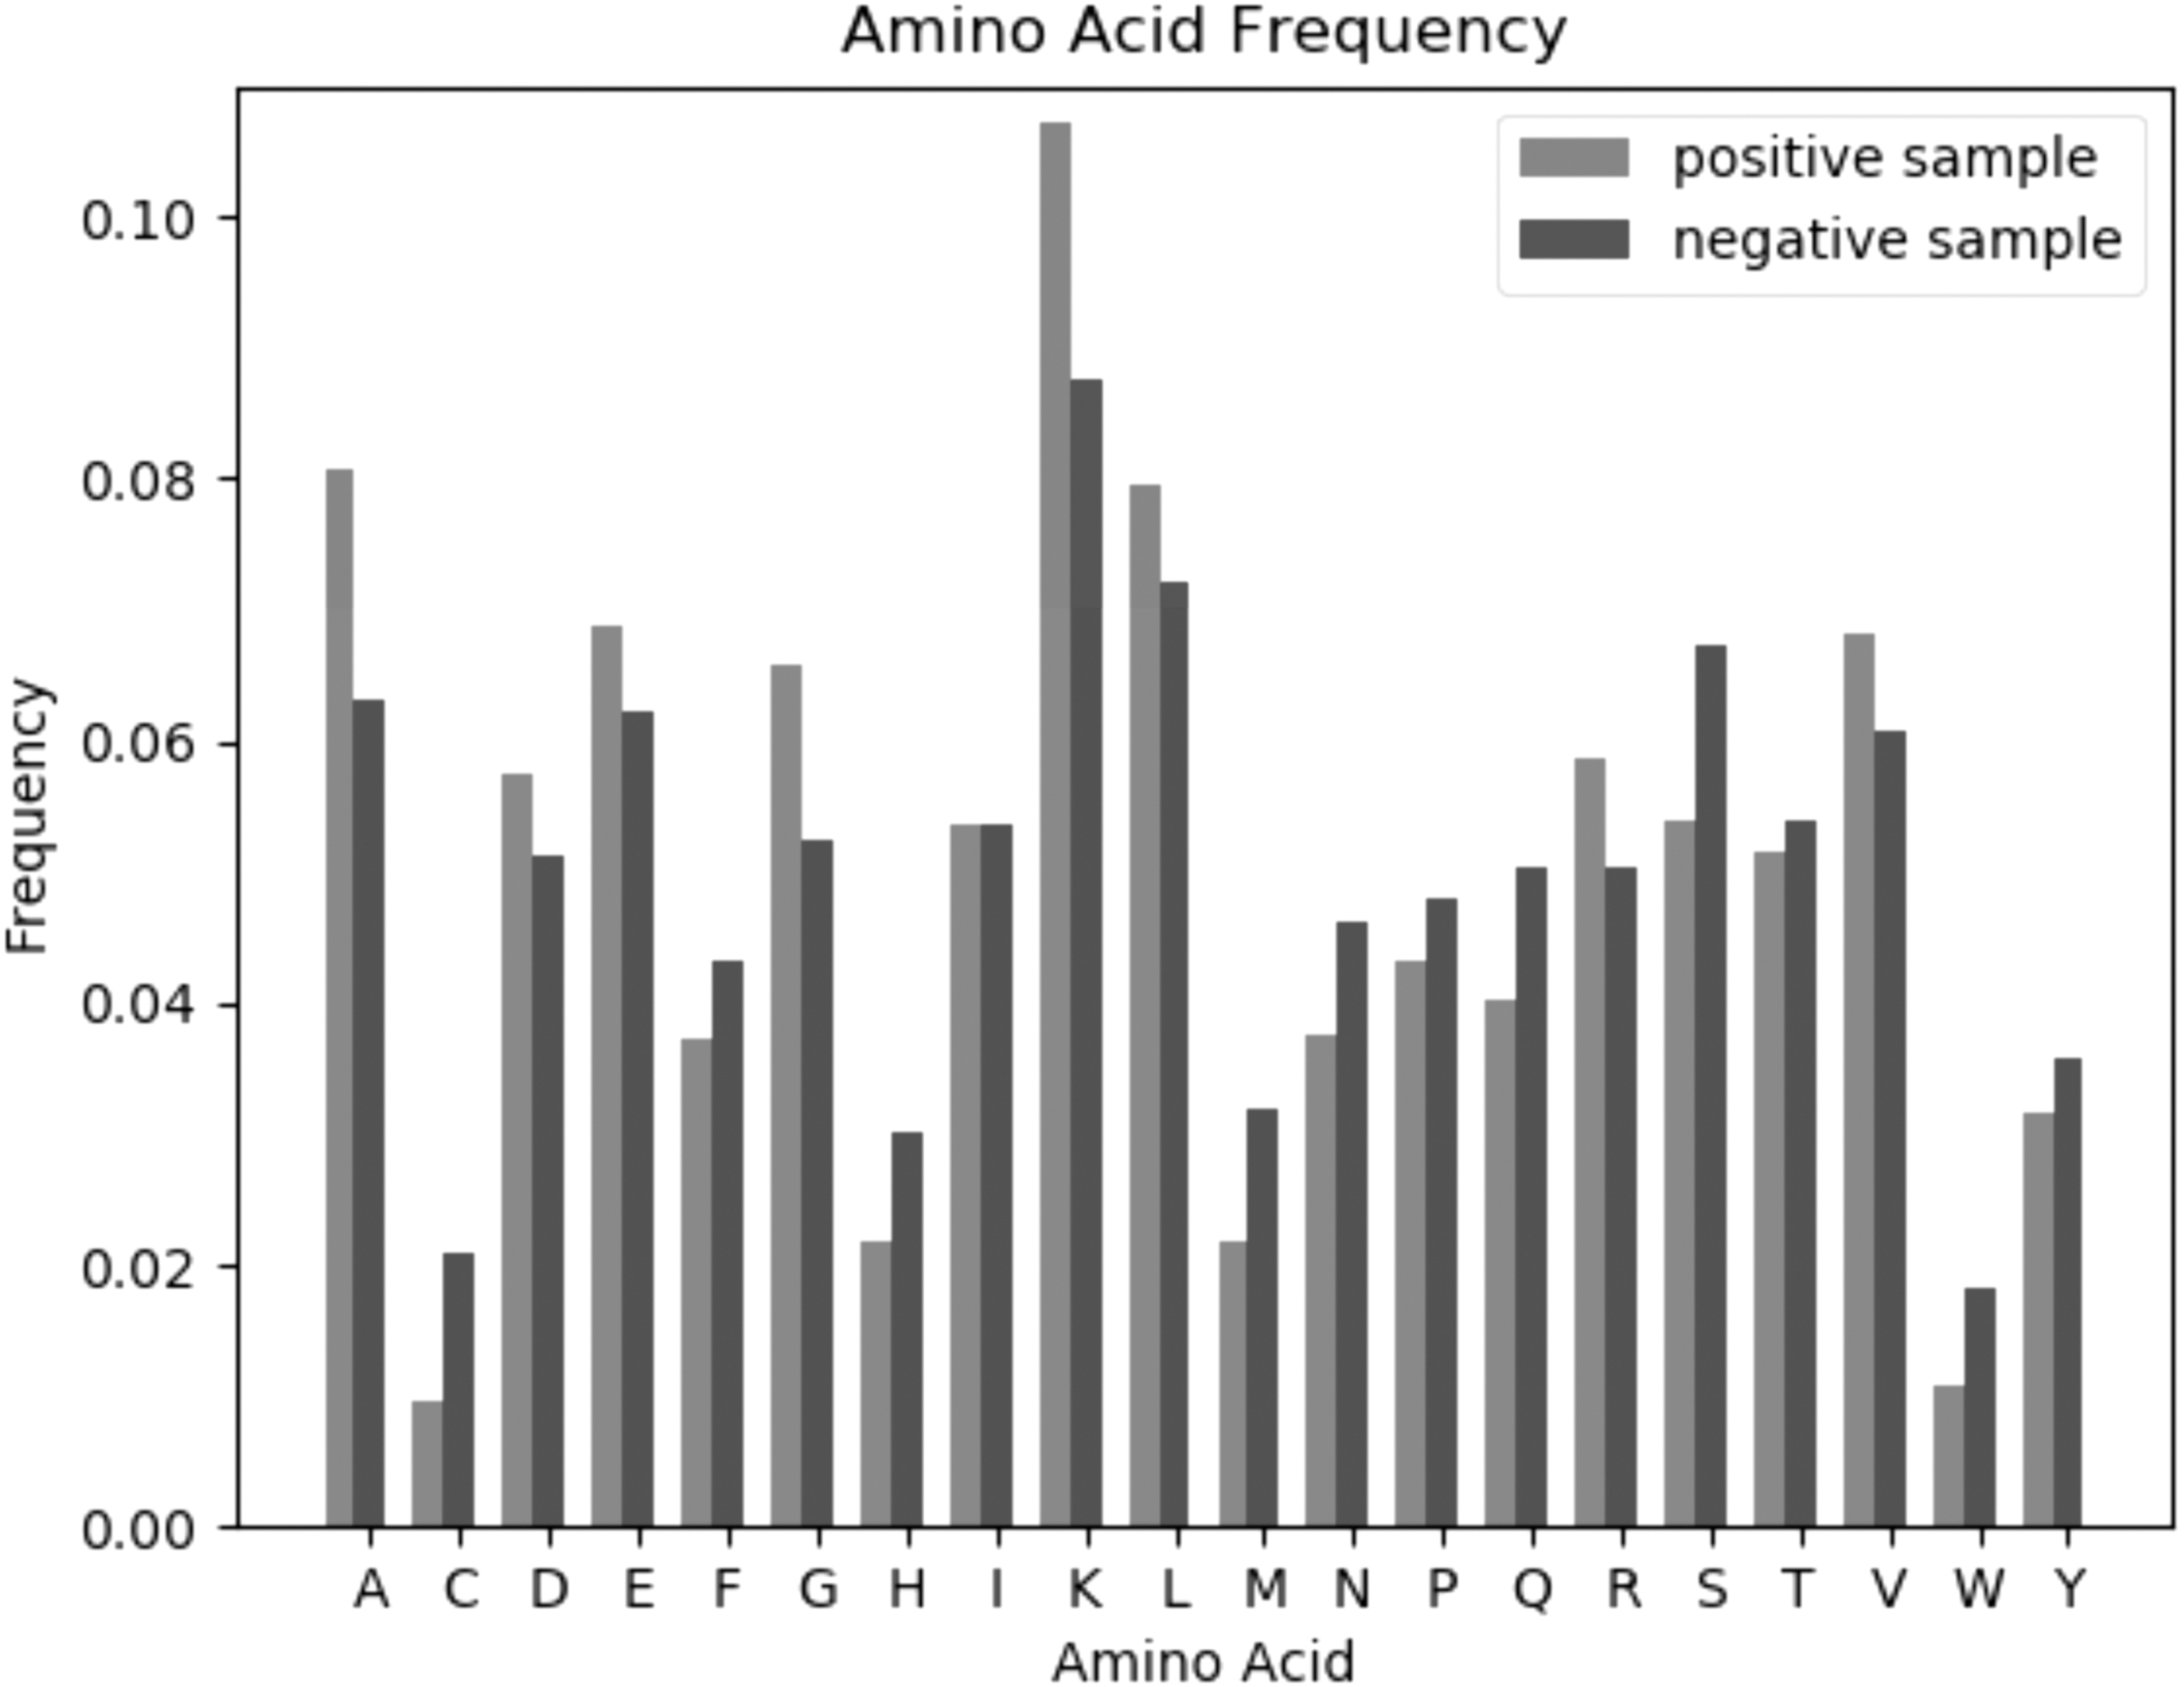
Amino acid frequency distribution of succinylation residues against nonsuccinylation residues in cross-validation data set. The medium-dark bar box represents the frequency of amino acids in positive samples and the dark bar box represents the frequency of amino acids in negative samples.
In Figure 2, we compare the differences between positive and negative samples by two-sample logo application (Vacic et al., 2006), which calculates and visualizes the differences between two sets of aligned samples of amino acids or nucleotides. At each position in the aligned groups of sequences, statistically significant amino acid symbols are plotted using the size of the symbol that is proportional to the difference between the two samples. As can be seen, some residues such as K, R, and A were enriched in the positive samples, whereas H, S, M, and Q frequently appeared in the negative samples. So location-based frequency coding may be an effective feature extraction method to identify lysine succinylation sites.
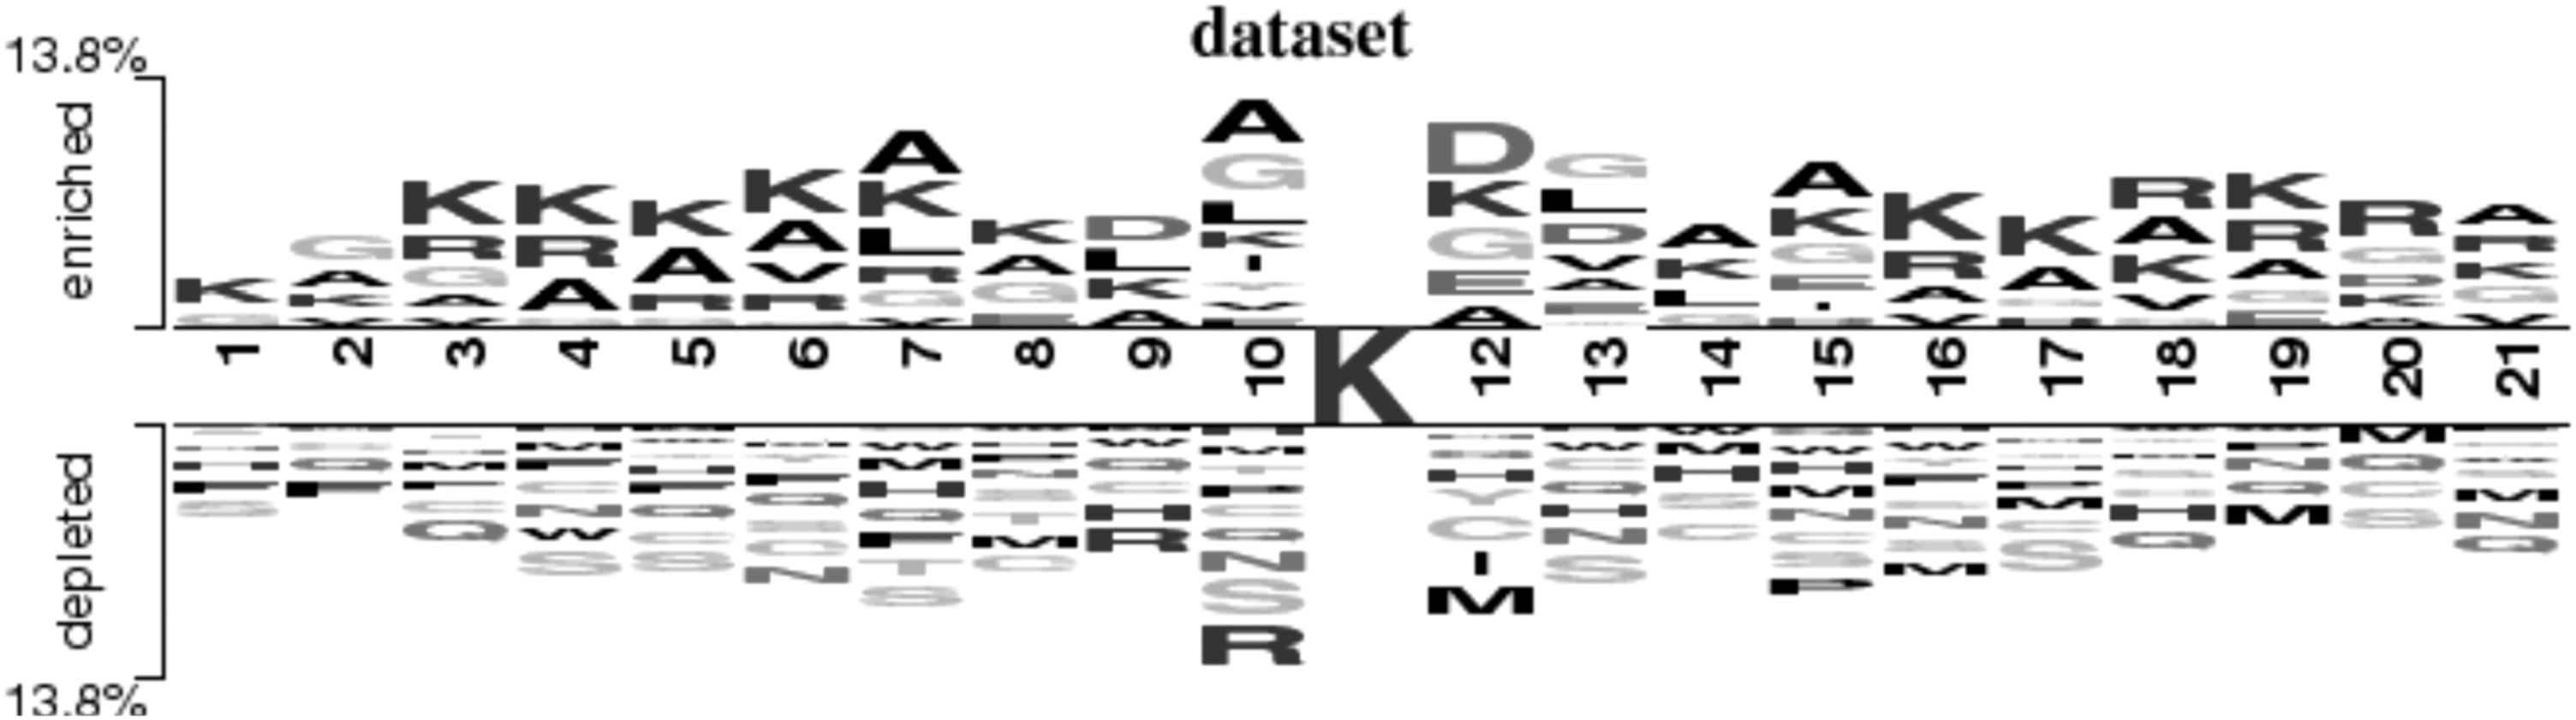
Two-sample logos of universal succinylation residues against nonsuccinylation residues. The upper side of the abscissa axis is the frequency of amino acids in positive samples, and the lower side is the frequency of amino acids in negative samples. The height of the letter indicates the frequency of amino acids.
Another data set was used in this study. The sequences in this data set were derived from the experimentally proven succinylated proteins in UniProtKB/Swiss-Prot and NCBI protein databases. To remove sequence redundancy, CD-HIT is used to ensure that the sequence similarity is not higher than 30%. A total of 2198 succinylated proteins were randomly selected in the obtained protein set to generate a training set, including 4479 positive samples (with succinylation sites) and 47,721 negative samples (without succinylation sites). The remaining 124 succinylated proteins were used to generate test set, including 239 positive samples and 2802 negative samples.
2.2. Feature representation
There are five superclasses of features used in this study, namely amino acid composition, Pse-AAC, autocorrelation features, profile-based features, and residue-level features. Specifically, amino acid compositions include Kmer (Basic k-mer), DR (distance-based residue), and distance pair (Pse-AAC of distance pairs and reduced alphabet scheme). Pse-AAC includes parallel correlation Pse-AAC (PC-PseAAC), series correlation Pse-AAC (SC-PseAAC), PC-PseAAC-general, and SC-PseAAC-general.
Autocorrelation features include AC (auto covariance), CC (cross covariance), ACC (auto-cross covariance), and PDT (physicochemical distance transformation). Profile-based features include top-n-gram, PDT-profile (profile-based physicochemical distance transformation), DT (distance-based top-n-gram), AC-PSSM (profile-based auto covariance), CC-PSSM (profile-based cross covariance), ACC-PSSM (profile-based auto-cross covariance), PSSM-DT (PSSM distance transformation), and PSSM-RT (PSSM relation transformation). Residue-level features include one-hot, one-hot (6-bit), binary 5-bit, BLOSUM62, PAM250, hydrophobicity matrix, Meiler parameters, Acthely factors, Miyazawa energies, Micheletti potentials, AESNN3, and ANN4D.
For each method, the forward and backward features are extracted severally when the length of residue is equal to 10, 12, 14, 16, and 18. And then the forward and the backward features are concatenated as the residue-level features. So there are 60 kinds of residue-level features using different feature extraction methods or residue length. In summary, we will get 79 kinds of features for each sample (Liu 2019).
2.3. Computational model
In this study, based on SuccSPred model, we propose a new model named SuccSPred2.0, which uses more feature extraction methods, and carries out linear discriminant analysis (LDA) transformation and feature selection for these features, to further improve the performance of predicting succinylation sites. As shown in Figure 3, 79 feature extraction methods are adopted for each sample in the data set. Subsequently, LDA is used to reduce the dimension of the feature vectors obtained by each feature extraction method. Then maximal information coefficient (MIC) method is used to filter out redundant features (Ge et al., 2016).
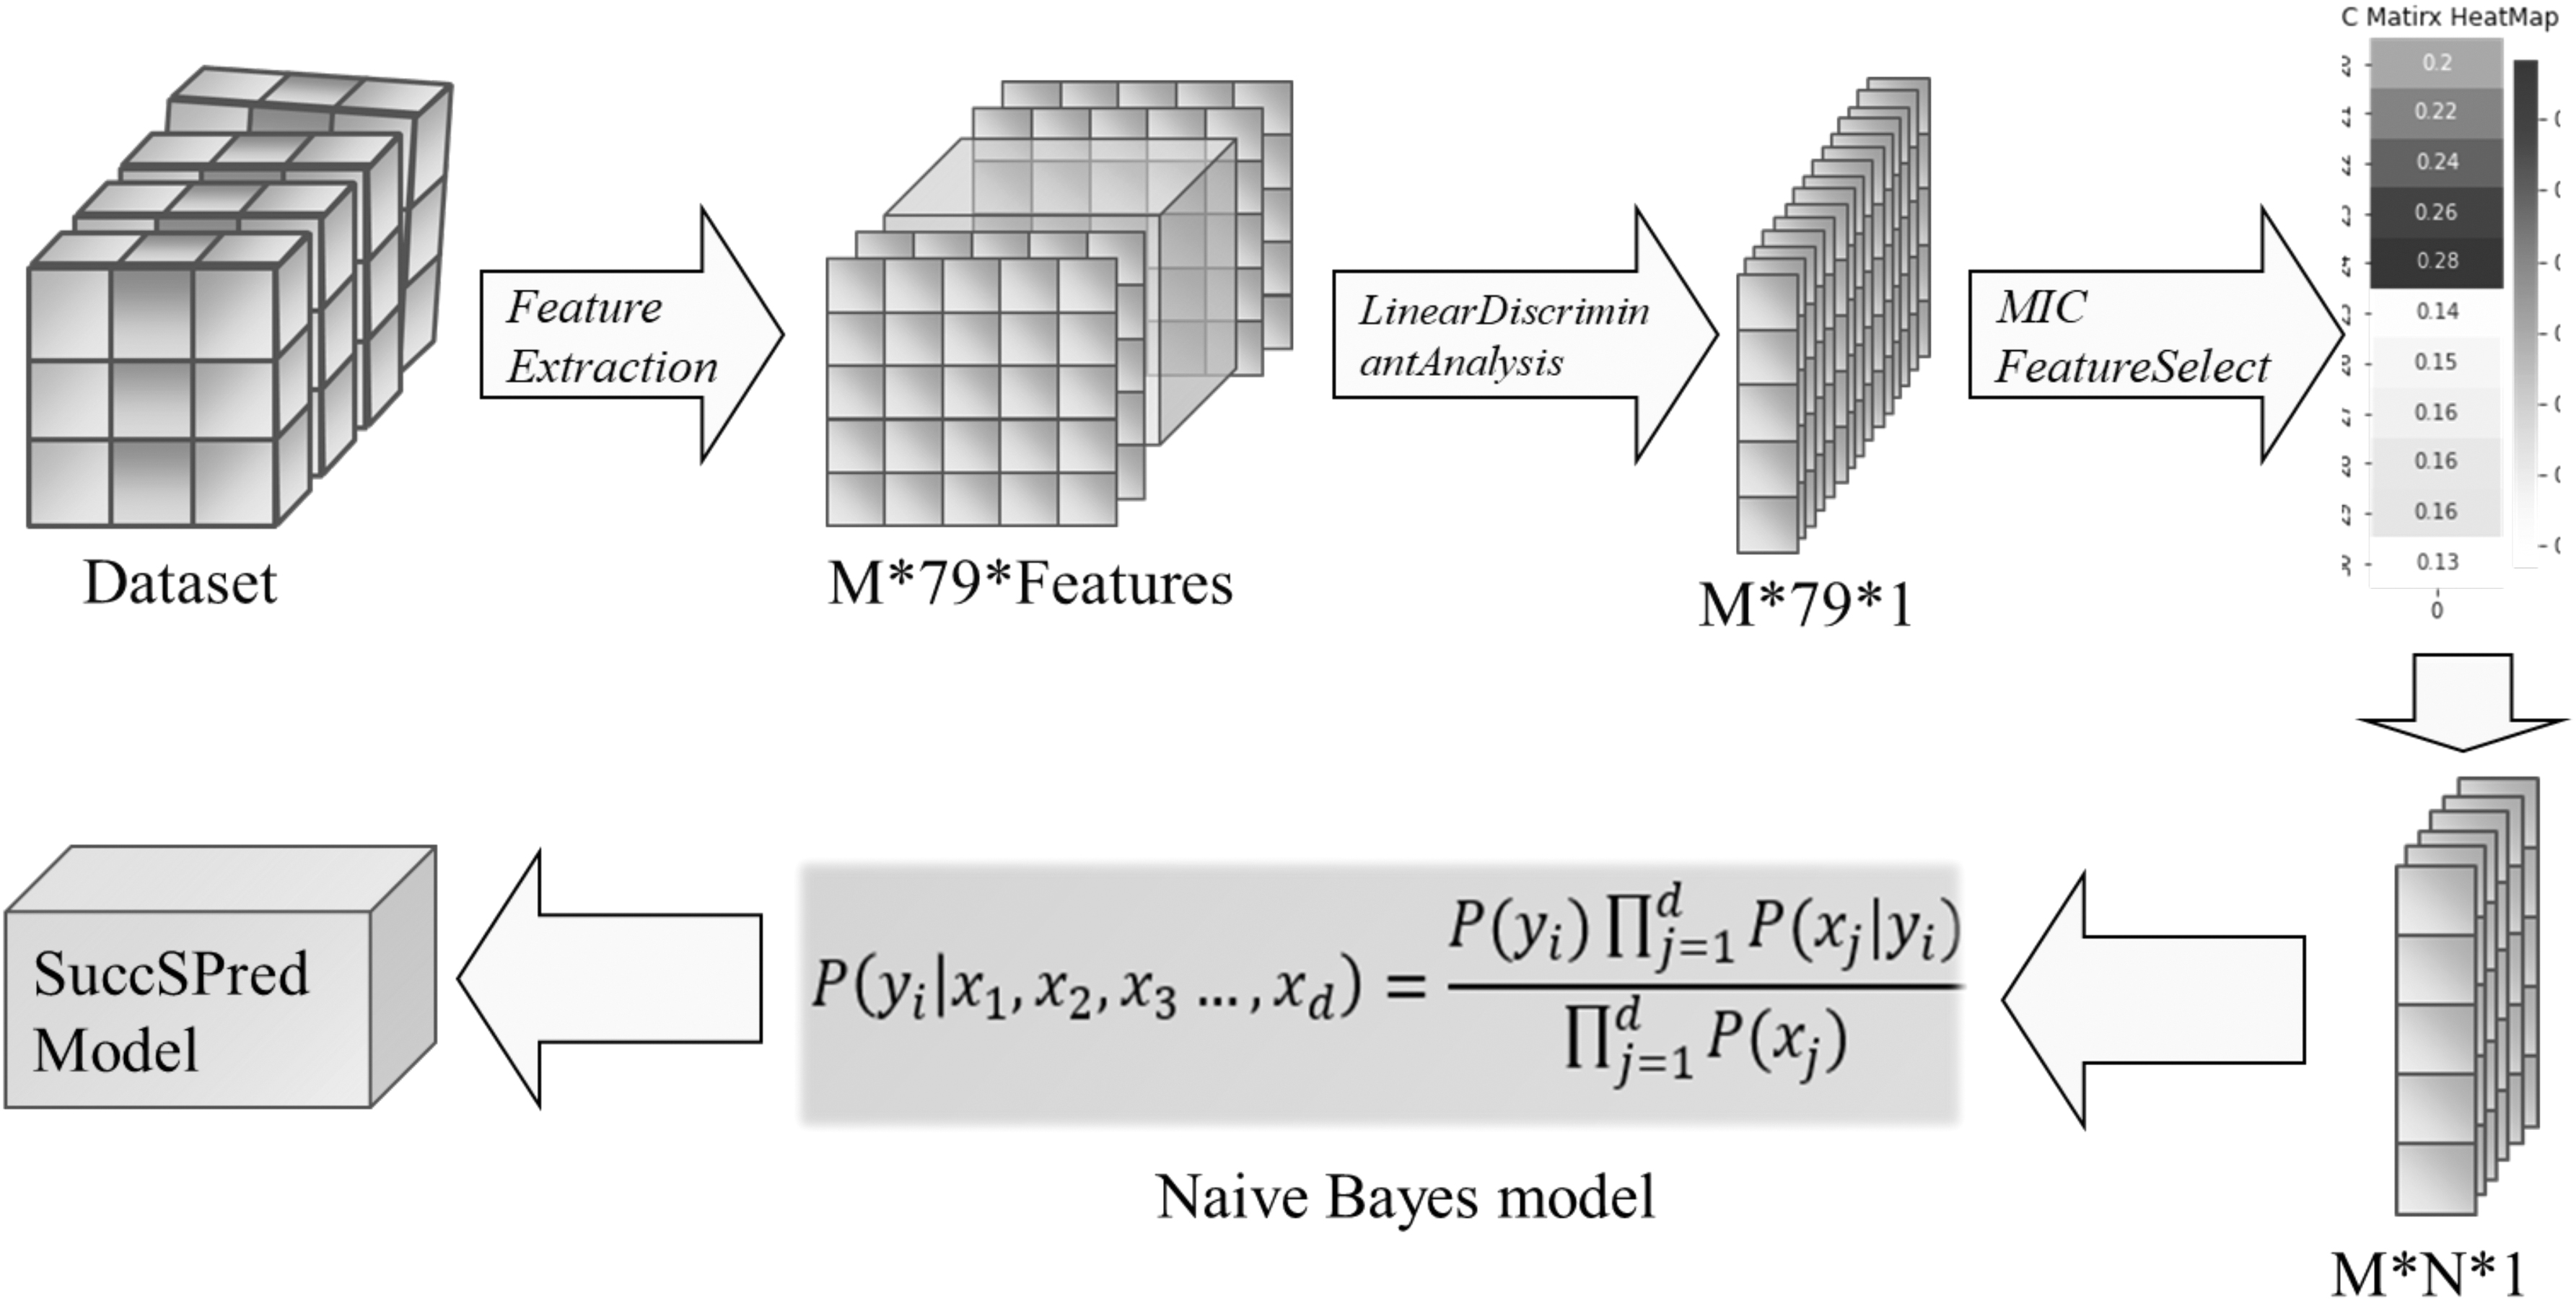
A framework of SuccSPred2.0 model. The features are generated from the protein sequences through 79 feature extraction methods, and then LDAs are carried out to obtain 79 new features separately. Then feature selection method is used with MIC method, and the selected features are put into Bayes classifier for training to obtain the final model. LDA, linear discriminant analysis; MIC, maximal information coefficient.
Finally, different classifiers are constructed in the optimized feature space. Experiments show that the feature sets obtained by the above feature extraction and optimization methods can achieve good classification performance even with simple naive Bayes (NB) model. Cross-validation experiments and independent test experiments on two data sets show that the proposed model performs better than other existing methods. SuccSPred2.0 model is an effective tool for predicting succinylation sites in protein sequences, whose code is freely available at (https://github.com/greyspring/SuccSPred2.0).
2.4. Performance evaluation
There are four outputs for a binary classification system, namely true positive (TP), true negative (TN), false positive (FP), and false negative (FN), from which we can get five evaluation metrics for the classification system as follows:
Accuracy (Acc) measures the proportion of instances that are correctly predicted. Sensitivity (Sn), also known as recall, measures the proportion of positives that are correctly predicted. Specificity (Sp) measures the proportion of negatives that are correctly predicted. F1-score is defined as the harmonic mean of the model's precision and recall. Matthews correlation coefficient (MCC) takes into account TP and FP and negatives and is generally regarded as a balanced measure that can be used even if the distribution is very unbalanced between positives and negatives (Boughorbel et al., 2017). It has a range of −1 to 1 where −1 indicates a totally wrong prediction, whereas 1 indicates a perfect prediction.
3. RESULTS AND DISCUSSION
3.1. Cross-validation experiment
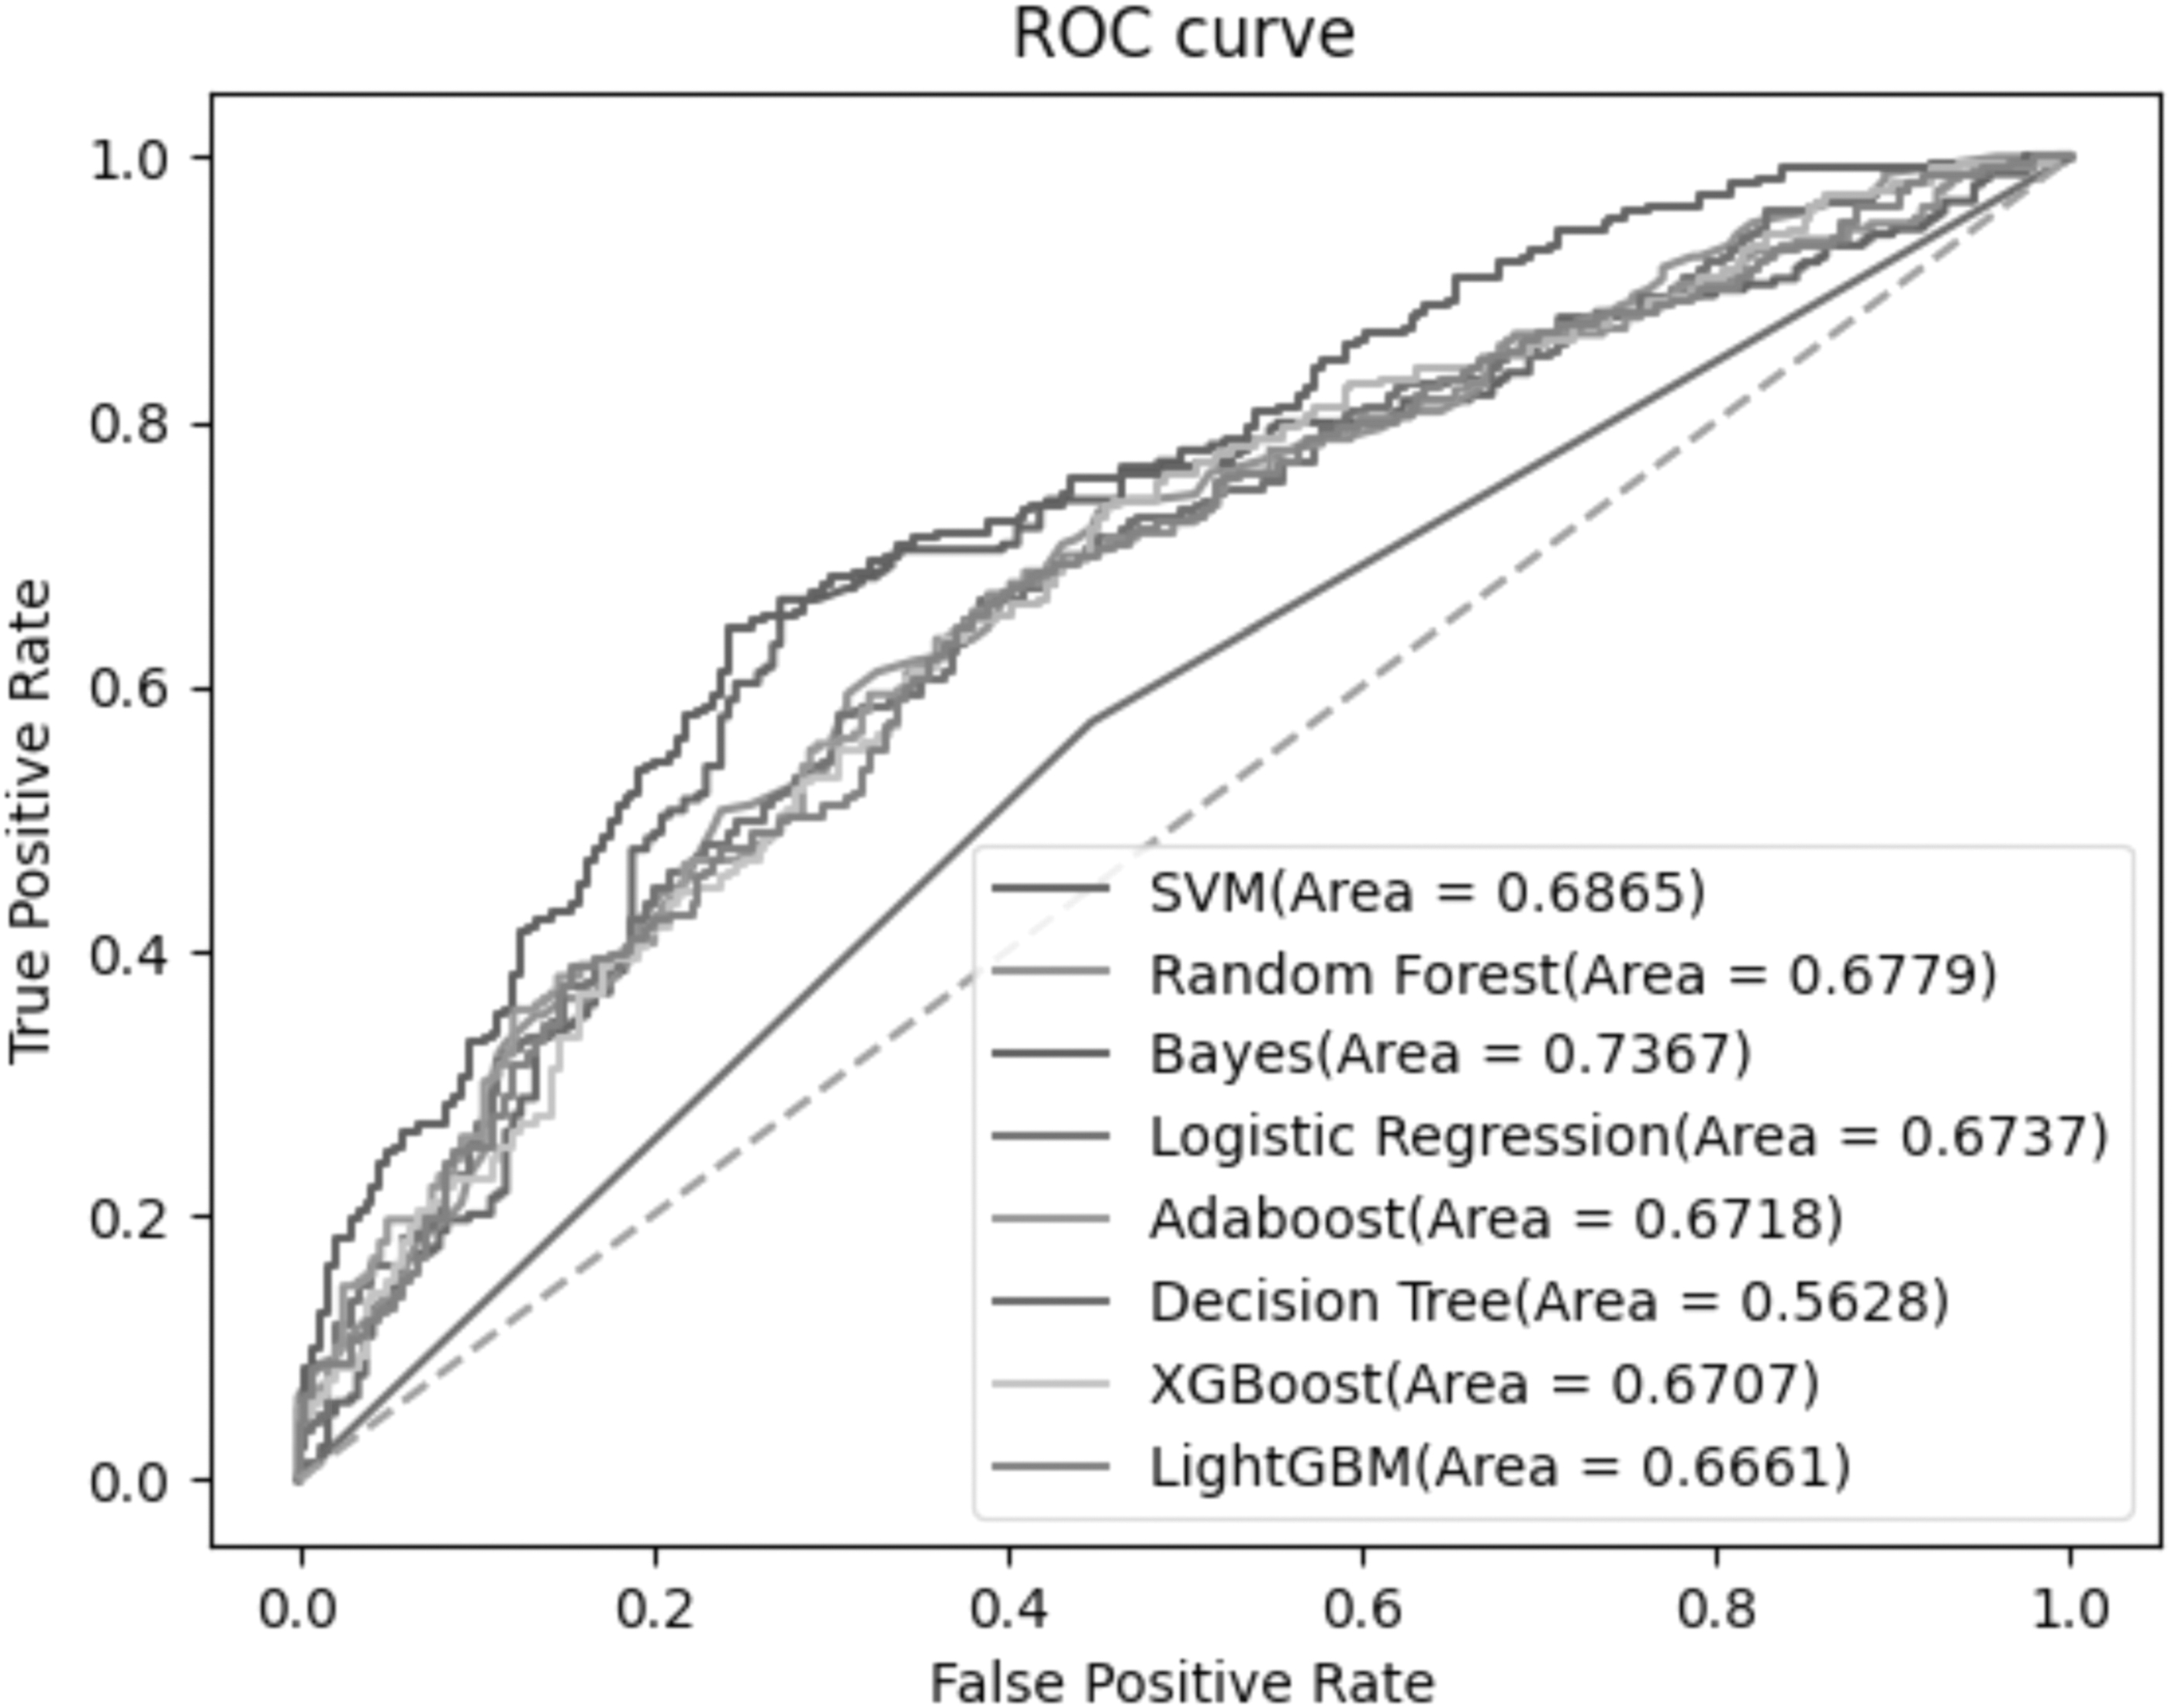
The Bayes classifier has the highest accuracy in 10-fold cross-validation, and the receiver operating characteristics (ROC) curve is shown in Figure 4. The 10-fold cross-validation used SVM, RF, Bayes, logistic regression, AdaBoost, decision tree, XGBoost, and LightGBM, and the area under the curve (AUC) was 0.8225, 0.8624, 0.8733, 0.8528, 0.8631, 0.7182, 0.8467, and 0.8484 respectively. These AUC values demonstrated that compared with the other seven classifiers, Bayesian classifier showed best and decision tree showed worst.

ROC curves comparison of multiple types of classifiers. The AUC value represents the area under the ROC curve. AUC, area under the curve; ROC, receiver operating characteristics; SVM, support vector machine.
Through 10 cross-validation, the average and standard deviation of the maximum accuracy of 8 classifiers were analyzed statistically on the basis of 30 times experiments. Table 1 gives the results of the SuccSPred2.0 model using the different classifiers and 10-fold cross-validation in terms of average accuracy, AUC, sensitivity, specificity, MCC, and F1-score. Judging from Table 1, Bayes and RF classifiers performed better than the other six classifiers. But XGBoost and decision tree classifiers achieved relatively poor performances. In particular, the results of decision tree classifier were lower than those of other seven classifiers under the five evaluation indexes.
The Average and Standard Deviation of the Maximum Accuracy of Different Classifiers in 10-Fold Cross-Validation
Bold values represent the best results.
Acc, accuracy; LightGBM; MCC, Matthews correlation coefficient; Sn, sensitivity; Sp, specificity; SVM, support vector machine; XGBoost.
Moreover, SuccSPred2.0 was also compared with several current popular prediction models, such as IFS-LightGBM, RF (Bureau et al., 2005), ExtraTree (Maree et al., 2007), gradient boosting decision tree (Zhou et al., 2017), KNN (Sivaraj et al., 2020), XGBoost (Yu et al., 2020), and NB (Aydin et al., 2011). The same succinylation data in dbPTM are compared and analyzed by 10-fold cross-validation. And the experimental performances were evaluated by four evaluation indicators: accuracy (Acc), sensitivity (Sn), MCC, and F1-score.
Compared with other methods, SuccSPred2.0 showed better on all four indicators, as given in Table 2. The accuracy, sensitivity, MCCs, and F1-score of the SuccSPred2.0 model were 0.7676, 0.7557, 0.5350, and 0.7645, respectively. Compared with IFS-LightGBM model with the best performances in other seven methods, SuccSPred2.0 improved the accuracy, sensitivity, MCC, and F1-score by 3.16%, 3.34%, 6.42%, and 4.13%, respectively. In addition, the number of the selected features was almost minimal in eight classifiers.
Performance Comparison of SuccSPred2.0 with Other Existing Methods
Bold values represent the best results.
ET, ExtraTree; GBDT, gradient boosting decision tree; IFS, incremental feature selection; KNN, k-nearest neighbors; NB, naive Bayes; RF, random forest.
3.2. Independent test experiment
As shown in Figure 5, on the independent test data set, Bayes also achieved the best AUC value, reaching 0.7367, which is 0.0502 higher than the second SVM. It can also be clearly seen from the figure that the ROC curve of Bayes is far closer to the upper left than other classifiers.
ROC curves of multiple classifiers on independent test data set.
To better demonstrate the performance of the model, SuccSPred2.0 model is compared with the current method using the same data set. The sensitivity, specificity, and MCC of different methods were compared. As given in Table 3, SuccSPred2.0 has achieved the first in sensitivity and MCC, especially in sensitivity, which is 0.21 higher than the second GPSuc.
Comparison of SuccSPred2.0 with Existing Predictors Using an Independent Test Data Set
The highest value in each category is shown in bold.
GPSuc; iSuc-ChiDT; iSuc-PseAAC; iSuc-PseOpt; PSuccE; pSuc-Lys.
On the independent test data set, by calculating MIC, the number of features larger than the threshold is 13, and the number of features is not so large. But it obtains good results, which shows that SuccSPred2.0 can achieve good performance in the independent test data set. The t-distributed stochastic neighbor embedding method was used to visualize the results of independent training and test as shown in Figure 6.
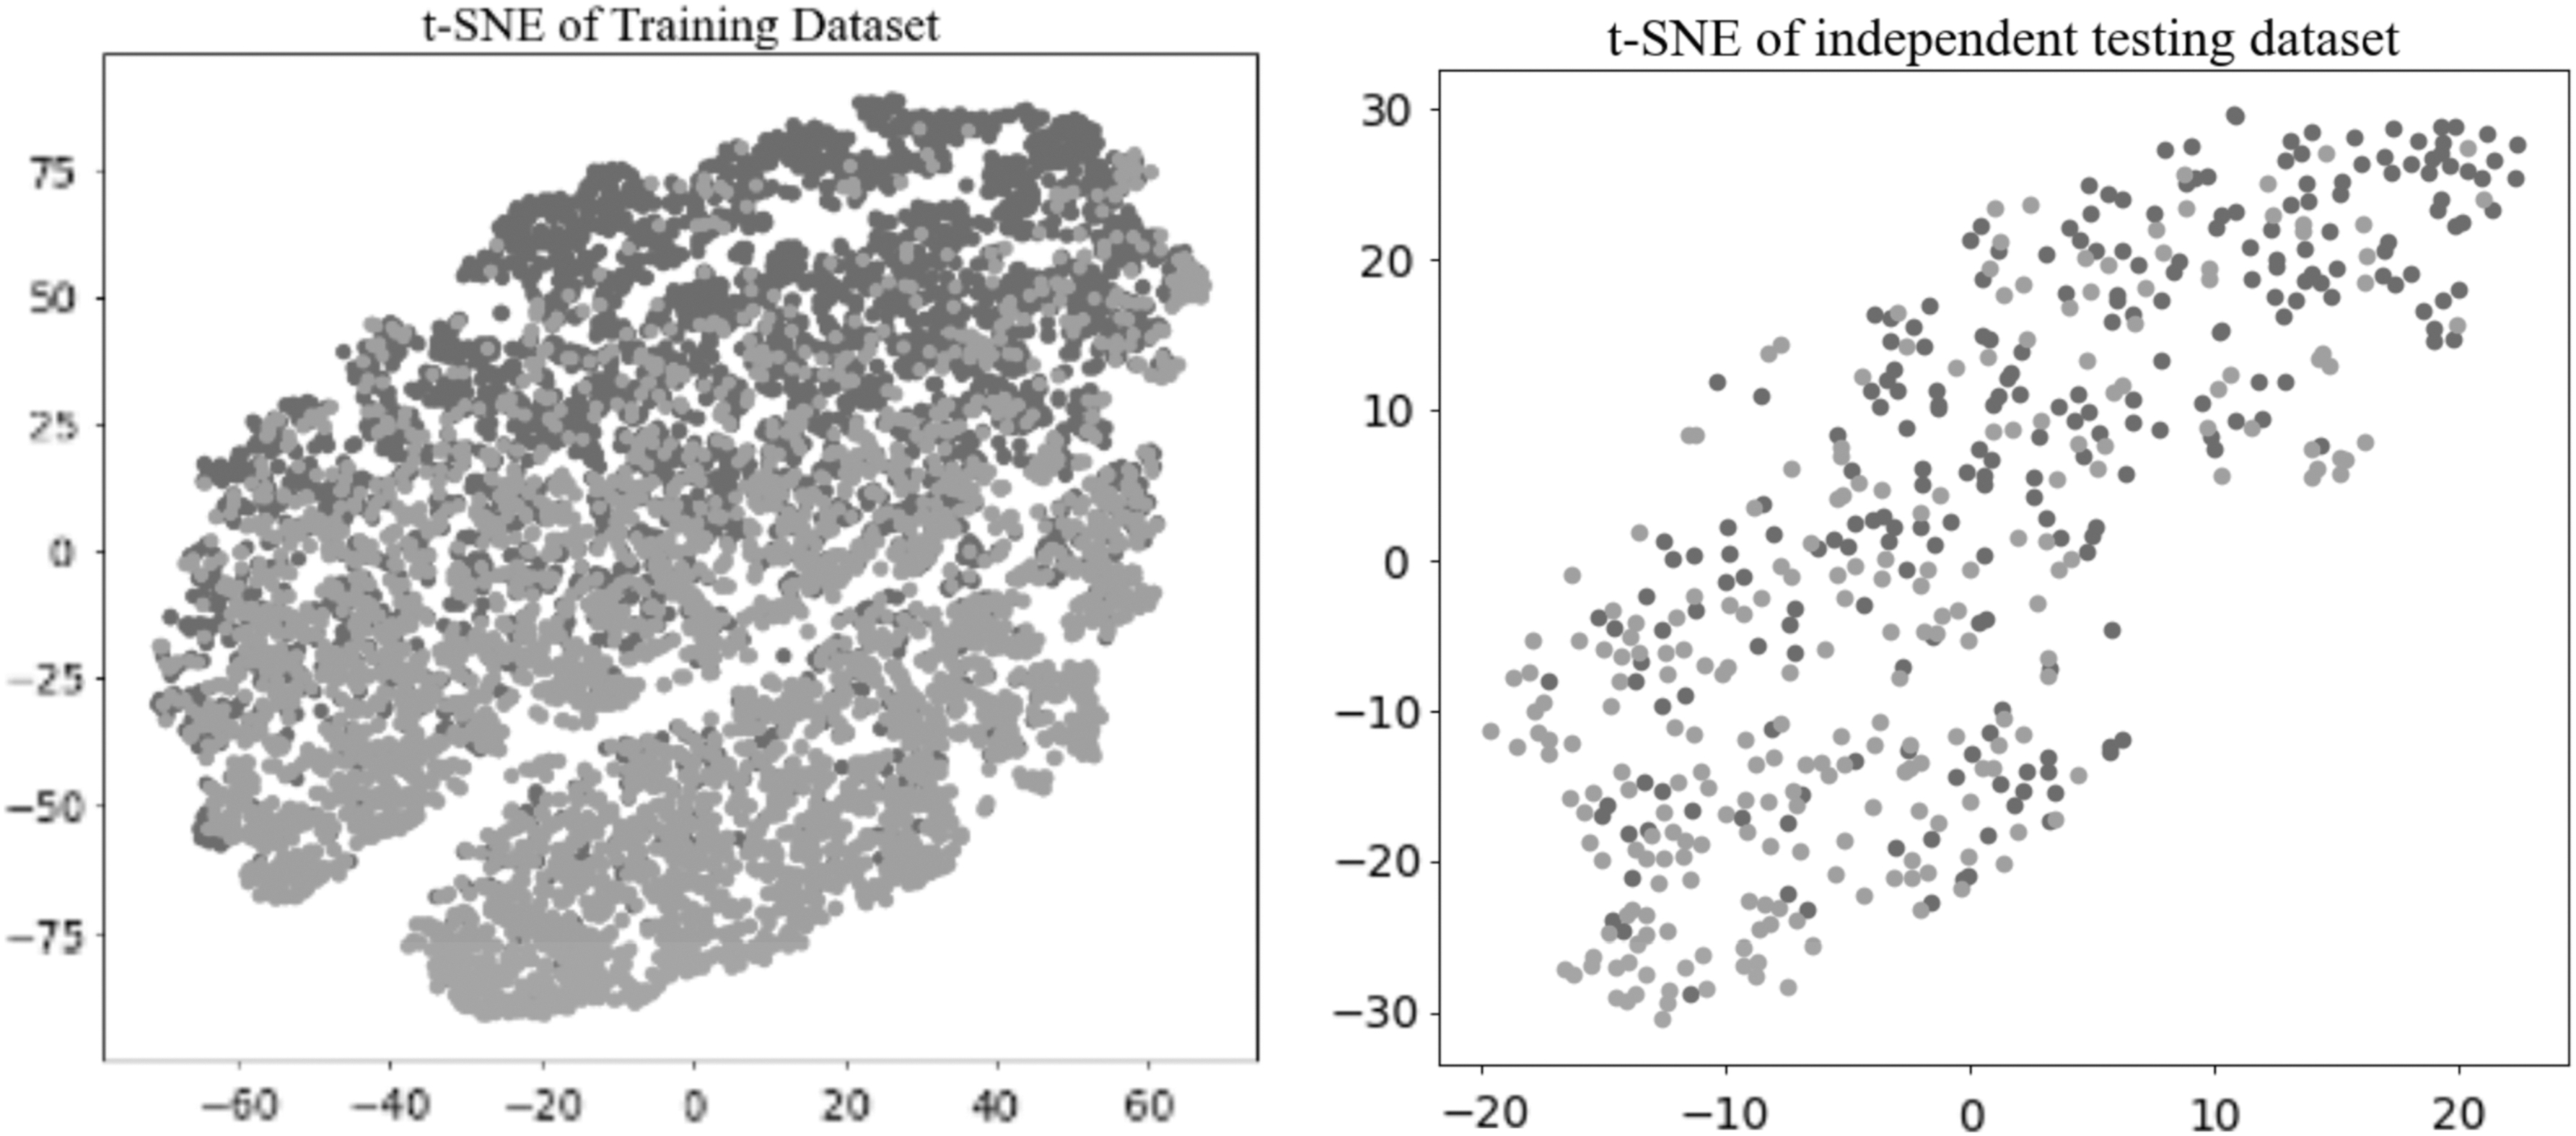
t-SNE in independent training and testing data set. t-SNE, t-distributed stochastic neighbor embedding.
4. CONCLUSIONS
In this study, a novel method named SuccSPred2.0 was proposed to predict lysine succinylation sites in protein sequences. It fused 79 kinds of extracted feature encoding methods on the basis of amino acid composition, autocorrelation, Pse-AAC, profile-based features, and residue-level features. The best feature representations using MIC were explored using feature selection technique after using LDA to reduce the feature dimension. Compared with other existing methods, SuccSPred2.0 can obtain relatively stable and high performance by using Bayes classifier, which was shown in the experimental results based on multiple classifiers.
Nevertheless, the advantages of SuccSPred2.0 are not obvious on the whole, although relatively good results have been achieved. To alleviate the difficulty of obtaining high-quality data, we will further explore the optimization of classifiers and the flexible application of feature selection technology in the future. In addition, with the development of high-throughput sequencing technology, deep learning techniques can also solve the problem of various site predictions better. With the development of proteomic research technology, the regulatory mechanisms of succinylation in normal physiological processes and pathological mechanisms will be revealed by these new methods. Succinylation may become the target of new drugs to provide new ideas for treating diseases.
Footnotes
ACKNOWLEDGMENTS
We greatly appreciate the two anonymous reviewers for their helpful comments in ISBRA 2021.
AUTHOR DISCLOSURE STATEMENT
The authors declare they have no conflicting financial interests.
FUNDING INFORMATION
This research was supported in part by the Zhejiang Provincial Natural Science Foundation of China (Grant No. LY21F020017) and Zhejiang Provincial Science and Technology Program in China (Grant No. 2021C01108), National Natural Science Foundation of China (Grant No. 61702146, 61841104), National key research and development program of China (Grant No.2019YFC0118404), Joint Funds of the Zhejiang Provincial Natural Science Foundation of China (Grant No. U20A20386).