
Abstract
Phage virion proteins (PVPs) play an important role in the host cell. Fast and accurate identification of PVPs is beneficial for the discovery and development of related drugs. Although wet experimental approaches are the first choice to identify PVPs, they are costly and time-consuming. Thus, researchers have turned their attention to computational models, which can speed up related studies. Therefore, we proposed a novel machine-learning model to identify PVPs in the current study. First, 50 different types of physicochemical properties were used to denote protein sequences. Next, two different approaches, including Pearson's correlation coefficient (PCC) and maximal information coefficient (MIC), were employed to extract discriminative information. Further, to capture the high-order correlation information, we used PCC and MIC once again. After that, we adopted the least absolute shrinkage and selection operator algorithm to select the optimal feature subset. Finally, these chosen features were fed into a support vector machine to discriminate PVPs from phage non-virion proteins. We performed experiments on two different datasets to validate the effectiveness of our proposed method. Experimental results showed a significant improvement in performance compared with state-of-the-art approaches. It indicates that the proposed computational model may become a powerful predictor in identifying PVPs.
INTRODUCTION
The phage is a group of viruses that can infect and replicate within bacteria. A recent study reported that phage may become an appropriate alternative to traditional drugs due to its safety and effectiveness in living organisms (Lyon, 2017). Phage proteins are an important target for pharmaceutical research in the discovery of new drug (Sorokulova et al., 2014).
Currently, mass spectrometry is a common method used to identify phage virion proteins (PVPs) (Lavigne et al., 2009). However, this experiment-based method is expensive, time-consuming, and labor-intensive. Therefore, with the fast proliferation of protein sequences in the post-genome age, there is an urgent demand to exploit automated approaches for fast and reliable identification of PVPs.
In recent years, much effort has been devoted to predict PVPs using machine-learning models. In 2013, Feng et al. (2013) proposed the first computational model to identify PVPs. The model employed amino acid composition (AAC) and dipeptide composition (DC) to represent protein sequences. A filter approach correlation-based feature selection combining a best-first search strategy was applied to reduce the influence of redundant and noisy information. Naïve Bayes was used as the classifier to discriminate PVPs from phage non-virion proteins (non-PVPs).
This model achieved a classification accuracy of 79.15% based on the jackknife test. One year later, the same group proposed a new method to improve the classification performance. In the new model, sequences were first encoded by g-gap DC, and the analysis of variance (ANOVA) with incremental feature selection was employed to find the optimal feature subset.
Finally, support vector machine (SVM) was used to distinguish PVPs from non-PVPs. This predictor achieved a maximum accuracy of 85.02% in the jackknife test (Ding et al., 2014). Manavalan et al. (2018) constructed another predictor called PVP-SVM to explore this issue. In this predictor, five different feature descriptors were used to represent protein sequences, and a feature selection strategy was employed to select these optimal features.
Finally, SVM was used to predict PVPs. This predictor obtained classification accuracies of 87.9% and 79.8% on training and independent datasets, respectively. To further improve the classification performance, Arif and co-workers developed Pred-BVP-Unb to predict PVPs (Arif et al., 2020). In their predictor, three features, including composition and translation, split AAC, and bi-profile position specific scoring matrix, were used to describe protein sequences.
A synthetic minority oversampling technique was adopted to address the imbalanced data issue, and a feature selection approach was used to choose these optimal features. These selected features were provided to an SVM classifier to identify PVPs. This predictor achieved classification accuracies of 92.54% and 83.06% on the benchmark and independent datasets, respectively.
Charoenkwan and colleagues developed a sequence-based predictor named Meta-iPVP to investigate this problem (Charoenkwan et al., 2020c). First, seven different feature encodings were employed to denote protein sequences. The GA-SAR approach coupled to the SVM model was used to rank the most effective features. These effective features were input into a classifier to distinguish PVPs from non-PVPs. The predictor achieved classification accuracies of 84.6% and 81.7% on the training and independent datasets, respectively.
Recently, Ahmad et al. (2022) proposed a new computational model called SCORPION to identify PVPs. The model employed 13 different kinds of features to encode sequences. A two-step feature selection approach was adopted to select the optimal features, and promising classification results were obtained by this predictor. In addition, some other related studies were reported in this field (Charoenkwan et al., 2020b; Meng et al., 2020; Pan et al., 2018; Zhang et al., 2015).
Although the aforementioned studies have advanced our understanding of PVPs, there is still great room for improvement in classification performance. Therefore, in this work, we propose a novel classification model to distinguish PVPs from non-PVPs. First, 50 different kinds of physicochemical (PC) properties were employed to encode protein sequences.
Two different approaches, that is, Pearson's correlation coefficient (PCC) and maximal information coefficient (MIC) (Reshef et al., 2011), were utilized to capture important interaction information between different PC properties. To capture more complex correlation information, PCC and MIC were used once again. The least absolute shrinkage and selection operator (LASSO) algorithm (Liu et al., 2009) was then adopted to remove irrelative and redundant features. Finally, these selected features were fed into an SVM for predicting PVPs from non-PVPs. Figure 1 presents the flowchart of the proposed method.
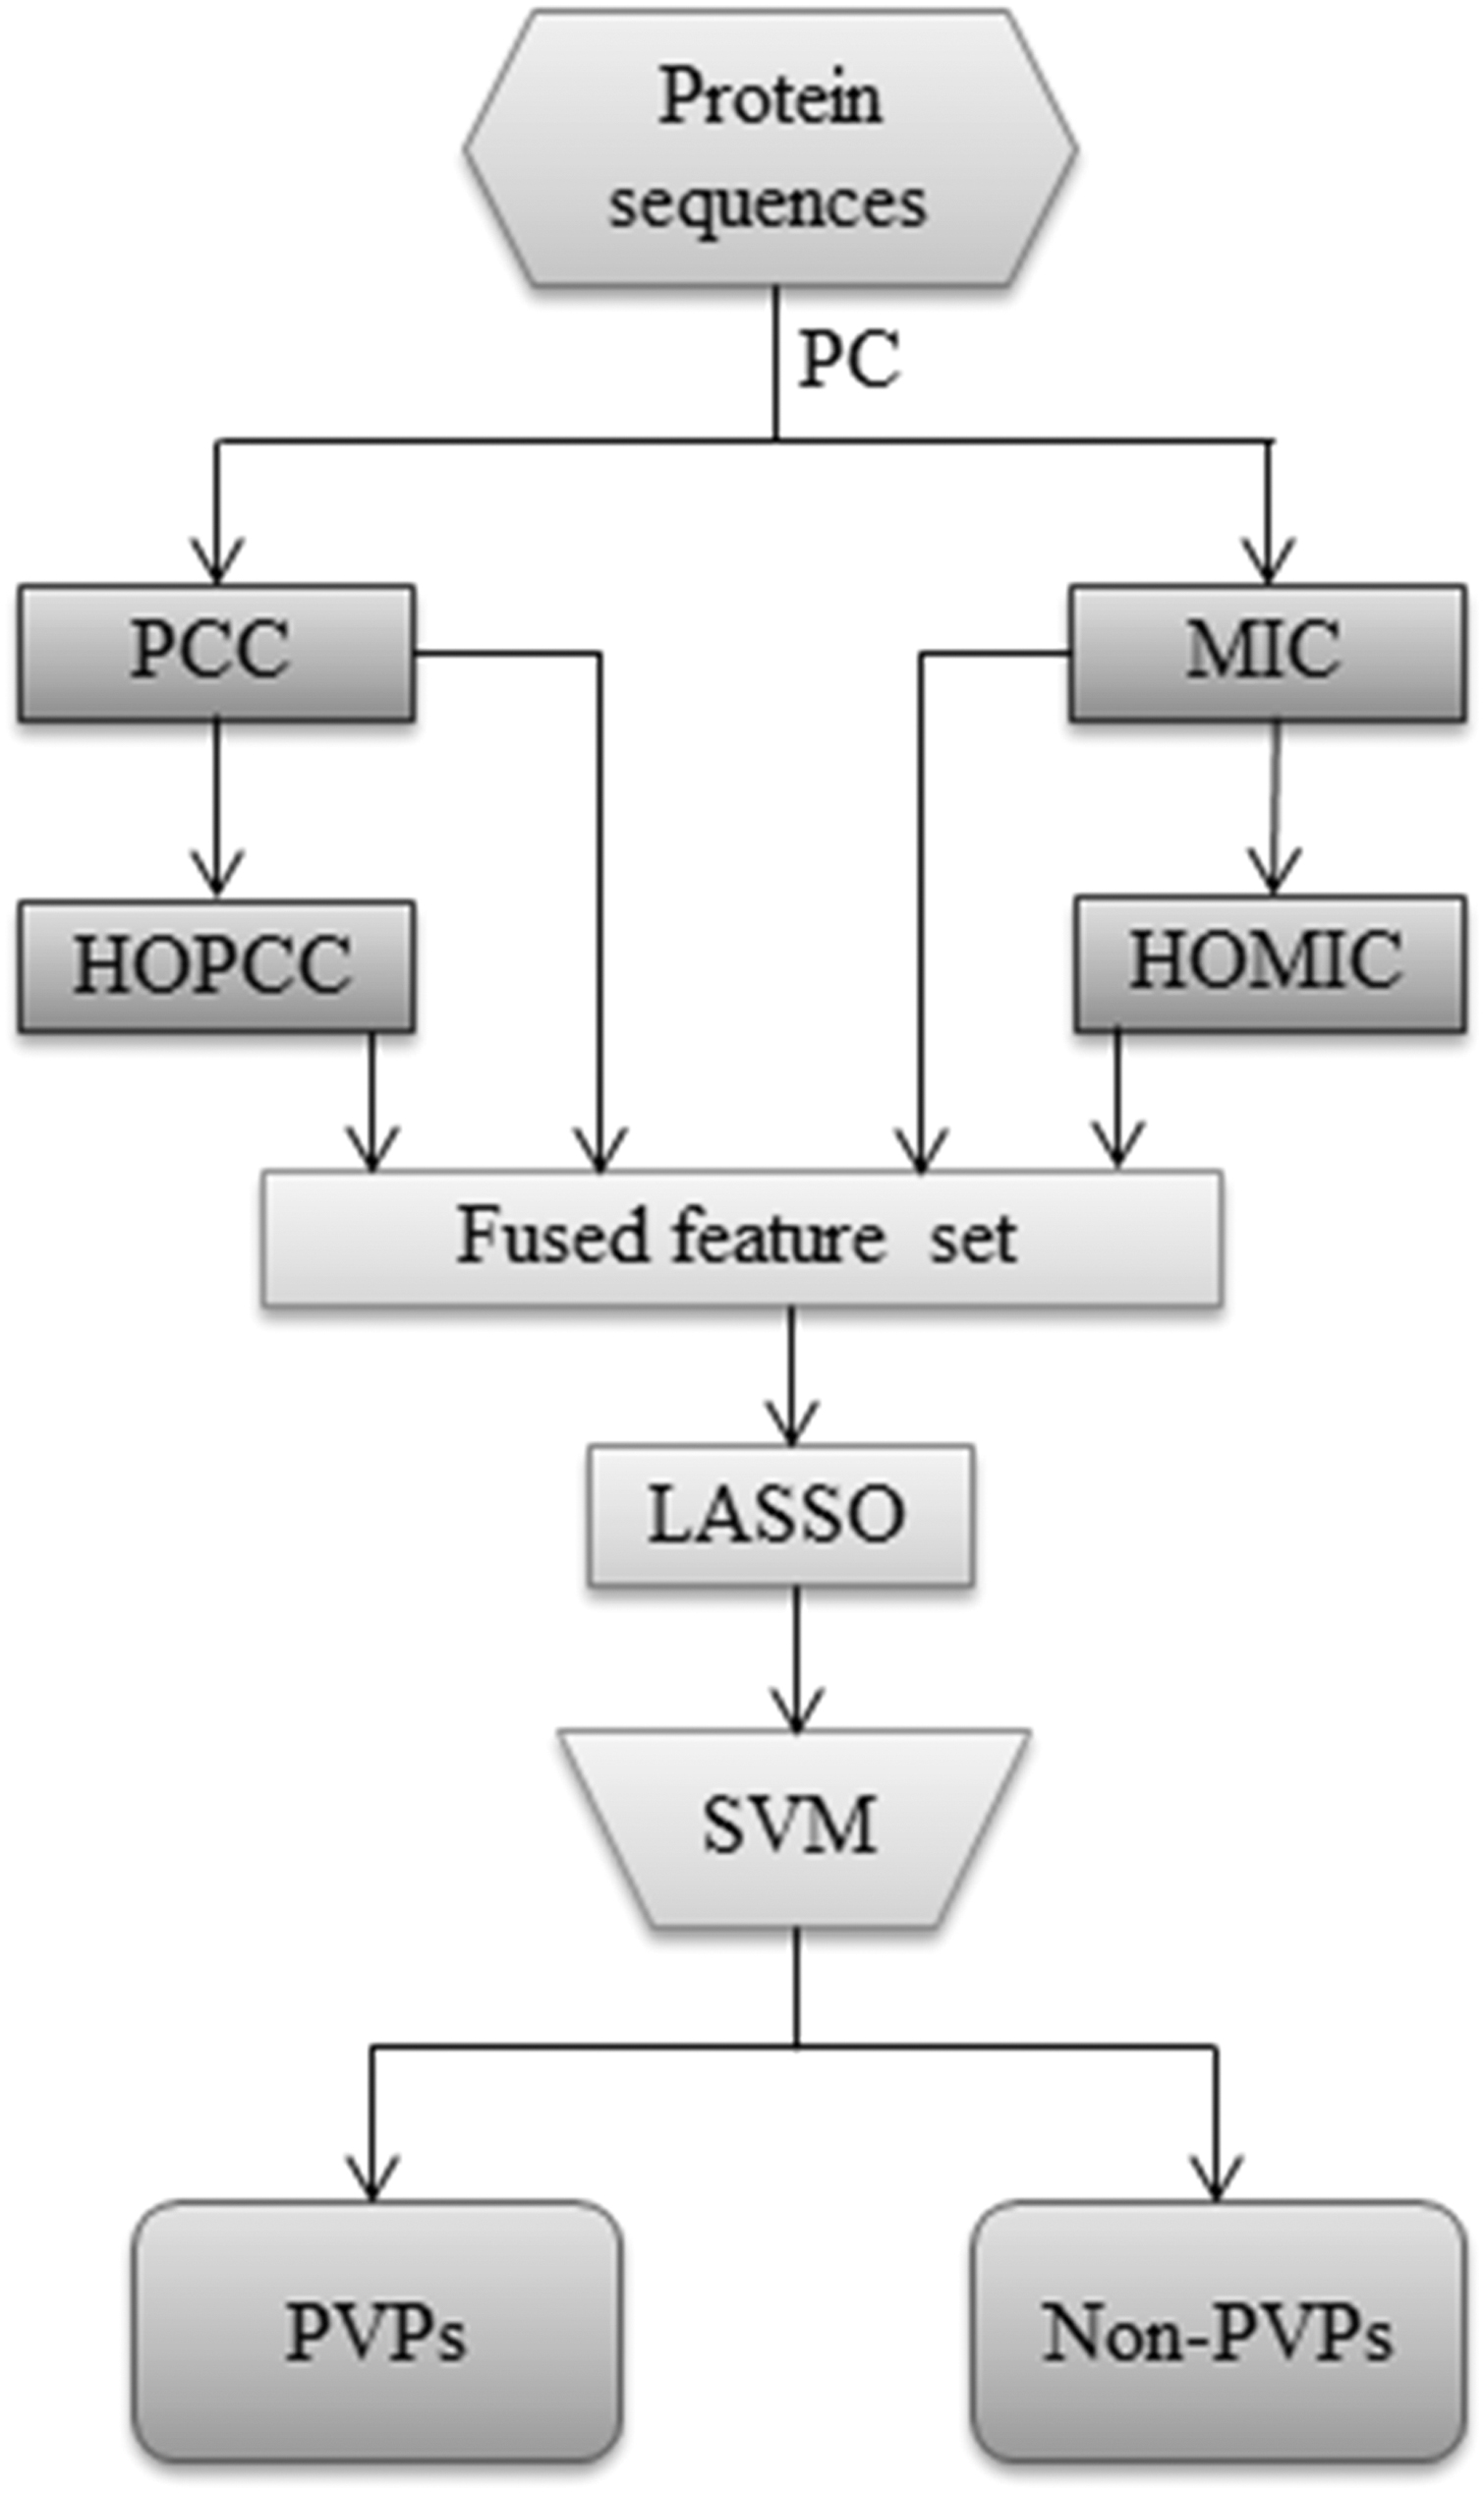
The flowchart of the proposed classification model.
Datasets
An effective dataset is crucial for the success of the experimental process. In the current work, we used the same datasets as in prior studies (Ahmad et al., 2022; Charoenkwan et al., 2020c) to validate the proposed model. These datasets include two different sets, namely a training dataset and an independent dataset, which can be formulated as follows:
where
PC property is an effective feature descriptor that has been widely used in various studies (Xiao et al., 2015; Xiao et al., 2012; Zou et al., 2022a; Zuo et al., 2020). Therefore, in this study, we adopted the same 50 types of PC properties as in previous studies (Zou and Yin, 2021; Zou et al., 2022c) to encode protein sequence. Accordingly, we can use the following formula to represent a protein sequence:
where
By using PCC approach, a protein can be described as
where
In addition, another descriptor called MIC, a non-linear correlation analysis method was also introduced to capture the interaction between different PC properties. In the following, we will provide a detailed description of this method. If there are two different variables A and B, a grid G (with a row and b columns) can be plotted on the scatterplot for these two variables. The grid G partitions the data to capture the relationship between the two variables using mutual information (MI). The MI can be calculated using the following formula (Zou and Yang, 2020):
where
MIC is the maximal value of
If A and B represent two different PC properties, the MIC value between them is computed as the non-linear connection of the corresponding PC properties. Thus, the non-linear connection (i.e., MIC) among 50 PC properties can be represented by:
where
MIC is an effective approach to measure the correlations between different PC properties; however, this type of correlation can only capture the interaction between two different PC properties. It is unknown whether connection among more than two PC properties may benefit the classification task. To further gain high-order connection information, we use Eqs. (3–6) once again. The high-order PCC (HOPCC) and high-order MIC (HOMIC) based on PCC and MIC among all 50 PC properties are denoted as:
where

An example to illustrate how to obtain HOMIC from PC matrix. HOMIC, high-order MIC; PC, physicochemical.
We collected the correlation information between different PC properties as discriminative features to distinguish PVPs from non-PVPs. However, there may be many irrelative and redundant features, which can lead to over-fitting. Therefore, a feature selection strategy was adopted in this work. The LASSO algorithm was employed to select the most discriminative features from the feature pool.
Assume that

where
Classifier
The SVM is a useful machine-learning algorithm (Cortes and Vapnik, 1995), and it has been successfully used in various fields (Chen et al., 2020; Xiao et al., 2019; Chen et al., 2016; Zou and Yang, 2019). Therefore, in this study, an SVM with radial basis kernel function was adopted as the classifier to discriminate PVPs from non-PVPs. A grid search strategy was adopted to find the best combination of the regularization parameter C and kernel parameter γ. The search space for these two parameters is [2−15, 215] and [2−15, 215], and the step size is 22 and 2−2, respectively.
Cross-validation
The following three approaches, including K-fold cross-validation test, leave-one-out cross-validation (LOOCV) test, that is, jackknife test, and independent test, are commonly used to validate the performance of the proposed model. Among these methods, the jackknife test is considered the most objective because it can generate stable results.
Therefore, in this study, we adopted the jackknife test to validate the proposed classification model, as in various previous studies (Tang et al., 2018; Wang et al., 2015; Zou et al., 2022b). Briefly, suppose that there are m samples included in the dataset. In each LOOCV trail, m-1 subjects are selected to train the model, and the remaining one is used for testing. This process is repeated m times until each sample has been used for testing.
Performance evaluation
The classification accuracy (Acc), sensitivity (Sn), specificity (Sp), and Mathew's correlation coefficient (MCC) were employed to evaluate the performance of our proposed method. They are defined as follows (Basith et al., 2018; Charoenkwan et al., 2020a; Dai et al., 2021a; Li et al., 2020; Lissabet et al., 2019):

where TP represents true positive, which is the number of correctly recognized PVPs, TN (true negative) denotes the number of correctly classified non-PVPs, FP (false positive) and FN (false negative) represent the number of non-PVPs classified as PVPs, and PVPs are identified as non-PVPs, respectively. In addition to the four indicators mentioned earlier, the area under the receiver operating characteristic (ROC) curve (AUC) was also adopted to evaluate the performance of the model.
Parameters setting
As mentioned earlier, we used the grid search method to find the optimal combination of the regularization parameter C and kernel parameter γ. We found that the best classification performance was obtained when using the following combination of these parameters:
Table 1 presents the classification results of the proposed method on the training dataset, and the ROC curves of these approaches are presented in Figure 3. As observed from Table 1, we can see that different feature descriptors generated distinct classification results. Compared with the linear connection approach, the non-linear method achieved better classification performance, regardless of low-order or high-order correlation.
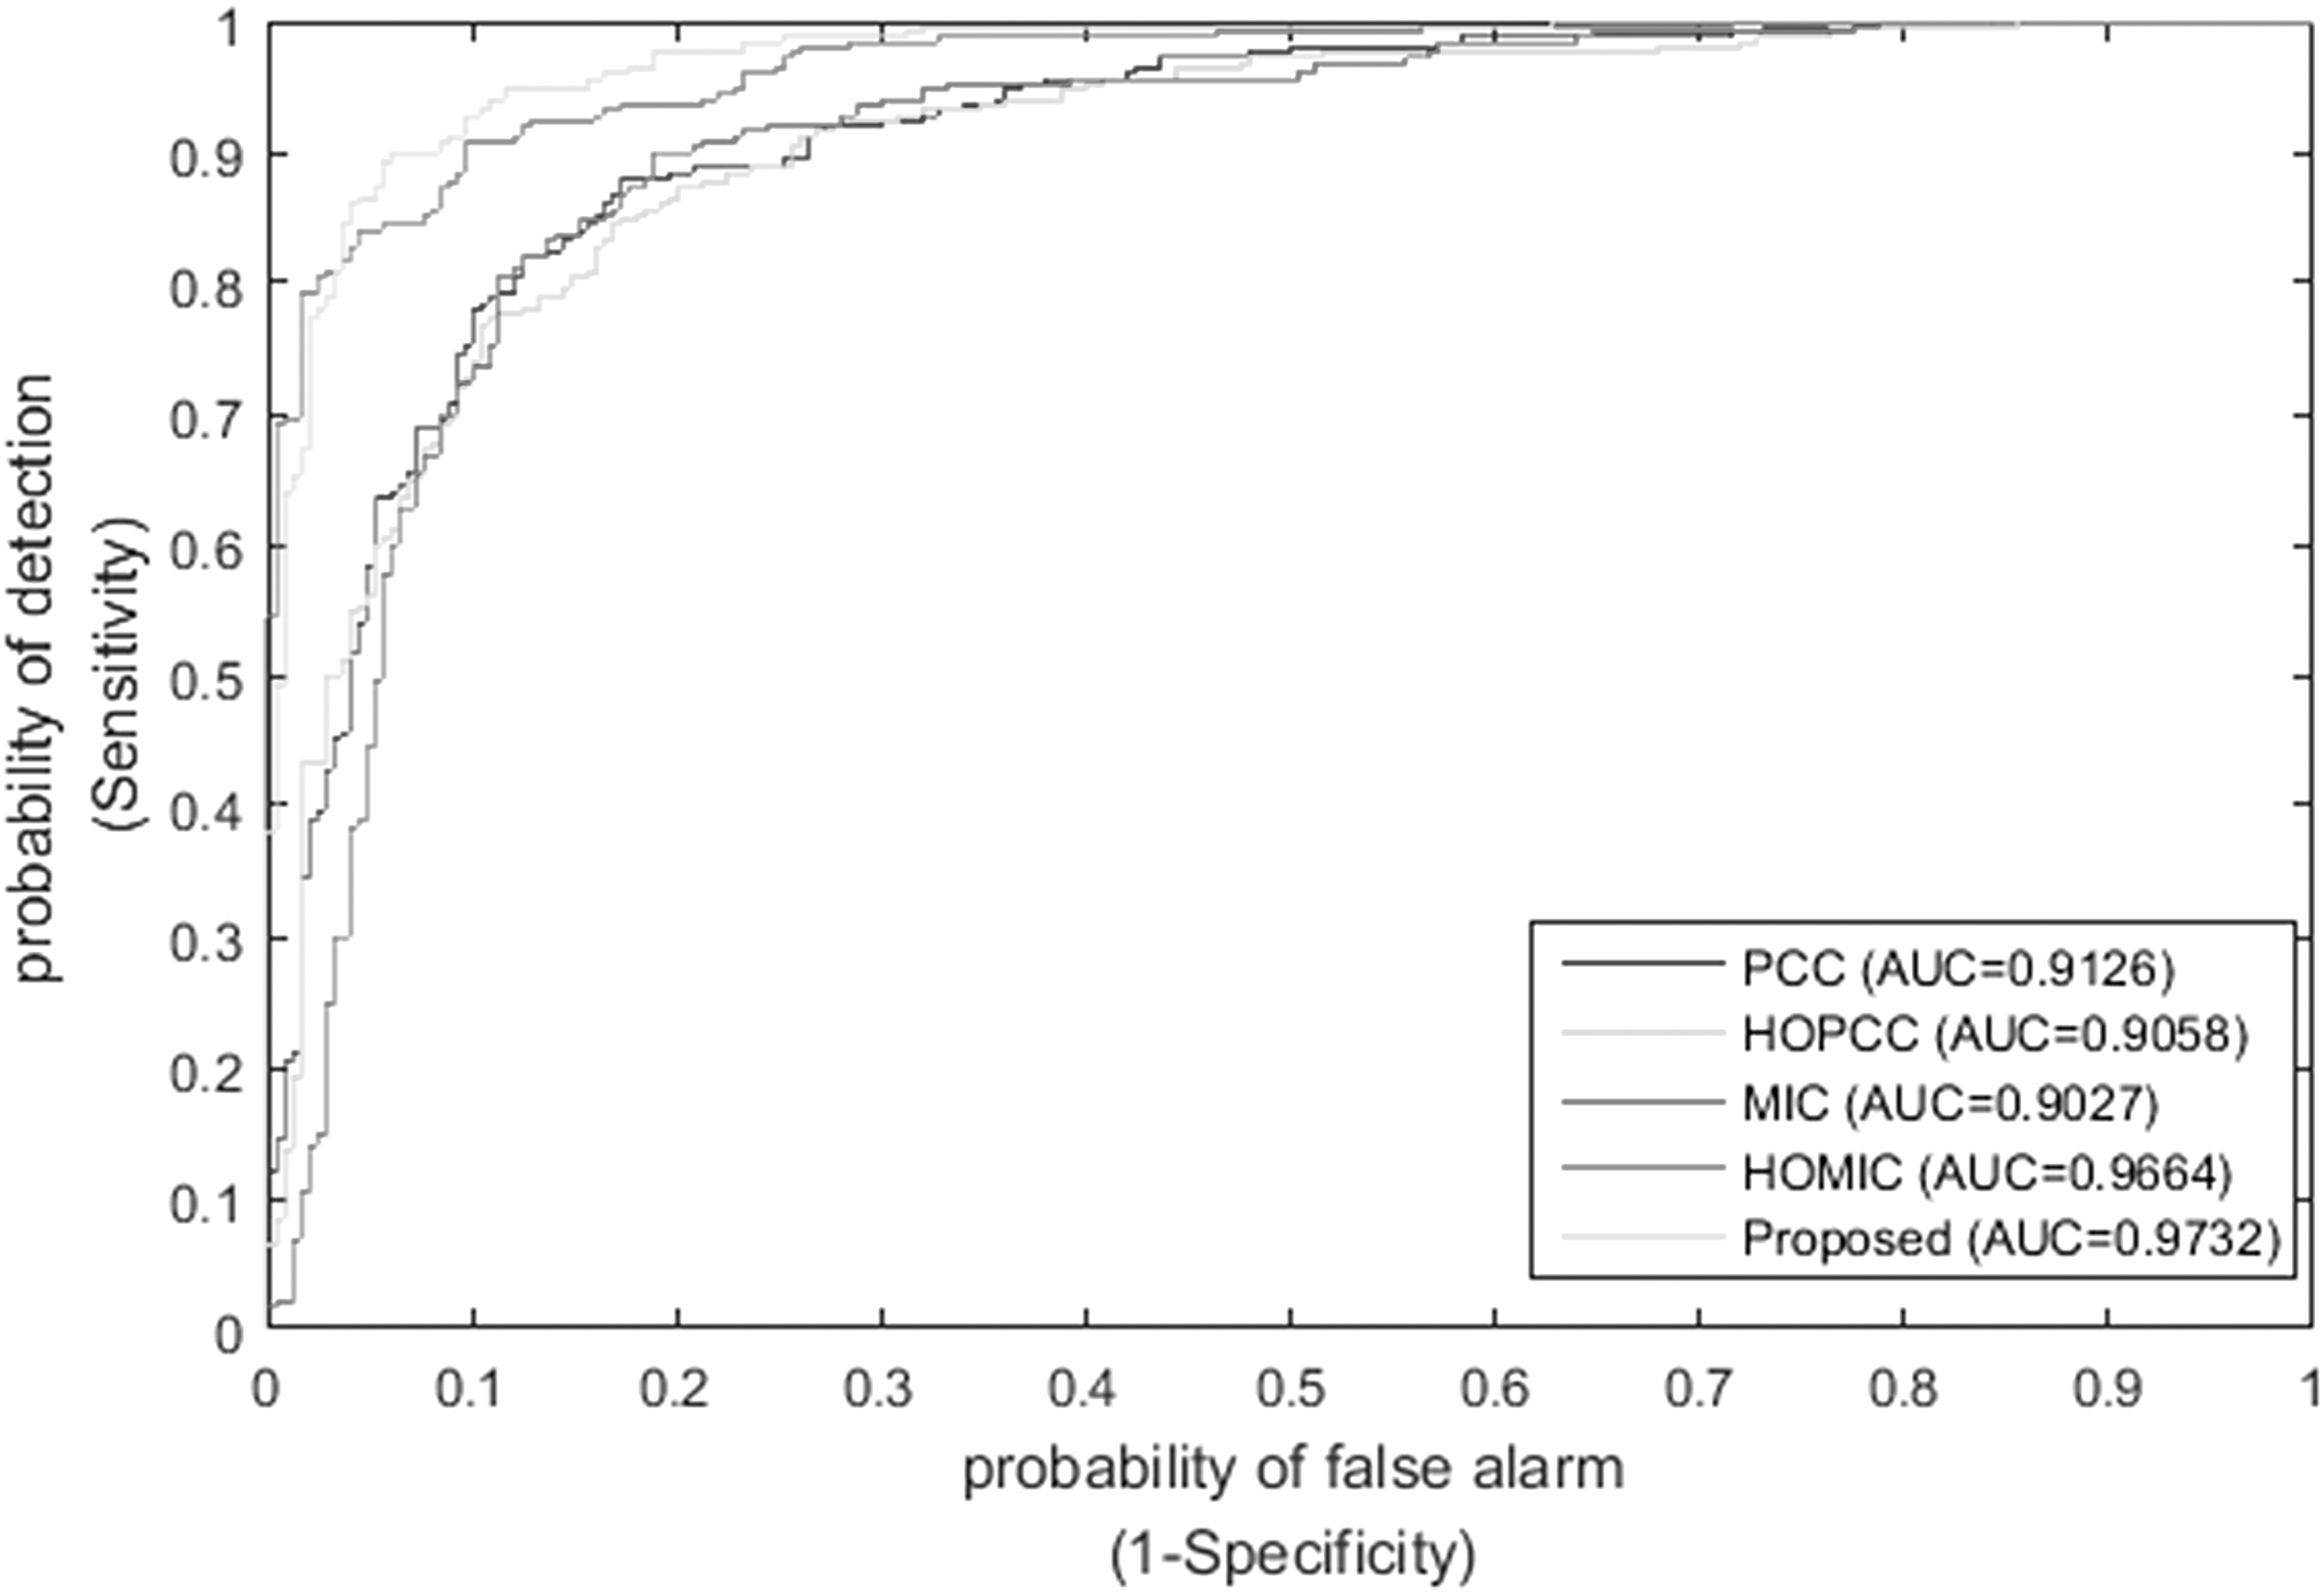
The ROC curves of different features on the training dataset. ROC, receiver operating characteristic.
Classification Results of Different Feature Approaches on Training Dataset
Acc, accuracy; AUC, area under the receiver operating characteristic curve; HOMIC, high-order MIC; HOPCC, high-order PCC; MCC, Mathew's correlation coefficient; MIC, maximal information coefficient; PCC, Pearson's correlation coefficient; Sn, sensitivity; Sp, specificity.
For instance, HOMIC obtained an 88.80% classification accuracy, and the value of AUC is 0.9664, whereas the corresponding values for HOPCC are 83.20% and 0.9058, respectively. Further, when combining all of these features, the performance has significantly improved. The classification accuracy arrived at 91.40%, which is 2.60% higher than HOMIC, the suboptimal approach. As for sensitivity, MCC and AUC, the proposed method also obtained the best classification performance.
The classification performance of different feature approaches on the independent dataset was summarized in Table 2, and Figure 4 plots the corresponding ROC curves. As shown in this table, compared with other approaches, the proposed method achieved the best classification results in terms of Acc, Sn, Sp, MCC, and AUC.
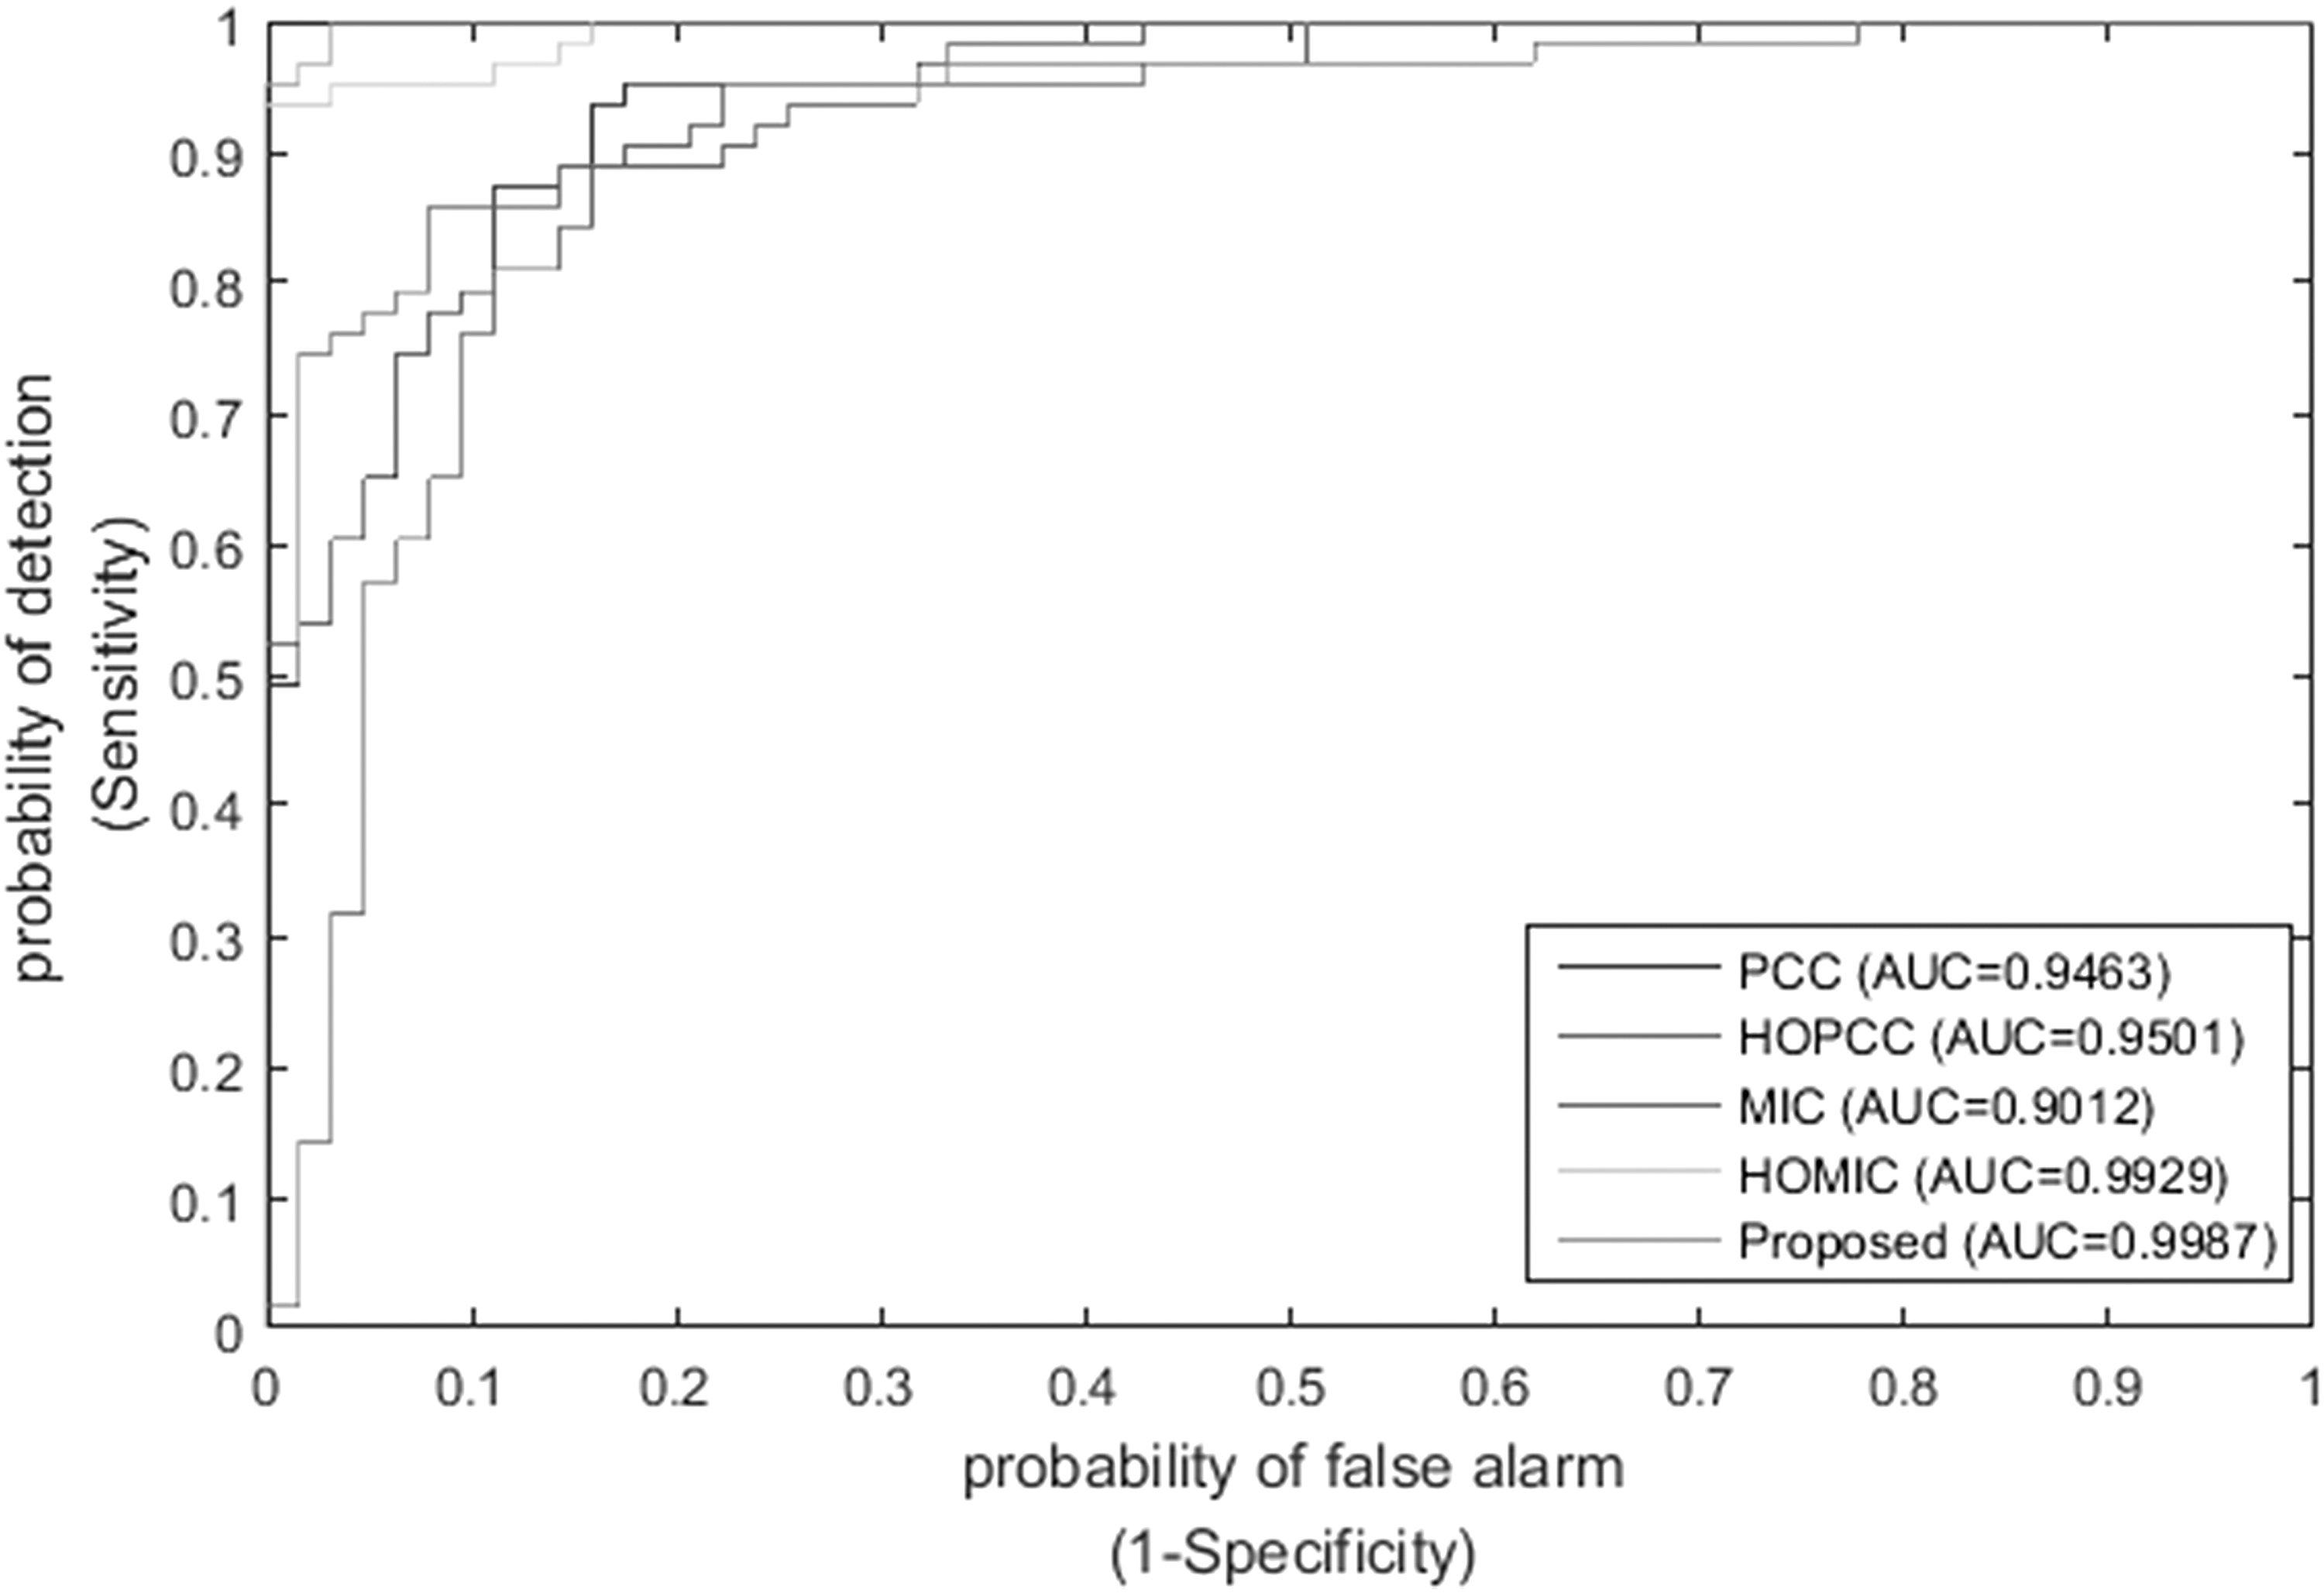
The ROC curves of different features on the independent dataset.
Classification Results of Different Feature Approaches on Independent Dataset
For example, our proposed approach achieved a 96.83% classification accuracy, and the AUC value arrived at 0.9987, whereas HOMIC, the suboptimal method, obtained 95.24% classification accuracy, and the AUC value is 0.9929, which is 1.59% and 0.0058 lower than the proposed method, respectively. It indicates that the proposed method is powerful in identifying PVPs.
In this study, four different feature descriptors were adopted to represent samples. In this subsection, we further analyzed the contribution of these four kinds of features. Figure 5 presents the percentage of different features in the final classification process. From this figure, we can see that among these four types of features, HOMIC provides the greatest contribution to the classification task.
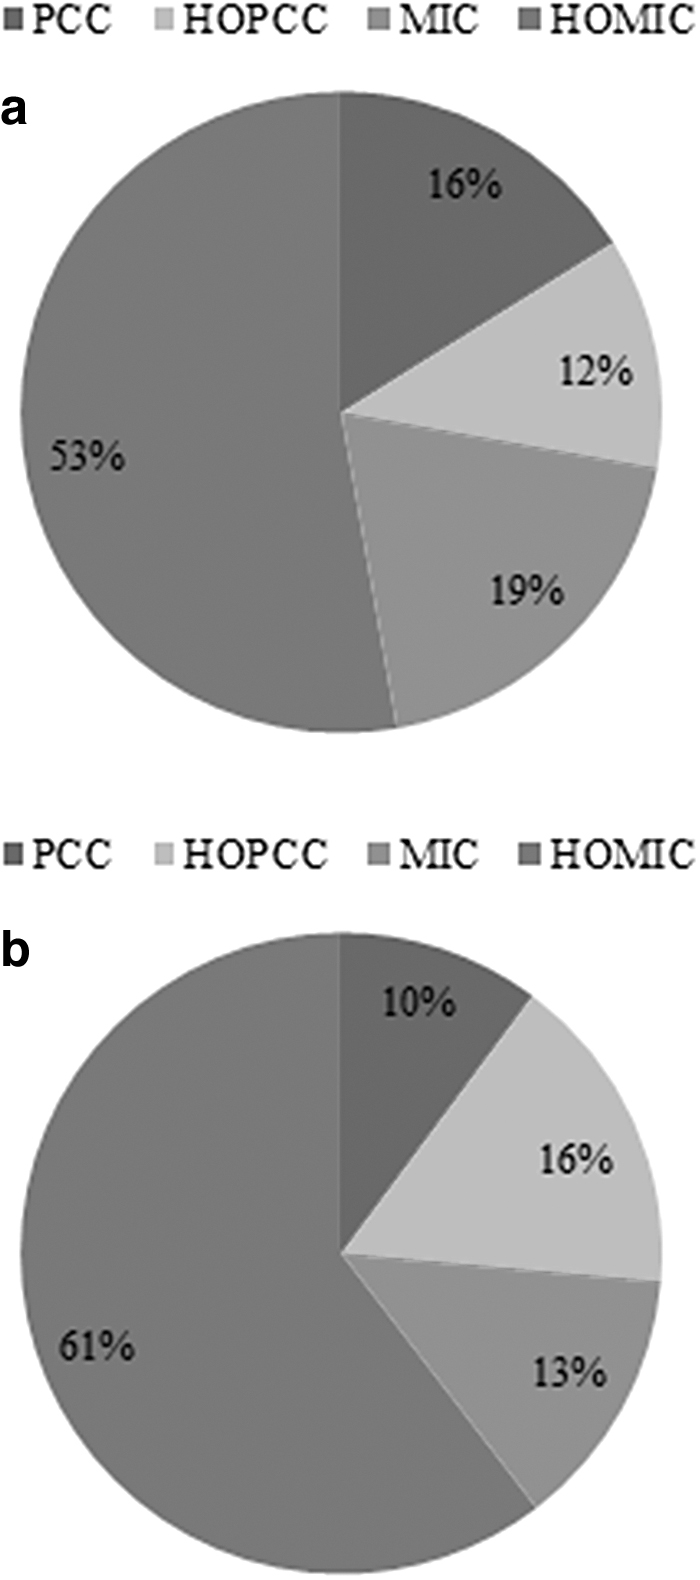
The contribution of different features on the classification task.
This may explain why HOMIC achieved better classification results than the others as listed in Tables 1 and 2.
In this work, the SVM was employed to discriminate PVPs from non-PVPs. However, many other classifiers are often used in this area. To explore this issue, we also performed experiments on other classifiers, such as K nearest neighbor (Dhall et al., 2021; Dai et al., 2021b; Hasan et al., 2020; Liu and Chen, 2020; Lin et al., 2019), decision tree (Dhall et al., 2021; Lin et al., 2019), and random forest (Charoenkwan et al., 2021; Dai et al., 2021b; Dhall et al., 2021; Hasan et al., 2020; Lin et al., 2019; Liu and Chen, 2020; Liu et al., 2018).
All of the results were summarized in Figure 6. It is not difficult to find that different classifiers generate distinct classification results. As compared with the others, SVM achieved the best classification performance on both datasets.

The classification performance of different classifiers.
In addition to the datasets used in this work, other datasets were also used in PVPs study. For further demonstrating the efficacy of the proposed method, we performed experiments on datasets collected from previous studies (Arif et al., 2020; Manavalan et al., 2018). There are two different datasets included, which we term as S1 and S2. S1 contains 99 PVPs and 208 non-PVPs, whereas S2 includes 30 PVPs and 64 non-PVPs.
All of the results were provided in Table 3. It can be observed that our proposed approach achieved some promising results, with significant improvements compared with previous predictors. Moreover, we can see that the proposed model has a good ability to deal with the imbalanced data.
Classification Performance of Different Models on S1 and S2
Classification Performance of Different Models on S1 and S2
N/A, not available; PVP, phage virion protein; SVM, support vector machine.
Moreover, we also conducted experiments to compare our proposed method with state-of-the-art classification models on the same datasets. Since previous works used a 10-fold cross-validation test to validate their predictors, for a fair comparison, we also adopted a 10-fold test to measure the performance of the proposed model. To perform a 10-fold cross-validation test, the dataset is randomly divided into 10 parts, with nine of them used as the training set and the other part used as the testing set. Table 4 gives the classification performance of different predictors.
Performance Comparison Between the Proposed Model and Existing Predictors
Performance Comparison Between the Proposed Model and Existing Predictors
Obviously, the proposed method achieved the best classification performance on both the training and independent datasets, compared with other predictors. For instance, our proposed method achieved 90.74% and 96.75% classification accuracies on the training and independent dataset, whereas the best classification results of prior studies on this metric are 86.80% and 87.30%, which are 3.94% and 9.45% lower than the proposed method.
In this study, we proposed a novel approach to identify PVPs. In the model, multiple kinds of correlation information were employed to denote peptide sequences, and LASSO algorithm was applied to select the most discriminative features. We obtained 91.40% and 96.83% classification accuracies on the training and independent datasets, respectively.
Compared with the state-of-the-art approaches, our proposed method achieved significant improvement on both the training and independent datasets. The codes and datasets are freely available at https://figshare.com/articles/online_resource/iPVPs/19450913. We hope that the proposed method may play a complementary role for the current PVPs study.
Footnotes
ACKNOWLEDGMENT
The authors gratefully acknowledge the partial support from the Jiangxi Science and Technology Normal University.
AUTHORs' CONTRIBUTIONS
All authors agree that they have read and approved the article.
AUTHOR DISCLOSURE STATEMENT
The authors declare they have no conflicting financial interests.
FUNDING INFORMATION
This work was supported by the Youth Project of Jiangxi Education Department (GJJ2201350), the Doctoral start-up fund of Jiangxi Science and Technology Normal University (2022BSQD20).