
Abstract
With the properties of aggressive cancer and heterogeneous tumor biology, triple-negative breast cancer (TNBC) is a type of breast cancer known for its poor clinical outcome. The lack of estrogen, progesterone, and human epidermal growth factor receptor in the tumors of TNBC leads to fewer treatment options in clinics. The incidence of TNBC is higher in African American (AA) women compared with European American (EA) women with worse clinical outcomes. The significant factors responsible for the racial disparity in TNBC are socioeconomic lifestyle and tumor biology. The current study considered the open-source gene expression data of triple-negative breast cancer samples' racial information. We implemented a state-of-the-art classification Support Vector Machine (SVM) method with a recurrent feature elimination approach to the gene expression data to identify significant biomarkers deregulated in AA women and EA women. We also included Spearman's rho and Ward's linkage method in our feature selection workflow. Our proposed method generates 24 features/genes that can classify the AA and EA samples 98% accurately. We also performed the Kaplan–Meier analysis and log-rank test on the 24 features/genes. We only discussed the correlation between deregulated expression and cancer progression with a poor survival rate of 2 genes, KLK10 and LRRC37A2, out of 24 genes. We believe that further improvement of our method with a higher number of RNA-seq gene expression data will more accurately provide insight into racial disparity in TNBC.
1. INTRODUCTION
Breast cancer is the most frequent and second major cause of cancer-related death in women in the United States and is a heterogeneous cancer with diverse biological subtypes (Hendrick et al., 2021). Breast cancer tumor growth relies on estrogen hormone, progesterone hormone, and human epidermal growth factor receptor (HER2; growth factor) protein. The molecular classification of breast cancer is based on the expression of three biomarkers: estrogen receptor (ER), progesterone receptor (PR), and Her2. Triple-negative breast cancer lacks the expression of estrogen, progesterone, and HER2 receptors (Moss et al., 2020; Cho et al., 2021). It can grow in the absence of estrogen and progesterone hormones and Her2 protein. Therefore, standard breast cancer treatment options such as hormonal therapies and targetable drugs fail to cure triple-negative breast cancer (TNBC) (Prakash et al., 2020).
Furthermore, TNBC has highly heterogeneous tumor biology with a solid metastatic potential leading to poor clinical outcomes compared with other breast cancer subtypes (Cho et al., 2021). The rate of TNBC diagnosis in the United States is 10%–20% compared with different invasive breast cancer subtypes (Dietze et al., 2015; Prakash et al., 2020; Lehrberg et al., 2021). In addition to that epidemiological and clinical studies, the incidence rate of TNBC is twice in African American (AA) women compared with European American (EA) women (Chen and Li, 2015). The current finding suggests that biological and socioeconomic factors significantly contribute to poor clinical outcomes in AA women having TNBC (Newman and Kaljee, 2017).
Consequently, the recent breast cancer research needs to provide the underlying biological mechanism of TNBC, especially biomolecules responsible for racial disparity in TNBC (Sturtz et al., 2014; Newman and Kaljee, 2017; Siddharth and Sharma, 2018). In the era of machine learning and deep learning, we need robust computational models to build on biomolecular, clinical, and epidemiological data to find novel therapeutic targets that can be used in clinics to improve the treatment option and survival of AA TNBC patients.
Cancer researchers generated an unprecedented amount of next-generation sequencing (NGS) data to study the molecular mechanism behind cancer progression and metastasis. This immense amount of NGS data used for different scientific studies is freely available on the internet (Lachmann et al., 2018; Esposito et al., 2019). The dependency on NGS data to address various cancer-related questions is in progress at a higher rate than in earlier studies because of its cost reduction in data generation with upgradation in sequencing technology (Rondel et al., 2021). With the help of NGS technology, a cancer researcher can efficiently study the whole transcriptome and genome of a cancer sample to get a broader biological perspective. RNA sequencing (RNA-seq) is one of the sequencing technologies from the NGS arsenal that can help study the whole transcriptome of a cancer sample.
RNA-seq provides information about a tumor's transcripts and gene expression; it can also check gene fusion, immune cell expression, somatic mutations, splicing variants, intron retention, pathway analysis, and gene interaction networks (Lachmann et al., 2018; Rondel et al., 2021). Online databases such as ArrayExpress (EMBL-EBI, 2019) and NCBI-GEO (geo, 2019) store all forms of sequencing data, including RNA-seq, with raw, processed, and clinical information for individual studies considered NGS to address their biological questions. Also, databases such as The Cancer Genome Atlas (TCGA) and International Cancer Genome Consortium (ICGC) consortiums provide free access to the massive amount of sequencing data for different cancer types (National Cancer Institute, 2019). Computational biologists take advantage of these databases to obtain reliable sequencing data for their studies to understand cancer. This study also considered the open-source RNA-sequencing gene expression data of TNBC patients to identify potential biomarkers expressed in AA women compared with EA women.
To identify highly discriminant biomarkers in AA and EA TNBC samples gene expression data, we considered it a problem to classify AA and EA samples with a selected number of genes. We applied the popular classification algorithm, Support Vector Machine (SVM), with feature/gene selection techniques on RNA-seq gene expression data to achieve our goal (Platt, 1999; Brown et al., 2000; Guyon et al., 2002; Vanitha et al., 2015; Das et al., 2020). In this study, feature/gene selection is an essential step because clinical/biological science always relies on the top-ranking genes from the computational data analysis.
In addition to feature selection using the SVM method, we showed the enrichment/expression of selected features/genes in different groups. Therefore, the proposed method satisfies quantitative and qualitative analysis of features/genes that can accurately classify AA and EA TNBC samples. We further used a microarray data set of TNBC gene expression data with survival information to validate our genes and predict pathological outcomes. We considered the microarray data set because, as per our knowledge, that is the only data set that satisfies our study's requirement. The pathological role of our genes is accessed by performing the Kaplan–Meier and log-rank tests on the microarray expression and survival data.
Our proposed SVM-based feature/gene selection with the recurrence feature elimination method identifies 24 genes that can accurately classify AA and EA samples. We further validated the pathological significance of those genes with the Kaplan–Meier survival and log-rank test on a microarray data set having survival information. Finally, we found that 12 genes have a significant pathological role in TNBC samples, and we also cherry-picked 2 genes, KLK10 and LRRC37A2, from the 12 genes and discussed their biological role in TNBC. The high expression of KLK10 is known for poor prognosis in TNBC and other cancers.
Our methods also show that KLK10 has an increased expression in AA samples compared with EA samples and can be a potential biomarker in this racial disparity study (Yousef et al., 2005; Rückert et al., 2008; Kioulafa et al., 2009; Alexopoulou et al., 2013; Lin et al., 2020). The deregulation of LRRC37A2 is known for cancer progression and is a critical member of various gene signature studies to assess the cancer prognosis (Wu et al., 2018; Feng et al., 2020; Wisnieski et al., 2021; Xu et al., 2022). The role of LRRC37A2 in TNBC progression is known (Stewart et al., 2013); we also found low expression of the LRRC37A2 gene in AA samples compared with EA samples, and it has a significant survival outcome in our validation analysis. Considering the above results, we can conclude that our SVM-based feature selection method identified essential genes significantly contributing to poor outcomes in AA TNBC women.
The current study is organized as follows. In Section 2, we detail the RNA-seq gene expression data collection and SVM-based feature selection method. We also specify the feature/gene enrichment method. Finally, we provided the details of feature validation methods. In Section 3, we provided the final feature list and discussed the biological significance of two features/genes from the final feature list such as KLK10 and LRRC37A2. In Section 4, we discussed our approach's merit in the TNBC racial disparity study to identify potential biomarkers and contributions of our research.
2. DATA AND METHODS
In this section, we report our RNA-seq gene expression data set details in Section 2.1. We discuss our SVM-based feature/gene selection method used to study the racial disparity in TNBC in Section 2.2. The feature estimation method is discussed in Section 2.3. The validation method for our features using the Kaplan–Meier survival analysis, log-rank test, and the differential gene expression analysis using DESeq2 is discussed in Sections 2.4 and 2.5, respectively.
2.1. RNA-seq gene expression data
Open-source RNA sequencing gene expression data of breast cancer patients were considered for this study. The processed RNA-seq gene expression data with log2 median-centered was downloaded from geo (2019; National Cancer Institute, 2019). According to hormone receptor status, breast cancer has various subtypes and can be accessed by immunohistochemistry tests. We considered the negative immunohistochemistry status for ER, PR, and HER2 receptors to collect the triple-negative breast cancer samples.
The fluorescence in situ hypridization (FISH) status was considered for the samples with equivocal immunohistochemistry status for HER2 receptor. The immunohistochemistry status filtering criteria generated 145 triple-negative breast cancer samples from the breast cancer data set. This study focuses on discovering molecular-level racial disparity in EA and AA women having TNBC. Therefore, we further reduced our sample size from 145 to 128, considering the race category information. For our final analysis, we considered 128 TNBC samples, where 87 were from EA women and 41 were from AA women.
2.2. Construction of SVM-based model for feature selection
2.2.1. Initial feature selection using SVM classifier
This current research addresses the classification problem of EA and AA women having TNBC to understand the racial disparity using RNA-seq gene expression data. As an initial preprocessing step, we dropped the features having few unique gene expression counts across the data set. Next, we standardize the gene expression data to Z-scores in Equation (1).
where x = the original gene expression value, μ = the mean of the gene expression values, and σ = the standard deviation of the gene expression values.
After that, the SVM classifier with a linear kernel fitted to the Z-score normalized data. Finally, L1 regularization was considered to generate a classifier for the groups with a sparse feature set to select the initial feature set.
2.2.2. Feature reduction
We calculated the pairwise correlation between the features using Spearman's rho nonparametric test Equation (2).
where ρ = Spearman's rho coefficient, di = the difference between the two ranks of each features, and nf = number of features.
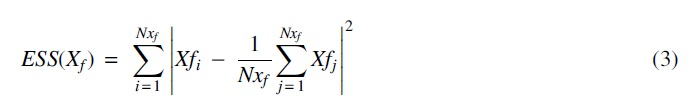
Then, we applied Ward's linkage method for hierarchical cluster analysis to find the highly correlated features by minimizing the increase in ESS (error sum squares).
Then, we randomly selected one feature from each cluster to represent each. For further analysis, the clusters were selected that have a linkage distance score of 0.65. The value 0.65 was chosen by performing a grid search in fivefold cross-validation. The grid search was performed, including the value between 0.25 and 1.75 with a step size of 0.1. A linear SVM with standard L2 loss was fit to each fold, and the threshold was set to the most significant value, which maintained complete separation in all folds. Figure 1 plots the accuracy of each fold during the grid search.
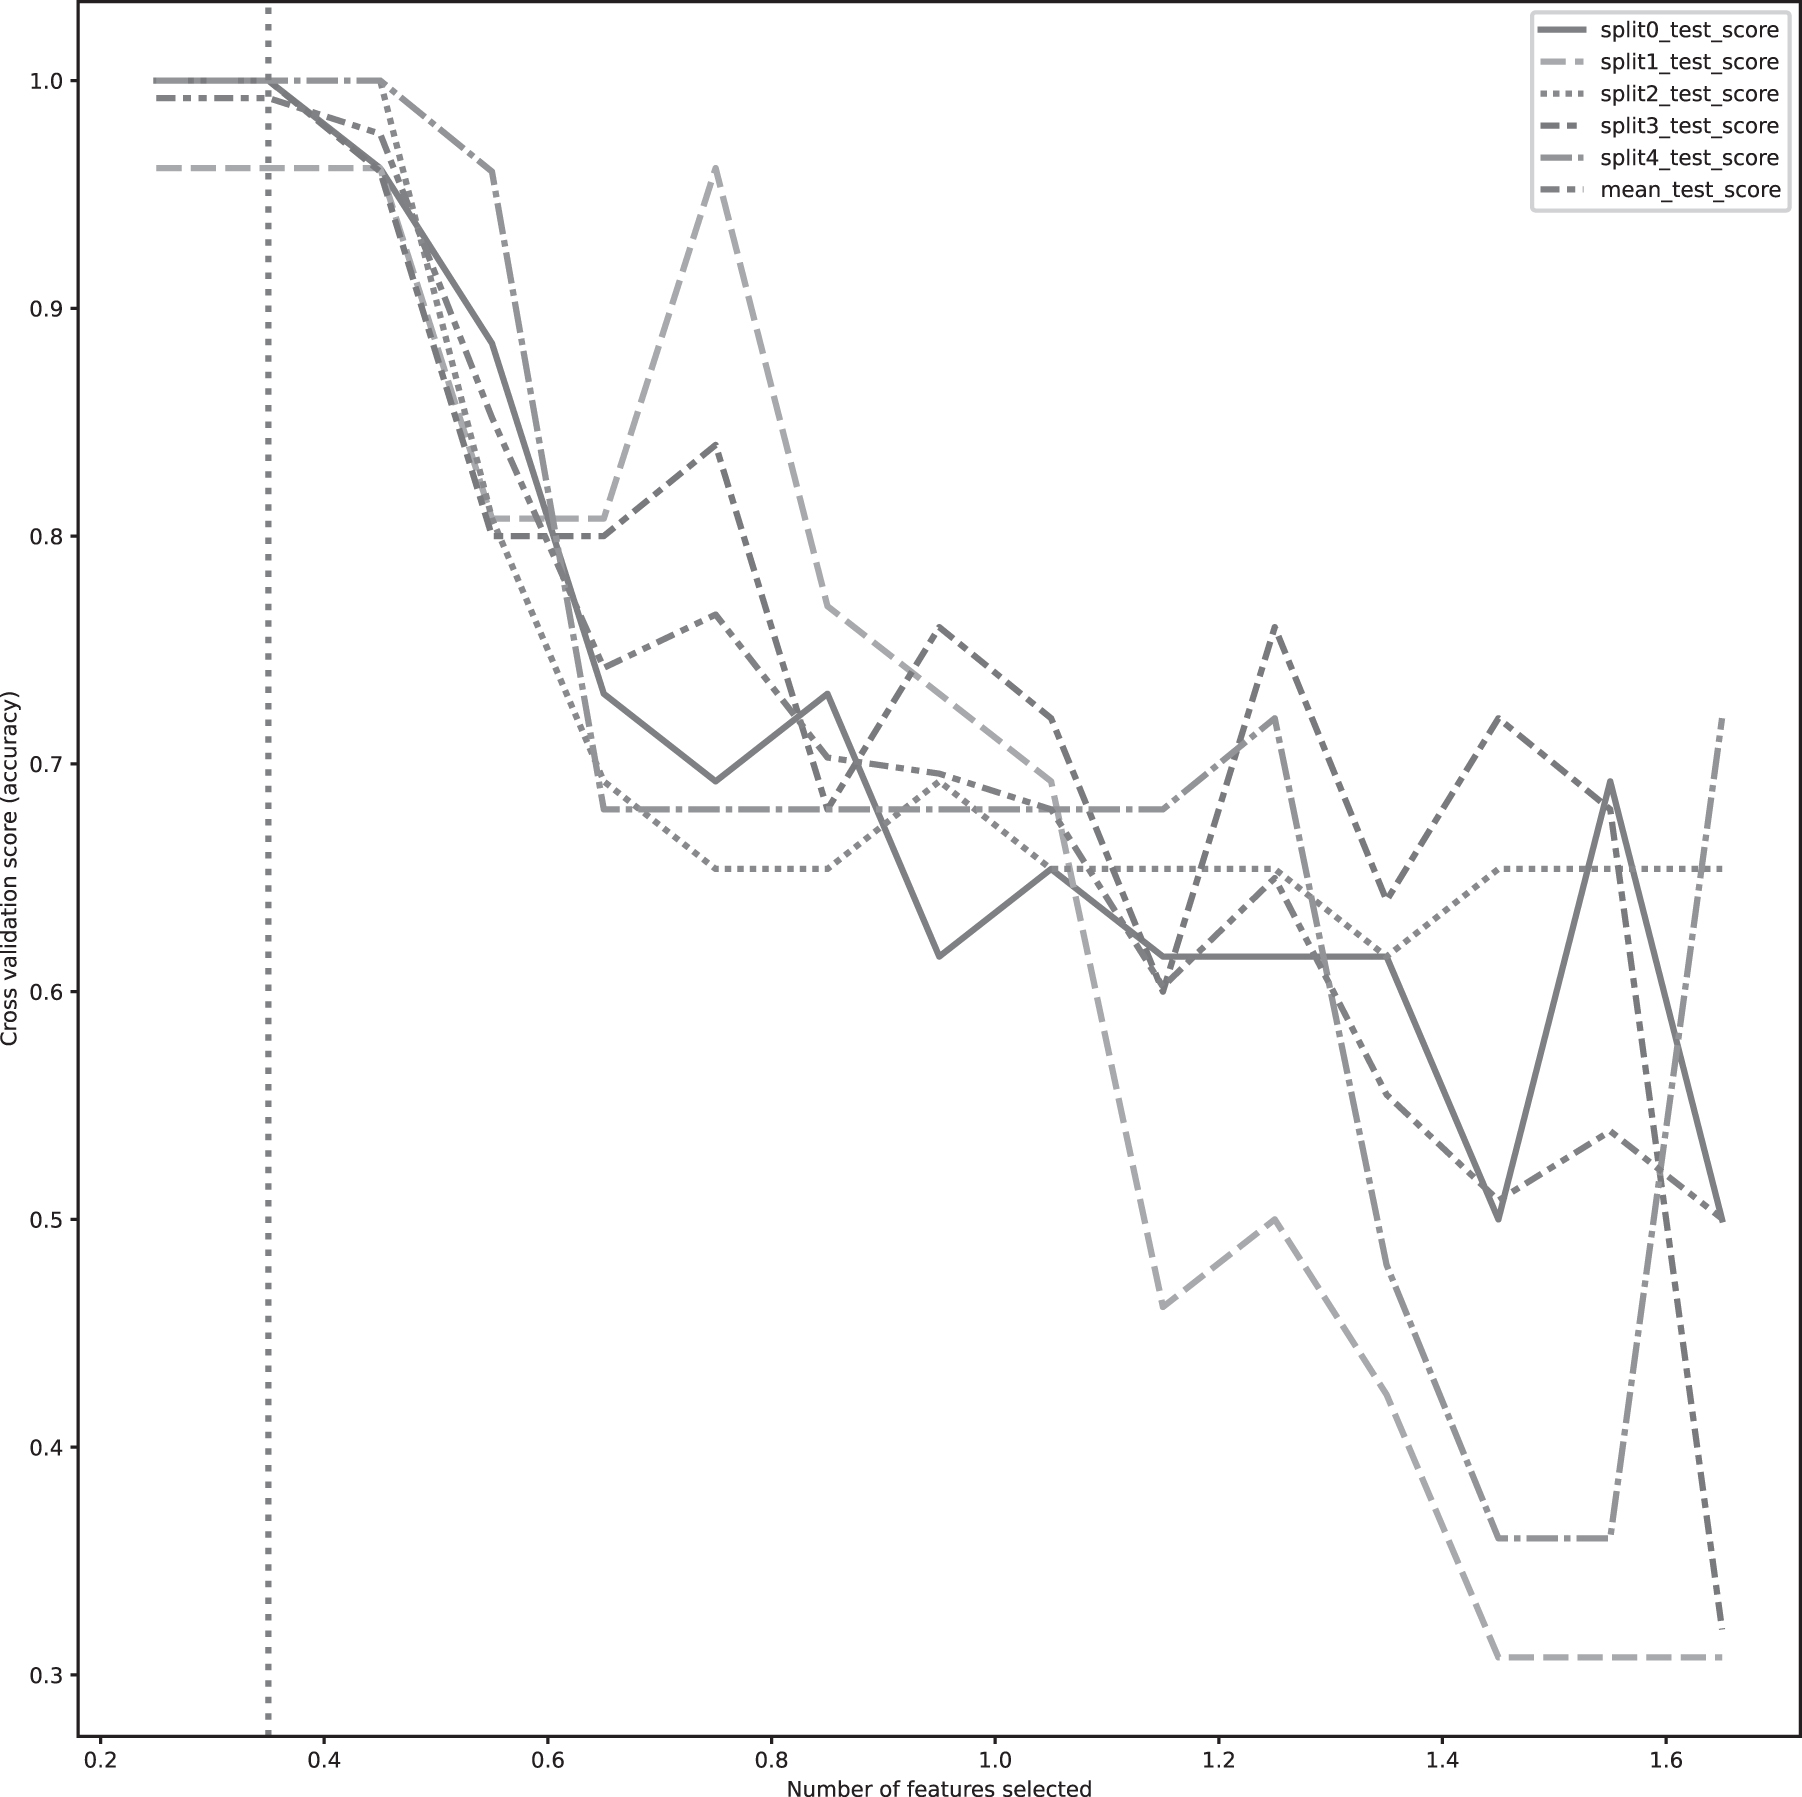
The figure shows the accuracy of SVM classification during grid search for collinearity threshold. The search bound values between 0.25 and 1.75 with an increasing step size of 0.1. SVM, Support Vector Machine.
2.2.3. Further feature reduction using recursive feature
The recursive feature elimination with cross-validation was performed to reduce the features further (Guyon et al., 2002). This method has been used successfully to find classification features for other cancers. We continued to use a linear kernel as the core classifier for the feature selection.
2.2.4. Permutation test on final features
A permutation test was performed on the final features. The EA/AA labels are randomly permuted and fed to the feature selection pipeline. The number of times the magnitude of a feature coefficient from the permuted data exceeded the features selected on the original data was counted. This was repeated with 5000 permutations.
2.2.5. Computation of influence of each feature
The influence of each feature was then assessed with Shapley Additive Explanation (SHAP) values (Lundberg and Lee, 2017). Bootstrapping was used to assess the distribution of variation of SHAP values for each feature. Each iteration was performed on a randomly selected test–train split of the data. A linear SVM was fit with the Platt (1999) scaling estimation of class probabilities. The SHAP KernelExplainer method was used to assess the influence of each item on the test set. The mean of the SHAP value magnitudes was collected and is plotted in Figure 2.
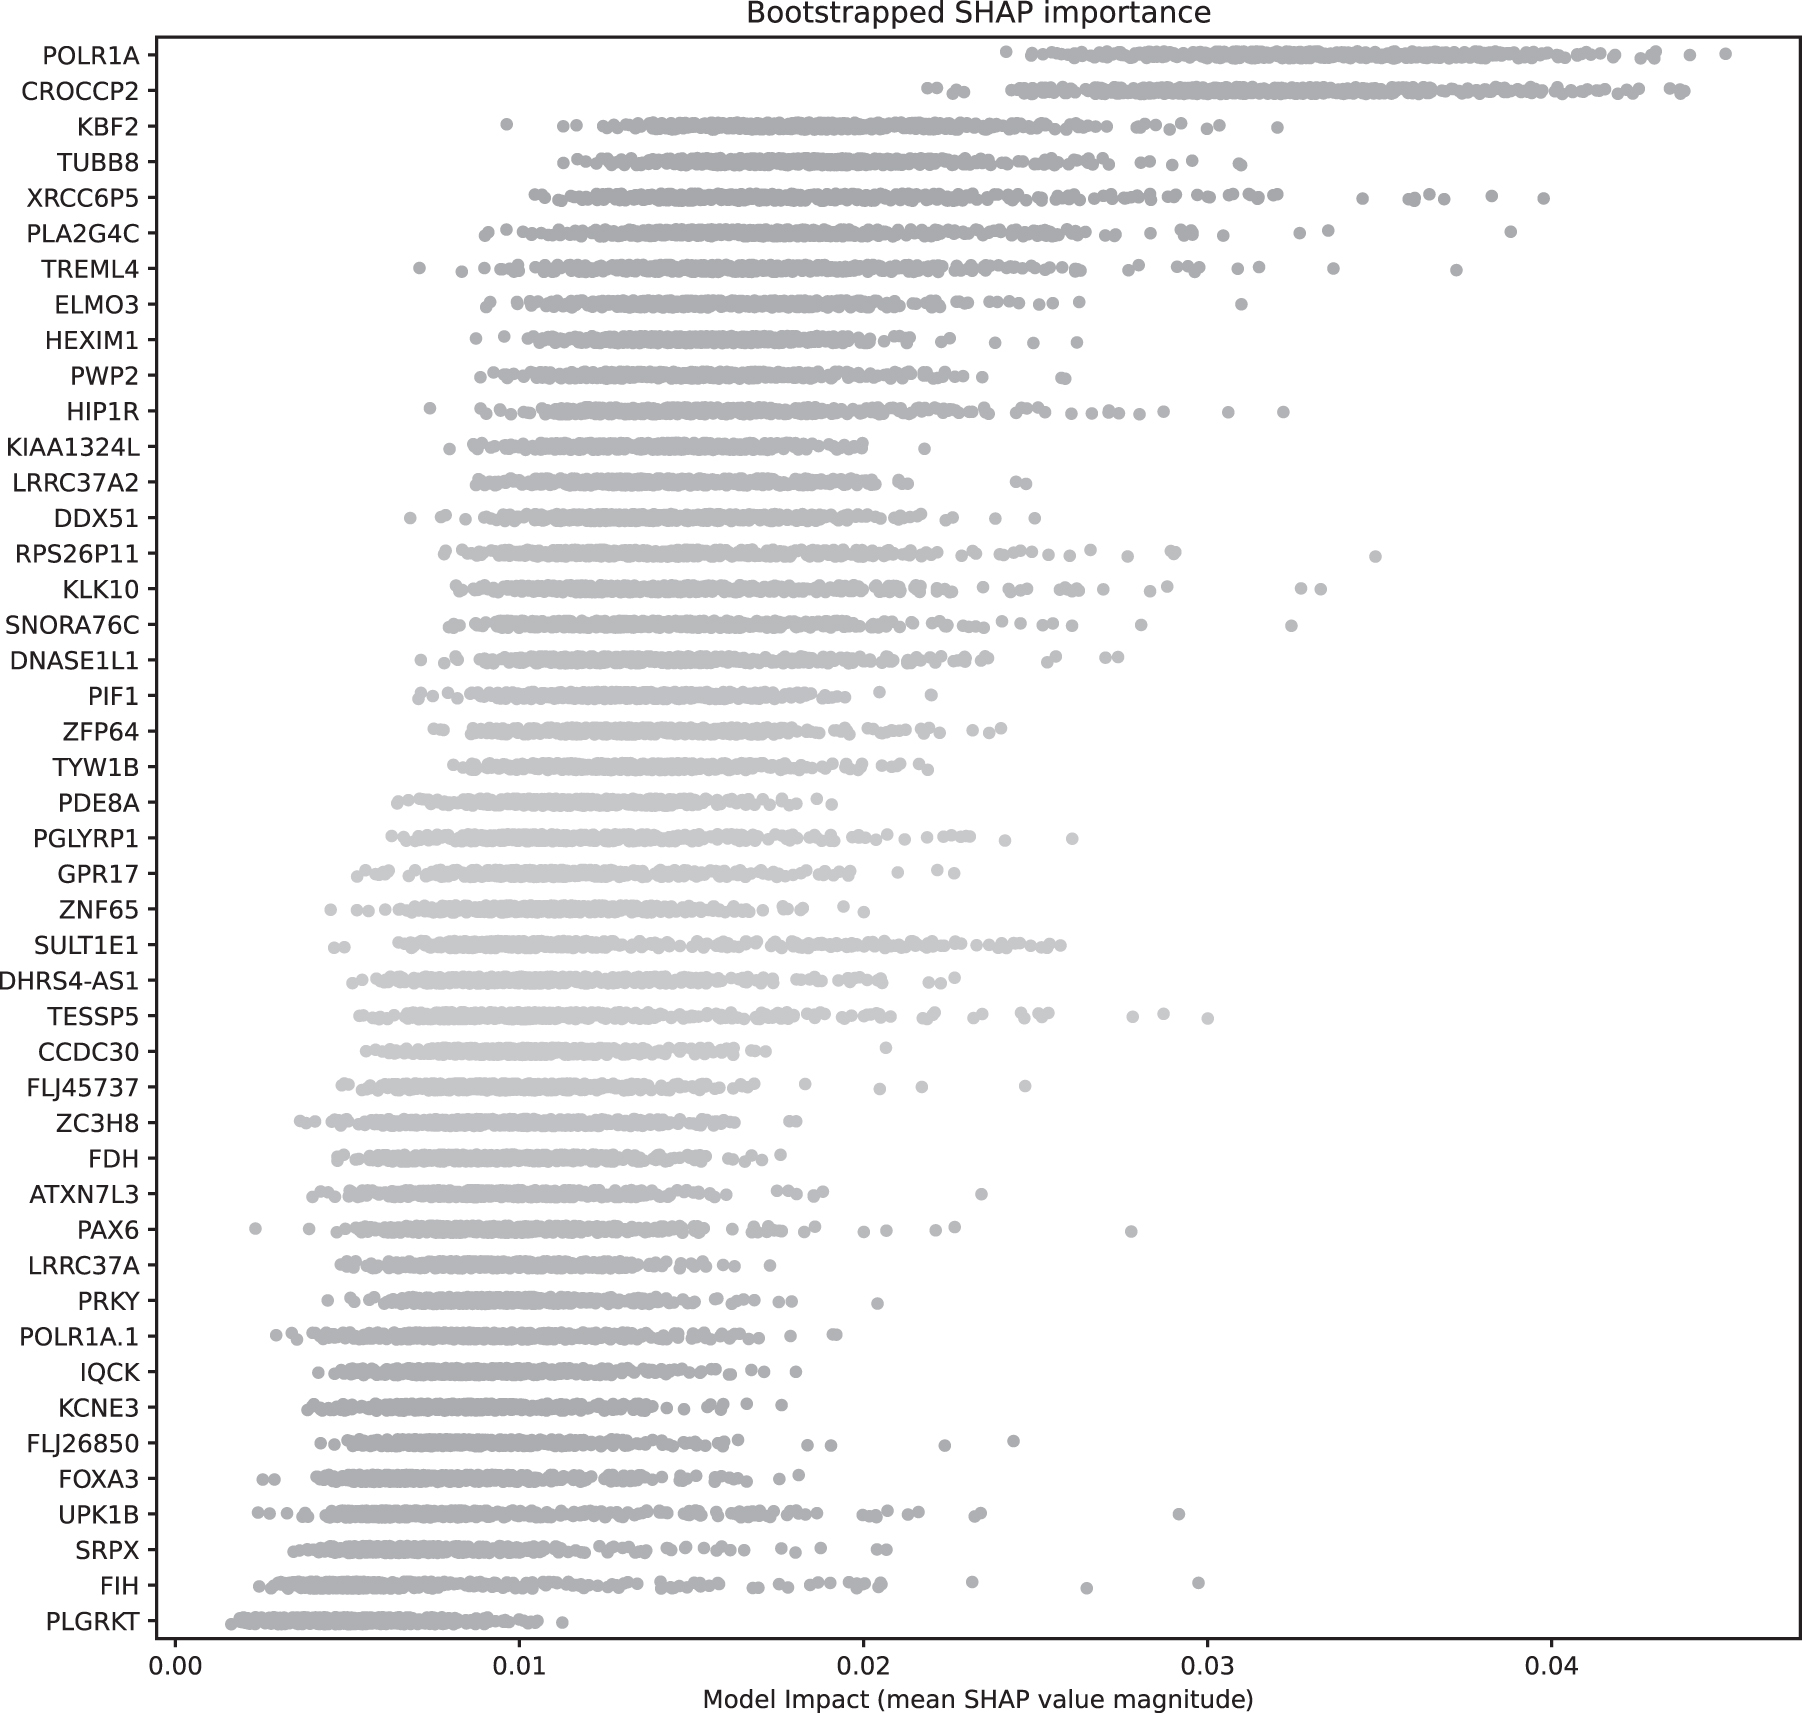
The figure represents the bootstrapped distribution of the SHAP feature importance for each feature/gene. The median value of each bootstrap orders them. SHAP, Shapley Additive Explanation.
2.2.6. Feature evaluation
Finally, each feature was evaluated using Student's t-test for the independence of the mean with false discovery rate (FDR) control using the Benjamini–Hochberg procedure. Features with FDR rates >0.05 were suppressed. All feature selection was performed in a Jupyter notebook (Kluyver et al., 2016), using SciKit-learn (Pedregosa et al., 2011), SciPy (Virtanen et al., 2020), Pandas, Seaborn (Waskom, 2021), and Matplotlib (Hunter, 2007).
2.3. Estimation of feature/genes
The data set consists of gene expression values for 128 samples. Here, we used the term “features” to represent “genes,” and the analysis is conducted in m-dimensional feature space. While formulating the problem, we restricted the analysis to a two-class classification problem. The classes represent with the symbols (+) and (−). A sample set considered
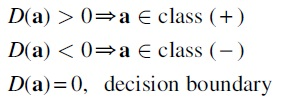
The separation function is:
where w = the weight vector, and b = the bias.
The sign of the separation function D(a) can be interpreted as a difference in gene expression. The positive sign represents the direction of the positive class, and the negative sign represents the direction of the negative class. To understand the pathological role of genes, we considered the signs (+, −) as upregulation and downregulation of gene expression and performed the survival analysis.
2.4. Feature selection using the Kaplan–Meier and log-rank tests
The reduced feature/gene set generated by our SVM-based approach was further considered for the Kaplan–Meier and log-rank tests. The Kaplan–Meier and log-rank tests will help to assess the pathogenicity of the selected features/genes in the poor survival outcome of TNBC in AA women. We considered a microarray data set of breast cancer women with survival data to perform the analysis. We collected the triple-negative breast cancer samples from the breast cancer data set, considering the samples having negative ER, PR, and HER2 receptor status. We considered a cutoff value for each feature/gene and performed the Kaplan–Meier and log-rank tests. The feature with a p-value <0.09 was considered for further discussion and included in building a signature biomarker list to understand the racial disparity in TNBC.
2.5. Differential gene expression analysis using DESeq2
We performed the differential gene expression analysis to check the expression status and significance of the gene set generated by our SVM-based feature selection method. The idea behind the differential gene expression analysis is to validate the results generated from our SVM-based approach. We considered the DESeq2 (Love et al., 2014) tool to perform differential expression analysis between EA women and AA women having TNBC. Furthermore, we selected the genes having log2foldchange greater and less than +1.5 and −1.5 with a p-adjusted value <0.05 to get the upregulated and downregulated genes. Finally, we mark the status of the genes generated from our SVM-based model and report the results.
3. RESULTS AND DISCUSSION
In this section, we discussed our results; in Section 3.1, we discussed the step-wise approach for selecting 24 genes by our SVM method. In Section 3.2, we discussed our validation method's results, including the SHAP scores. We reported the survival analysis results for the selected genes in Section 3.4. The gene expression status and statistics are reported in Section 3.3. Finally, we discussed the association of gene expression and survival outcome in Section 3.5.
3.1. Selection of final features
We considered the RNA-seq gene expression data of 128 women's tumor samples having triple-negative breast cancer to study the biomolecular mechanism behind the racial disparity between EA women and AA women. Our data set has gene expression counts for 87 EA women and 41 AA women samples. Our study's sample/data point has 20,530 gene expression read-count values. When we performed the primary analysis to separate the classes into EA and AA considering each gene/feature, we found that no single gene/feature can divide the data into two categories.
After that, we selected 95 genes/features using an L1 regularized classifier that can separate the gene expression data into 2 classes. We performed Spearman's rho correlation analysis to compute the pairwise correlation among the features. Then, we applied Ward's method with a specific threshold to generate 45 clusters using the pairwise correlation values. We selected one feature from each cluster and continued the recursive feature elimination procedure with cross-validation. Finally, we selected 24 genes/features with a final mean accuracy score of 98% (Fig. 3).
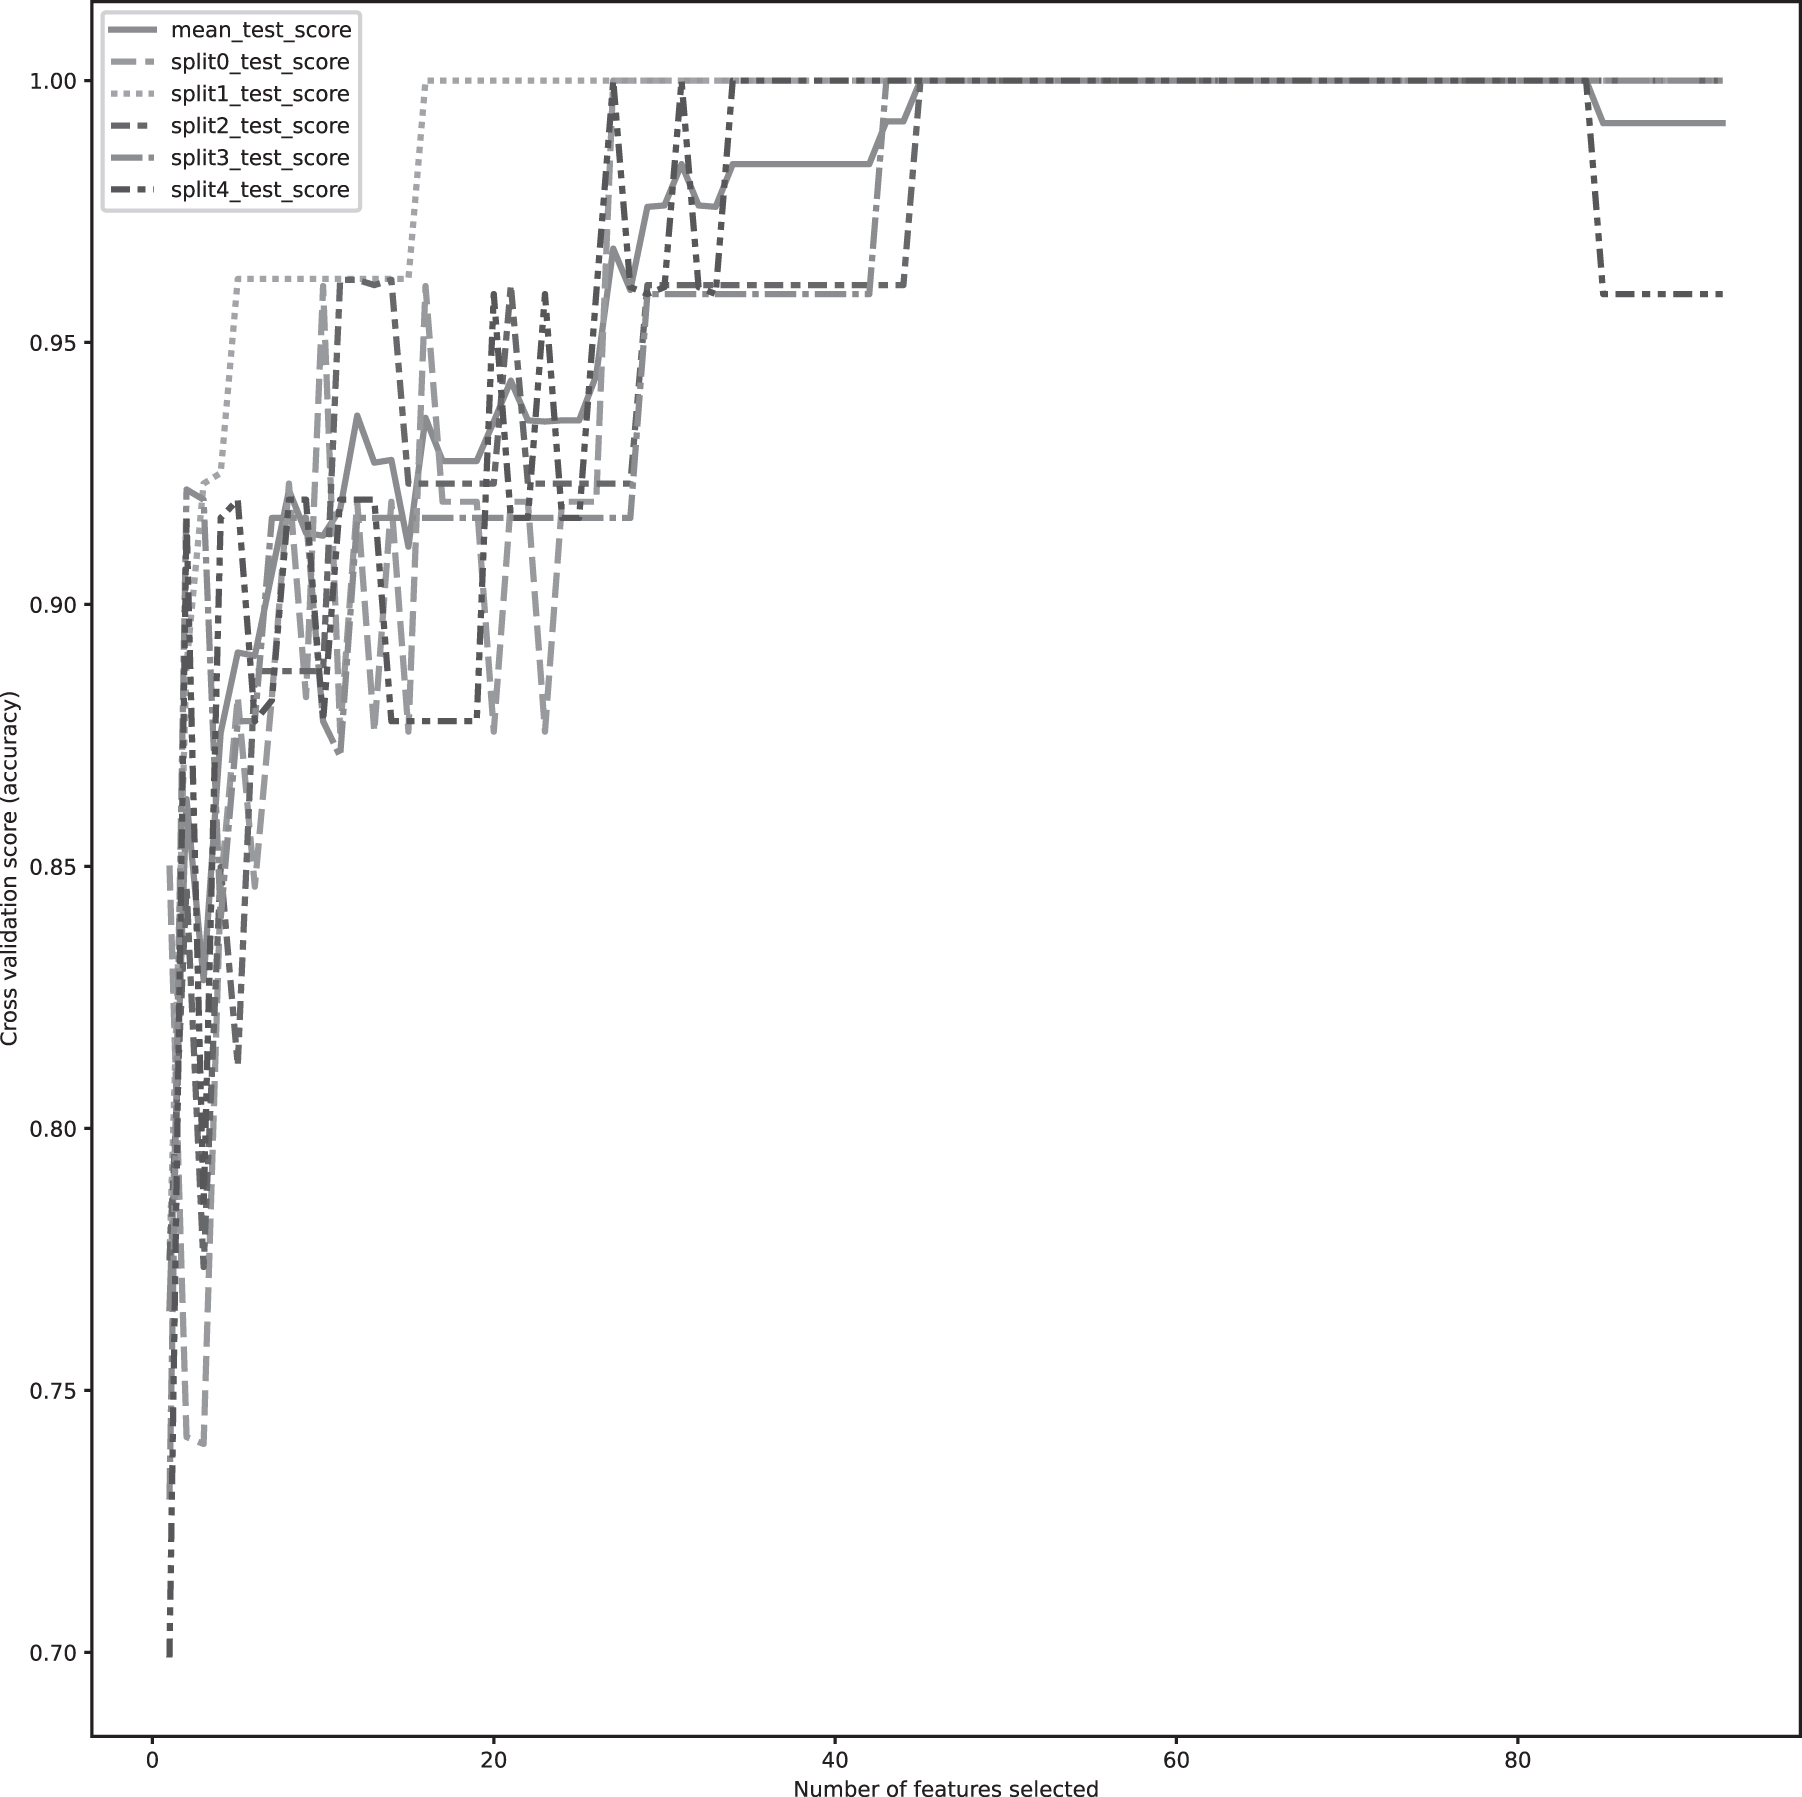
The figure shows the 98% mean accuracy of SVM classification with 24 features during recursive feature selection.
3.2. Validation of features
The final 24 features showed approximately a perfect separation of 2 classes, EA and AA. The fivefold cross-validation of the final 24 genes/features is represented in Table 1. We observed that the first, fourth, and fifth cross-validation have a similar value of balanced accuracy, receiver operating characteristic curve (ROC), area under the curve (AUC), and weighted F1 score. The effect of the features is evaluated with SHAP values. The bootstrap SHAP distribution for 24 features is illustrated in Figure 2. The SHAP values show that CROCCP2 and POLR1A genes strongly influence the classification model. The permutation test results only generated 4 out of 24 features at a 5% level. The four features generated by the permutation test are POLR1A, CROCCP2, KBF2, and SULTIE1.
Cross-Validation of the Final Support Vector Machine Classifier
3.3. Gene expression status
The gene expression status and upregulation and downregulation of our final 24 genes are reported in Figure 4 and Table 2. The status of each gene in the proposed method is computed in the feature estimation step. The gene that has a (+) sign is considered an upregulated gene, and a (−) sign is considered a downregulated gene. We reported and discussed the expression status of KLK10 and LRRC37A2 from our final 24 features deregulated in EA and AA samples significantly. We validated our method by comparing the results with a popular differential expression analysis tool, DESeq2. The significant gene generated by DESeq2 is reported in Table 3. The table has information about KLK10 expression and p-adjusted values.
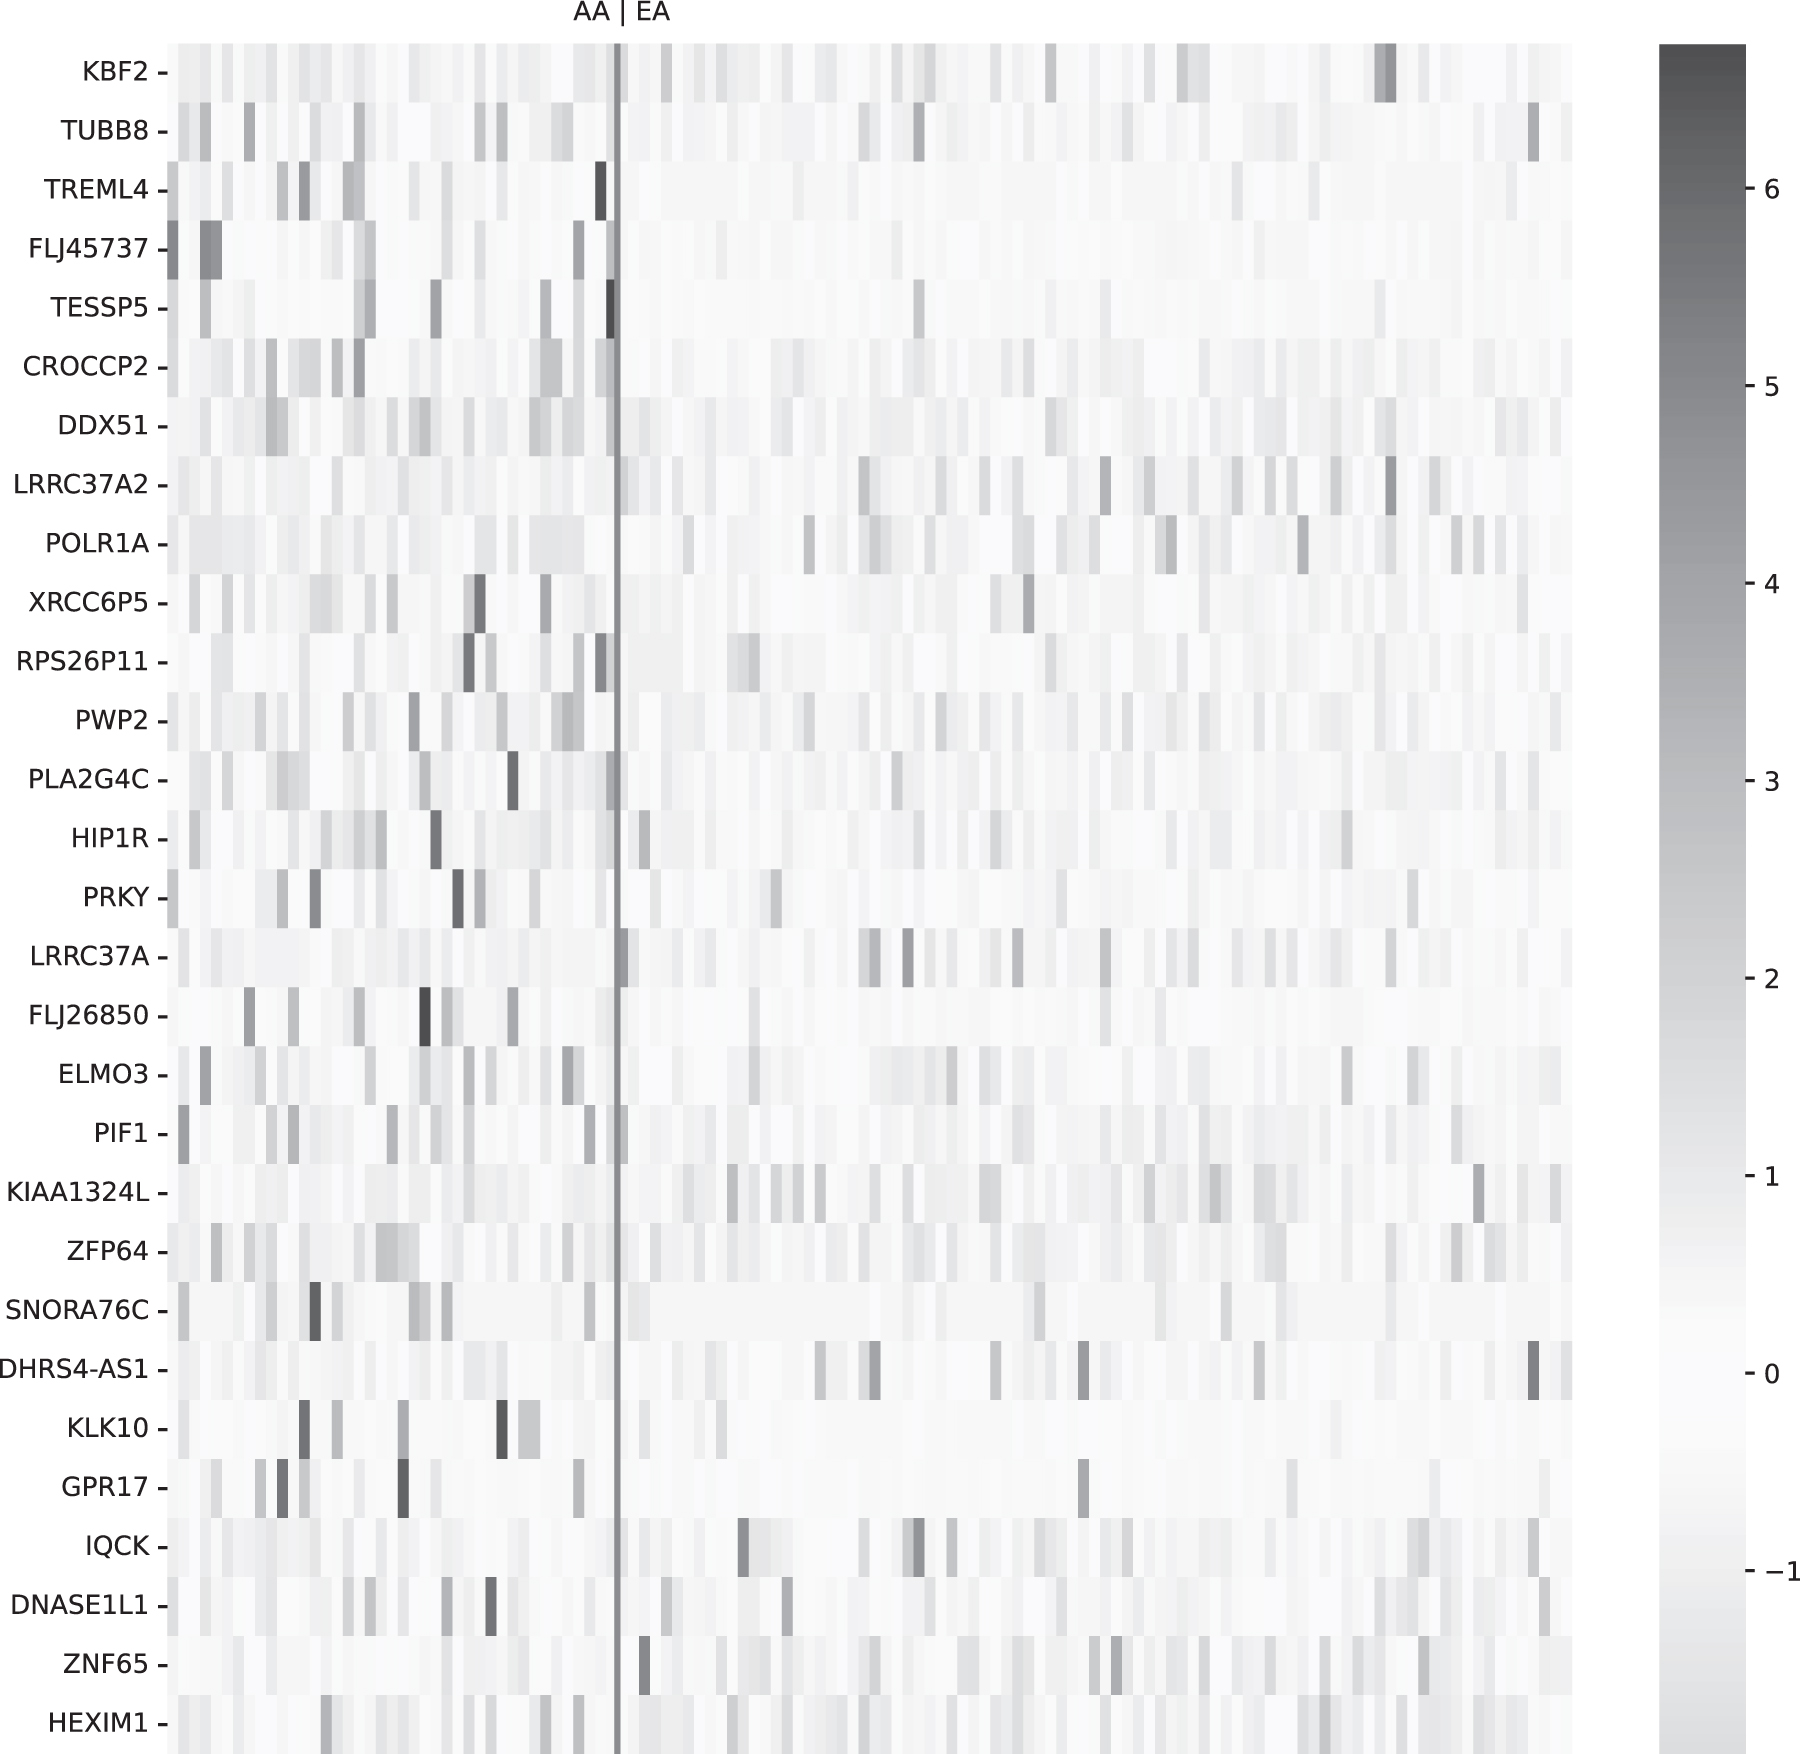
The heat map represents the expression of 24 features/genes selected by our SVM-based method. The dark line in the heat map separates AA women from EA women. AA, African American; EA, European American.
Gene Expression Status in European American Women and African American Women
Student's t-test investigated the expression difference for each gene for independence of means with FDR correction by the Benjamini–Hochberg procedure.
AA, African American; EA, European American; FDR, false discovery rate; H, high expression; L, low expression.
Upregulated Genes in African American Women Compared with European American Women with Log2FoldChange >1.5 and p-Adjusted Value <0.05
The analysis is performed using DESeq2.
3.4. Survival analysis
We performed the Kaplan–Meier survival analysis and log-rank test to understand the pathogenicity of the 24 genes generated by our SVM-based model. The survival analysis on gene expression status (low vs. high) helps us understand each gene's role in TNBC. We found that 12 out of 24 genes have significant p-value (<0.05) from the Kaplan–Meier analysis and log-rank test. The hazard ratio (HR) and log-rank test p-value for the 12 genes are reported in Table 4. Furthermore, we considered the gene expression (low or high) in EA and AA women to correlate the pathogenic role and racial disparity. In this study, we discussed the pathogenic role of KLK10 and LRRC37A2 with expression in EA and AA samples.
Hazard Ratio and Log-Rank Test p-Value for the 12 Genes
Of 24 genes selected by our method, only 12 genes have significant survival differences with p-value <0.05.
HR, hazard ratio.
3.5. Association of gene expression with survival outcome
In this section, we discussed the role of KLK10 and LRRC37A2 in cancer progression, especially in triple-negative breast cancer. We try to speculate the correlation of poor survival outcome with deregulated gene expression in AA women compared with EA women having TNBC.
3.5.1. KLK10
Our SVM-based feature selection and expression analysis show that KLK10 has high expression in AA women compared with EA TNBC women. KLK10 is one of the nonclassical family members of the kallikrein-related peptidases (KLKs). The KLKs are well known for playing a significant role in cancer progression. The KLK10's expression is found in normal mammary epithelial cells. Therefore, KLK10 is also referred to as the normal epithelial cell-specific 1 (NSE1) gene. KLK10 is reported as a potential biomarker for cancer (Borgoño and Diamandis, 2004; Kioulafa et al., 2009). KLK10 is a significant biomarker with CA125 for understanding the diagnosis and prognosis of ovarian cancer (Batra et al., 2010; White et al., 2010; Dong et al., 2013; Geng et al., 2017; El Sherbini et al., 2018).
High expression of KLK10 mRNA plays an important role in colorectal and pancreatic cancer (Rückert et al., 2008; Alexopoulou et al., 2013). Low expression of KLK10 is reported in testicular and breast cancer (Yousef et al., 2005; Kioulafa et al., 2009; Lin et al., 2020). In TNBC, the study (Liu et al., 2022) reported that KLK10's high expression promoted tumor growth and cancer progression. In the log-rank test, we found that increased expression of KLK10 shows poor survival in triple-negative breast cancer (HR = 2.41, p < 0.08; Fig. 5). The KM curve that drags attention to the upregulation of KLK10 in AA women compared with EA women may be the reason for the poor survival outcome and can be considered a biomarker for this racial disparity study. However, we believe that more in-depth analysis will reveal more about it.
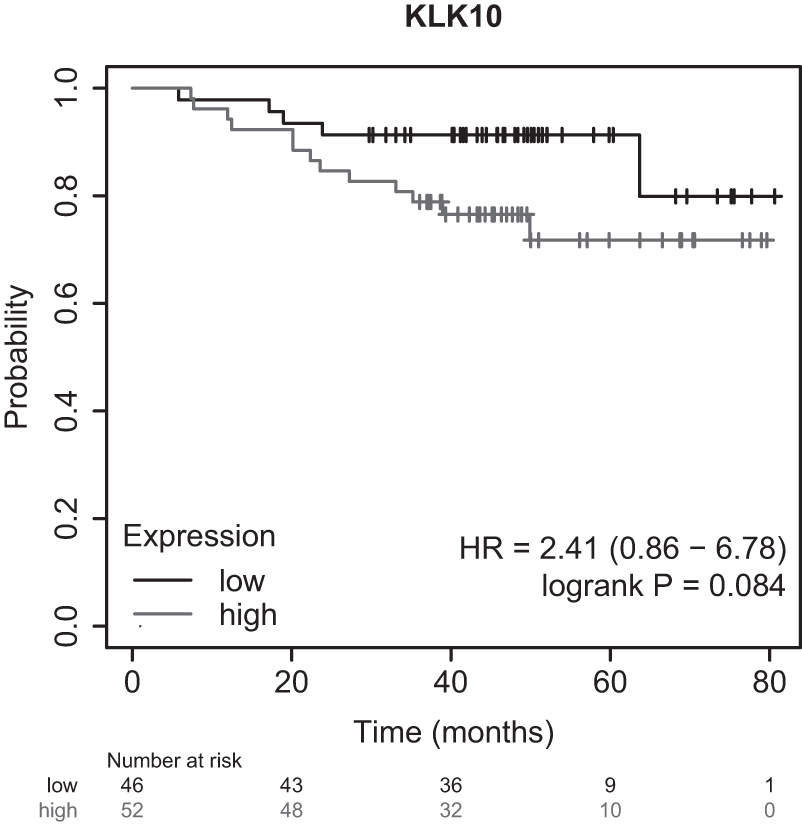
The figure shows that the high expression of KLK10 shows poor overall survival in the TNBC patients with p-value <0.09 and HR = 2.41 (0.86–6.78). In the above plot, the lighter line represents the TNBC samples with high KLK10 expression, and the dark line represents the TNBC samples with low KLK10 expression. HR, hazard ratio.
3.5.2. LRRC37A2
In this study, the proposed gene selection method shows that LRRC37A2 has low expression in AA women compared with EA women. The gene LRRC37A2 belongs to the LRR37 family of genes. The name LRRC37A2 comes from a leucine-rich repeat-containing 37-member A2 (Giannuzzi et al., 2012; Wisnieski et al., 2021). LRRC37A2 regulates the protein and ligand interaction. It is associated with noncancer diseases, Parkinson's disease, and epilepsy (Yao et al., 2021). High expression of LRRC37A2 shows poor survival and is considered a member of the gene signature for predicting lymphoma (Xu et al., 2022). LRRC37A2 is associated with ovarian and gastric cancer progression (Wisnieski et al., 2021).
It is also reported in several breast cancer-related studies (Wu et al., 2018; Feng et al., 2020). One of the studies specifically related to finding deregulated genes in AA and EA women in TNBC reported LRRC37A2 (Stewart et al., 2013). In our kM and log-rank test, low expression of LRRC37A2 shows poor survival in triple-negative breast cancer samples (HR = 0.36, p < 0.05). From KM curve (Fig. 6), we can speculate that the downregulation of LRRC37A2 in AA women compared with EA women may be the reason for the poor survival outcome and can be considered a biomarker for this racial disparity study. However, we believe that more in-depth analysis will provide more information about the role of LRRC37A2.

The figure shows that the high expression of LRRC37A2 shows poor overall survival in the TNBC patients with p-value <0.09 and HR = 0.36 (0.14–0.92). In the above plot, the lighter line represents the TNBC samples with high LRRC37A2 expression, and the darker line represents the TNBC samples with low LRRC37A2 expression.
4. CONCLUSION
Triple-negative breast cancer is a highly heterogeneous subtype among the other subtypes of breast cancer with aggressive tumor progression and poor survival outcomes. As a consequence of this, TNBC has limited treatment options in clinics. The current vital challenge for the breast cancer community is to discover targetable biomarker playing a significant role in TNBC progression that can be useful in clinics. Epidemiological and clinical studies reported that TNBC has different consequences in terms of race. African descent women have a higher mortality rate compared with European descent women.
Unfortunately, this adds a racial disparity challenge to the current puzzle of TNBC research. The clinical and epidemiological studies evidence reveals that the environmental and genetic elements are responsible for the aggressive progression of tumors and poor survival in AA women. Breast cancer research is going on several fronts to discover some biomarkers accountable for this racial disparity in TNBC to give better treatment options to AA women. Integrative genomics and proteomics studies can be a vital option for this study to discover a comprehensive underlying biomolecular mechanism.
With the help of next-generation sequencing technology, the triple-negative breast cancer community generated an unprecedented amount of whole transcriptome and genome data for various cell lines and patient samples to study cancer at the nucleic acid level. In the NGS data processing journey, state-of-the-art computational algorithms and machine learning models aided the research community in understanding the molecular heterogeneity of TNBC. As a result of that, TNBC is divided into various subtypes considering the tumor parameters such as gene, protein, immune cell, and pathway expression. However, the current approach to NGS data processing has limitations and vagueness in selecting the methods to process the data.
This research aims to develop a method to identify critical biomarkers responsible for the racial disparity in TNBC among EA and AA women and, unfortunately, a poor outcome in AA women. We proposed an SVM-based method with recursive feature elimination to select the biomarkers for this study. We also computed the pairwise correlation using Spearman's rho method and clustered the features using Ward's. Finally, we found 24 features/genes that can classify AA and EA TNBC samples with 98% accuracy. The pathological role of the 24 features/gene was further validated using a microarray data set having survival information. The Kaplan–Meier and log-rank tests show that 12 out of our final 24 genes have a significant pathological role in TNBC.
In this study, we cherry-picked two genes, KLK10 and LRRC37A2, and reported the consequence of their deregulated expression leading to poor survival in AA women. Besides our survival analysis results, cancer research studies report that high expression of KLK10 is known for metastasis and cancer progression, and low expression of LRRC37A2 aids in cancer procession. KLK10 and LRRC37A2 were also reported as essential biomarker in triple-negative breast cancer research.
Our proposed SVM-based gene selection model not only captured these two genes but also clearly showed the expression status that is high expression of KLK10 and low expression of LRRC37A2 in AA samples compared with EA TNBC samples. In traditional gene expression analysis, getting significant genes directly from an analysis is complex and requires prior biological and statistical knowledge. However, we also agree that further improvement of our model and wet laboratory experiments requires getting a significant biomarker list that will accurately use as a target in clinics to provide better treatment options to AA TNBC women.
AVAILABILITY OF DATA AND MATERIALS
Data sets and Jupyter notebook hosted at GitHub: https://github.com/xzy3/SVM-TNBC-racial-disparity
Footnotes
AUTHORs' CONTRIBUTIONS
B.S. prepared the data set, validated and analyzed ML results, and wrote the article. Z.P. analyzed the results and wrote the article. S.S. performed data machine learning (ML) analysis and wrote the article. A.Z. supervised the project.
AUTHOR DISCLOSURE STATEMENT
The authors declare they have no conflicting financial interests.
FUNDING INFORMATION
B.S. was partially supported by a GSU Molecular Basis of Disease Fellowship. A.Z. was partially supported from the NSF Grant CCF-2212508 and the NIH Grant 1R21CA241044-01A1.