
Abstract
Intratumoral heterogeneity and the presence of cancer stem cells are challenging issues in cancer therapy. An appropriate quantification of the stemness of individual cells for assessing the potential for self-renewal and differentiation from the cell of origin can define a measurement for quantifying different cell states, which is important in understanding the dynamics of cancer evolution, and might further provide possible targeted therapies aimed at tumor stem cells. Nevertheless, it is usually difficult to quantify the stemness of a cell based on molecular information associated with the cell. In this study, we proposed a stemness definition method with one-class Hadamard kernel support vector machine (OCHSVM) based on single-cell RNA sequencing (scRNA-seq) data. Applications of the proposed OCHSVM stemness are assessed by various data sets, including preimplantation embryo cells, induced pluripotent stem cells, or tumor cells. We further compared the OCHSVM model with state-of-the-art methods CytoTRACE, one-class logistic regression, or one-class SVM methods with different kernels. The computational results demonstrate that the OCHSVM method is more suitable for stemness identification using scRNA-seq data.
INTRODUCTION
Intratumoral heterogeneity is among the greatest challenges in precision cancer therapy. Tumors are extremely heterogeneous and contain various subpopulation cells that response differently to cancer therapy. There is a population of cancer stem cells that are highly resistant to current therapeutic approaches. The cancer stem cells persist during therapy, contribute to relapse, develop to mix type of cancers, and are capable of recapitulating the heterogeneous features in a tumor (Damavandi et al., 2023; Le et al., 2018). The evolution of the stemness features of cancer cells is crucial in predicting the effects of cancer therapy (Bao, 2021). However, the determination of tumor stemness is technically challenging. A major hurdle has been the lack of clear methods to quantify the stemness of the tumor environment or individual cells.
The concept of cancer stem cell (CSC) was proposed four decades ago, which states that tumor growth, analogous to the renewal of healthy tissues, was driven by a small number of dedicated stem cells. Many reports on the identification of CSCs have been seen in many cancer types in the last decades (Batlle and Clevers, 2017; Qin et al., 2023). The model of CSC has been developing in these years, and it has gradually become clear that CSCs do not necessarily have to be quiescent; many examples show that they can be abundant and can proliferate vigorously (Batlle and Clevers, 2017; Walcher et al., 2020). CSCs have important therapeutic implications because of their association with cell plasticity, distant metastasis, and drug resistance (Cao et al., 2021; Shibue and Weinberg, 2017; Yejing et al., 2017).
Cancer cells can stochastically transit to different phenotypes toward a dynamical equilibrium in a cellular population (Friedmann-Morvinski and Verma, 2014; Gupta et al., 2010; Su et al., 2017); the phenotypic transition can be a continuous spectrum revealed by single-cell RNA sequencing (Jiang et al., 2021; Macaulay et al., 2016). In Miranda et al. (2018), cancer stemness was calculated using GSVA package to explore the strong correlation with mutation load, cancer-testis antigen expression, and intratumoral heterogeneity. To better understand cancer development, it is important to quantify the ability of self-renewal and differentiation of cancer cells (Tu et al., 2019; Zheng et al., 2021b), that is, quantification of the stemness (Alqarni et al., 2021).
Advances in single-cell sequencing offer an opportunity to study tumor heterogeneity at the resolution of individual cells (Nawy, 2014; Ren et al., 2018). The single-cell RNA sequencing data enable us to better understand the evolution dynamics, including the identification of diverse cellular subpopulations based on variance in gene expressions (Grün et al., 2015; Jiang et al., 2016), the establishment of the cell lineage relationship (Bendall et al., 2014; Farrell et al., 2018), exploring the diversity of infiltrating T cells (Li et al., 2019; Zheng et al., 2017), and the elucidation of cancer development (Ellsworth et al., 2017; Navin et al., 2011). It is natural to ask whether we can quantify the stemness of cancer cells based on single-cell transcriptome data.
In a recent study of therapy-resistant stem cells in chronic myeloid leukemia (CML) (Giustacchini et al., 2017), the authors applied single-cell RNA sequencing to characterize cells that persist in individuals with CML who were treated with tyrosine kinase inhibitors (TKIs). Results show that cellular differences exist in different patients and different CSC populations, which can assist in a further understanding on the stem cell status evolution and tumor heterogeneity during cancer therapy. These observations motivate our study to develop a method to quantify the stemness of cancer cells, and to investigate the evolution of cancer stemness during cancer therapy.
In the recent years, a lot of transcriptome-based methods have been developed for analyzing the potential of cells for self-renewal and differentiation. A core regulatory network was reconstructed based on single-cell RNA-seq data. Through mathematical formulation describing the relationship among the critical genes “KLF8,” “ZEB1,” and “CDH1” (Tu et al., 2019), authors revealed the molecular mechanism of cell fate decisions. StemSC (Zheng et al., 2021b) proposed a stemness index based on relative expression orderings (REOs) of gene pairs. Through selection of genes significantly related to a differentiation process, reference REOs are constructed for evaluation of stemness in cells. It is a knowledge-based stemness evaluation method. In Zheng et al. (2021a), an absolute REO-based stemness index was proposed and shown to be highly correlated with tumor grade and has prognostic ability.
Attention has been paid on developing machine learning approaches for quantifying stemness. In Malta et al. (2018), a one-class logistic regression (OCLR)-based method was proposed to quantify the stemness for features associated with cancer cell dedifferentiation (Sokolov et al., 2016). The OCLR approach can be applied to different data sets, such as transcription, DNA methylation, or epigenetic regulation, and hence can define different type stemness indices. Application of the stemness indices to single-cell data revealed patterns of intratumor molecular heterogeneity, and the dedifferentiated oncogenic phenotype was generally most prominent in metastatic tumors. The OCLR method, comparable with linear support vector machines (SVMs) (Schölkopf et al., 2000), can only describe the linear relationship between different data samples. When the data are nonlinearly related as in many cellular subpopulations, nonlinear methods can be more appropriate to quantify the stemness at the single-cell level.
CytoTRACE (Gulati et al., 2020) was another recently proposed unsupervised learning framework for cellular differentiation evaluation. However, it can only provide a relative degree of differentiation status for cells in specific single-cell RNA sequencing (scRNA-seq) data sets.
In this study, we proposed a nonlinear machine learning method to define the stemness index based on single-cell transcriptome data: the one-class SVM with Hadamard kernel (OCHSVM) method. The Hadamard kernel function (Jiang et al., 2017) for modeling the nonlinear relationship between cells was effectively incorporated in the one-class SVM learning framework. We applied the proposed method to analyze the single-cell RNA sequencing in CML after TKI therapy (Giustacchini et al., 2017), and explore evolution of tumor stemness in response to the therapy. Results show that OCHSVM is robust in terms of cross-validation, and provides a reasonable stemness measure for modeling the differentiation degree of the considered single cells. Stem cells are also present in embryo and various tissues. To validate the proposed stemness index, we further test the OCHSVM stemness with data sets for mammalian embryo stem cells (ESCs) and induced pluripotent stem cells (iPSCs).
The rest of the article is organized as follows. First, we present the framework of one-class SVM and introduced the Hadamard kernel to define the stemness index. The OCHSVM model is trained with normal hematopoietic stem cells (HSCs), and then validated through quantitative performance measures and biological interpretations. Next, we applied the proposed stemness to CSCs obtained from CML patients, and analyzed the stemness distribution for the CML single cells throughout the disease course. We further test the proposed stemness with data sets from mammalian ESCs, iPSCs, and differentiation of human embryonic stem cells, which show the features of distinct different types of cells. Finally, we give the concluding remarks with comparisons between different state-of-the-art methods.
METHODS
Formulation of the stemness
Given a gene expression vector
To this end, we try to find a hyperplane (the “maximum-margin hyperplane”)
Here
To extend the above hard margin to cases in which the data are not linearly separable, we introduced hinge loss parameters
Here v is a parameter that controls the fraction of training data that fall outside of the hypersphere, and
Through the Lagrangian multiplier method, the problem becomes
In the case of nonlinear data separation, we replaced the bilinear function

where
Here, we applied the Hadamard kernel function, and defined a stemness index-based one-class SVM with Hadamard kernel (OCHSVM)
where
The intuition behind the definition is as follows.
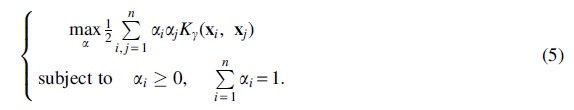
To determine the adjustable parameter
Determine the parameter
There are 134 cells in the training data set. For a given parameter
Stemness of tumor stem cells in CML
We calculated the stemness of cancer cells from patients with CML after TKI treatment. CML is mainly caused by the presence of the BCR-ABL fusion gene and is often treated by TKI (Pasic and Lipton, 2017). The existence of CML stem cells (CML-SCs) is the main reason for the resistance to TKI therapy (Chu et al., 2011; Paolo et al., 2011), and can lead to frequent relapse following treatment discontinuation (Holyoake and Vetrie, 2017; Mahon et al., 2010; Zhang and Li, 2019). Here, we considered a data set of scRNA-seq data for more than 2000 CML-SCs selected with

Stemness of cancer stem cells in CML patients.
The stemnesses remain at relatively high levels (>0.4), which is in agree with the selection condition of
Prolonged TKI treatment may result in the selective persistence of distinct and highly quiescent BCR-ABL+ CML-SCs (group A), and the proportion of group B BCR-ABL+ SCs decreases. Hence, the stemness of BCR-ABL+ SCs evolved similar to that of BCR-ABL− SCs. Increasing of the stemness from 12 to 18 m after TKI therapy may be associated with the selection of this resistant and quiescent CML-SC subset.
We further measure the heterogeneity of CML-SCs through the distribution of stemnesses of all cells (Fig. 2B). The stemness of all sampled cells varies from 0.4 to 1.0, and showed a unimodal distribution for both BCR-ABL+ and BCR-ABL− cells. Hence, the stemness cannot distinguish the two cluster cells as shown in Giustacchini et al. (2017). Previous studies have shown that the heterogeneity of cells can be recovered by a subpopulation of homogeneous cells after about 2 weeks of cell culturing, which indicates the transition of cell states during cell regeneration due to transcriptome-wide noise (Chang et al., 2008; Li et al., 2016). The heterogeneity and the transition of cell stemness during cell cycling are essential for cancer development (Lei, 2020).
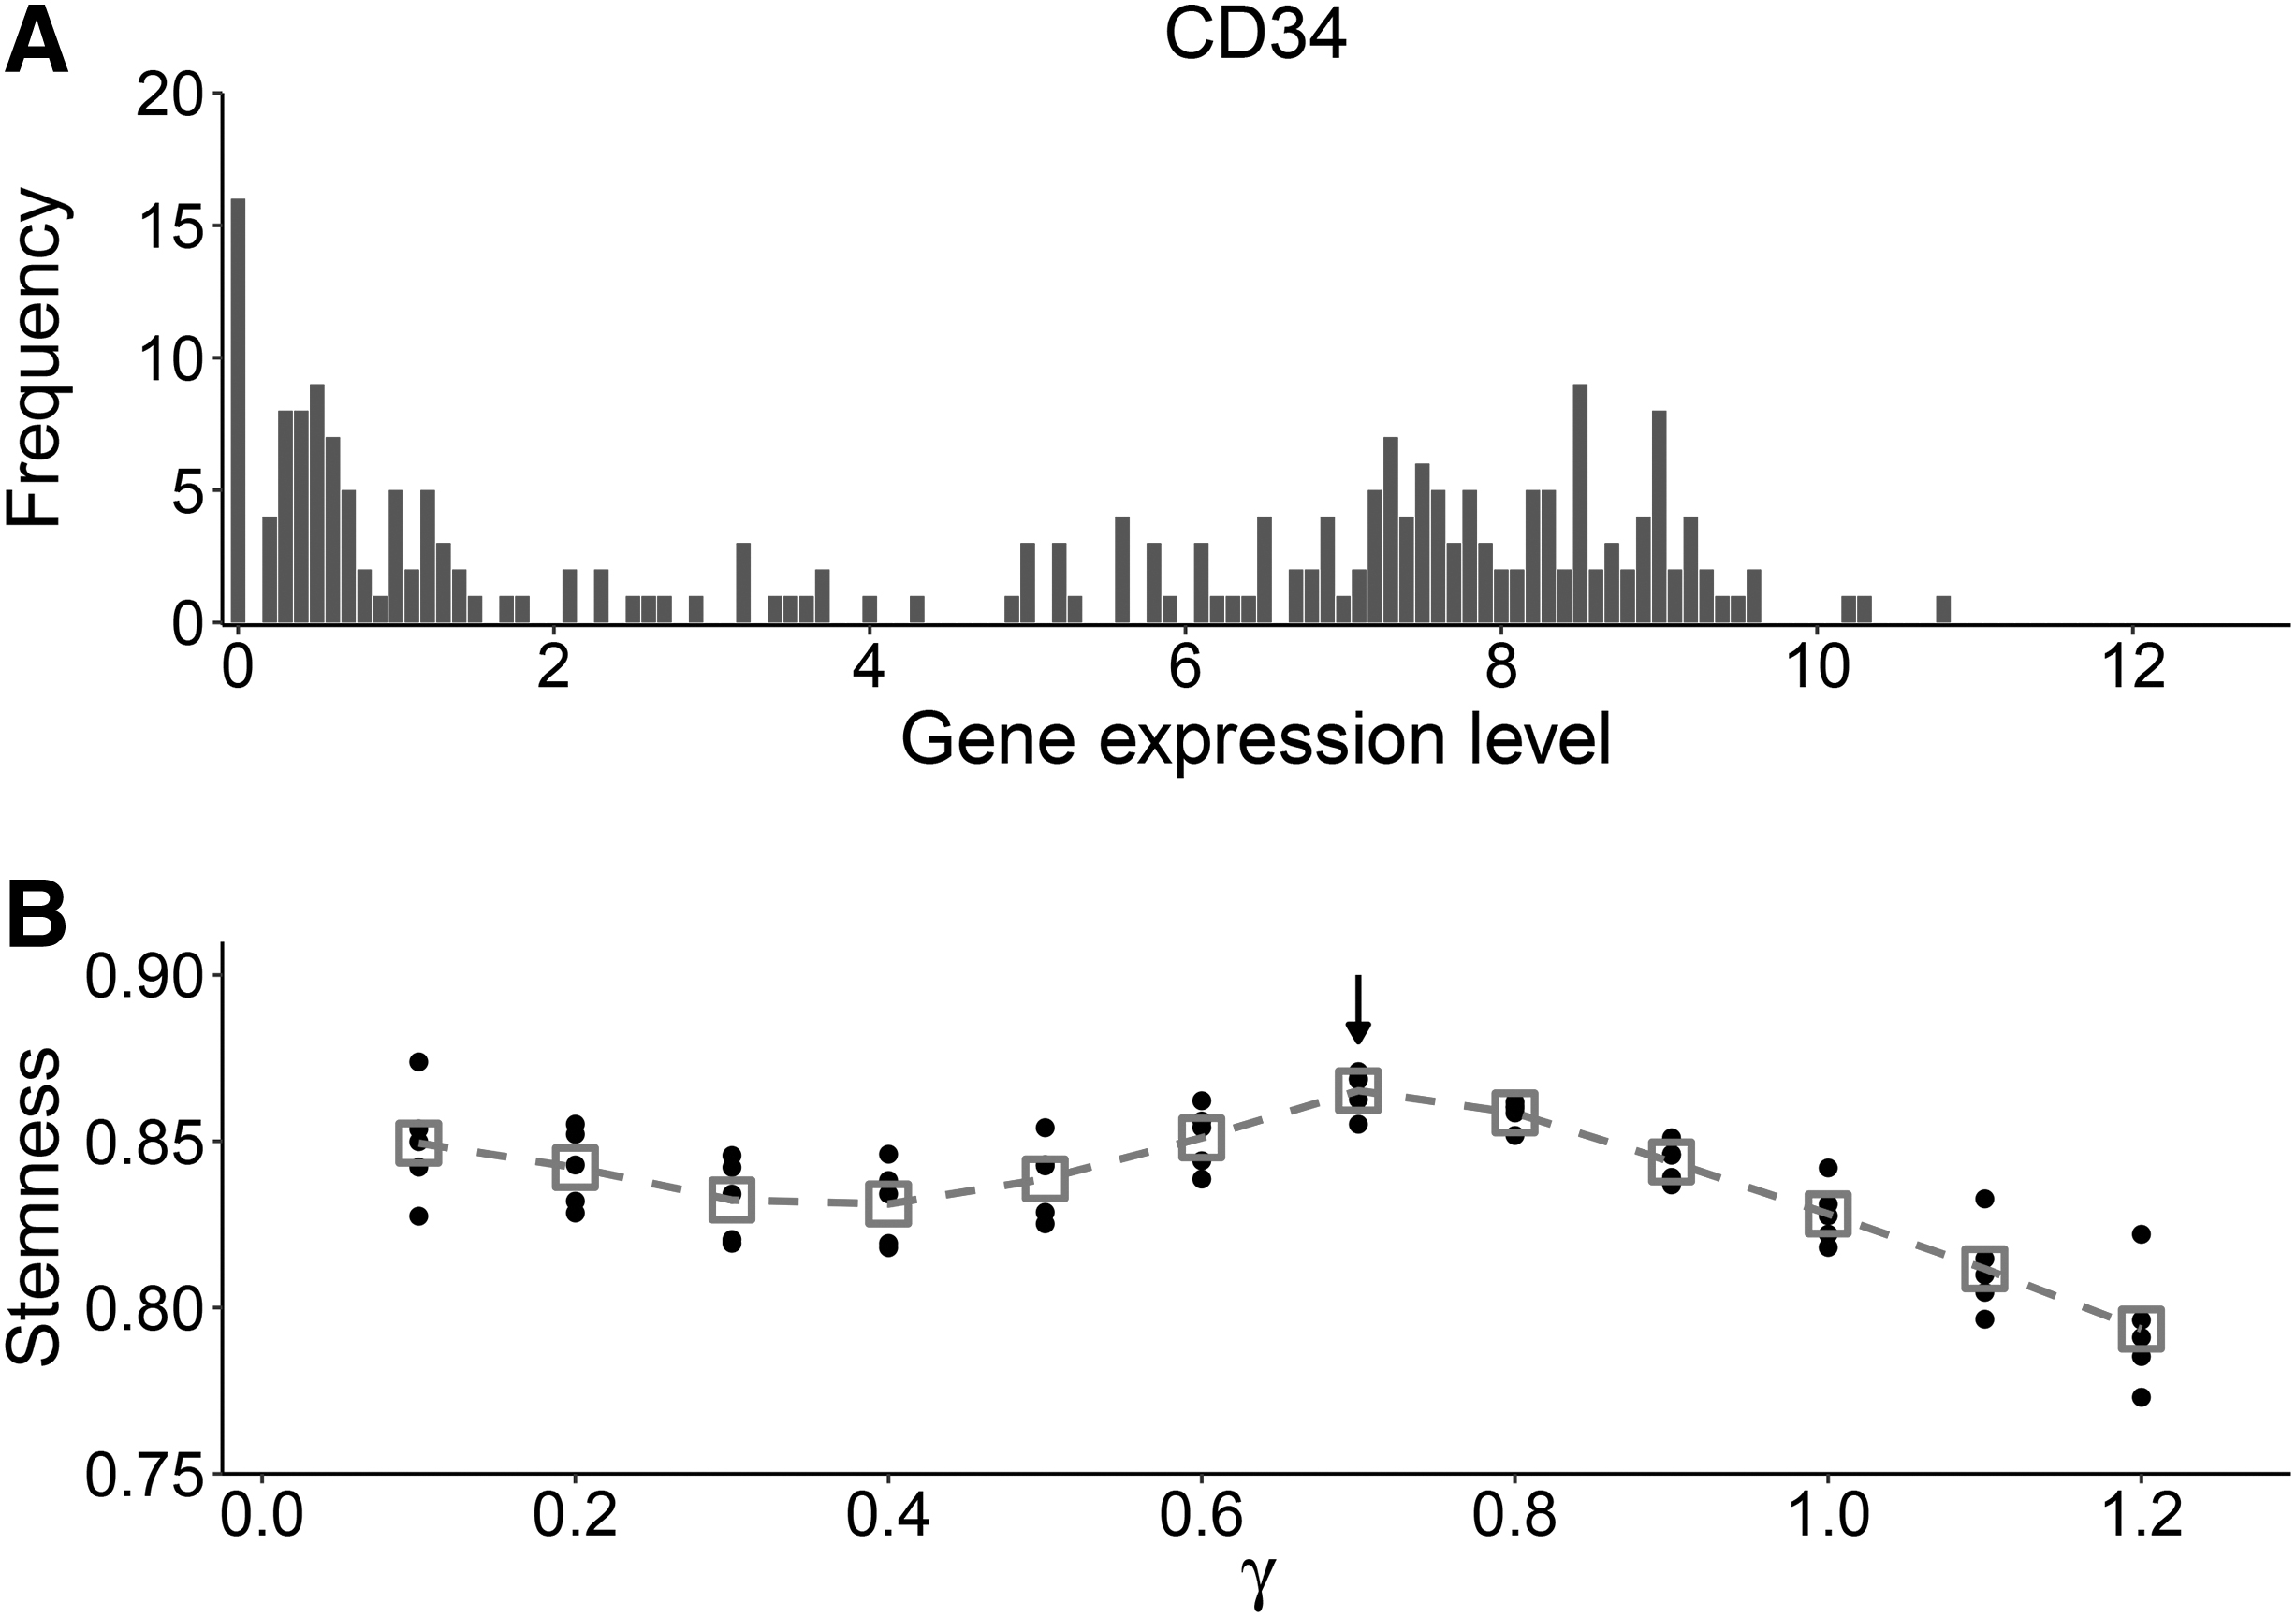
We applied the proposed stemness to study the progress of human preimplantation, considering that the data set GSE36552 contains 121 individual cells from human preimplantation embryos (Yan et al., 2013). The cells cover six early developmental stages: zygote (3 cells), 2-cell stage (6 cells), 4-cell stage (12 cells), 8-cell stage (20 cells), morula (16 cells), late blastocyst at hatching stage (30 cells), and the seventh stage of primary outgrowth during human embryonic stem cell (hESC) derivation (34 cells). We calculated the OCHSVM stemness of all cells based on the training set with zygote cells, shown in Figure 3.
Stemness of human preimplantation embryo cells at different stages. Dots show the OCHSVM stemness of cells at different stages, and the box plots show the spread and centers for the stemnesses at different stages.
From Figure 3 we can see that the stemnesses of cells at different stages decrease from zygote to hESCs, which is in accordance with the formation of ESCs from zygote during preimplantation. During mammalian early embryo development, the cells undergo epigenetic reprogramming so that the epigenetic markers are erased and rebuilt at the early stage from zygote to the ESCs (Liu et al., 2016; Zhang et al., 2016). Figure 3 shows the evolution of stemness values in cells during embryo development, and reach a relatively low level at the state of hESC, in agree with the epigenetic reprogramming during early embryo development.
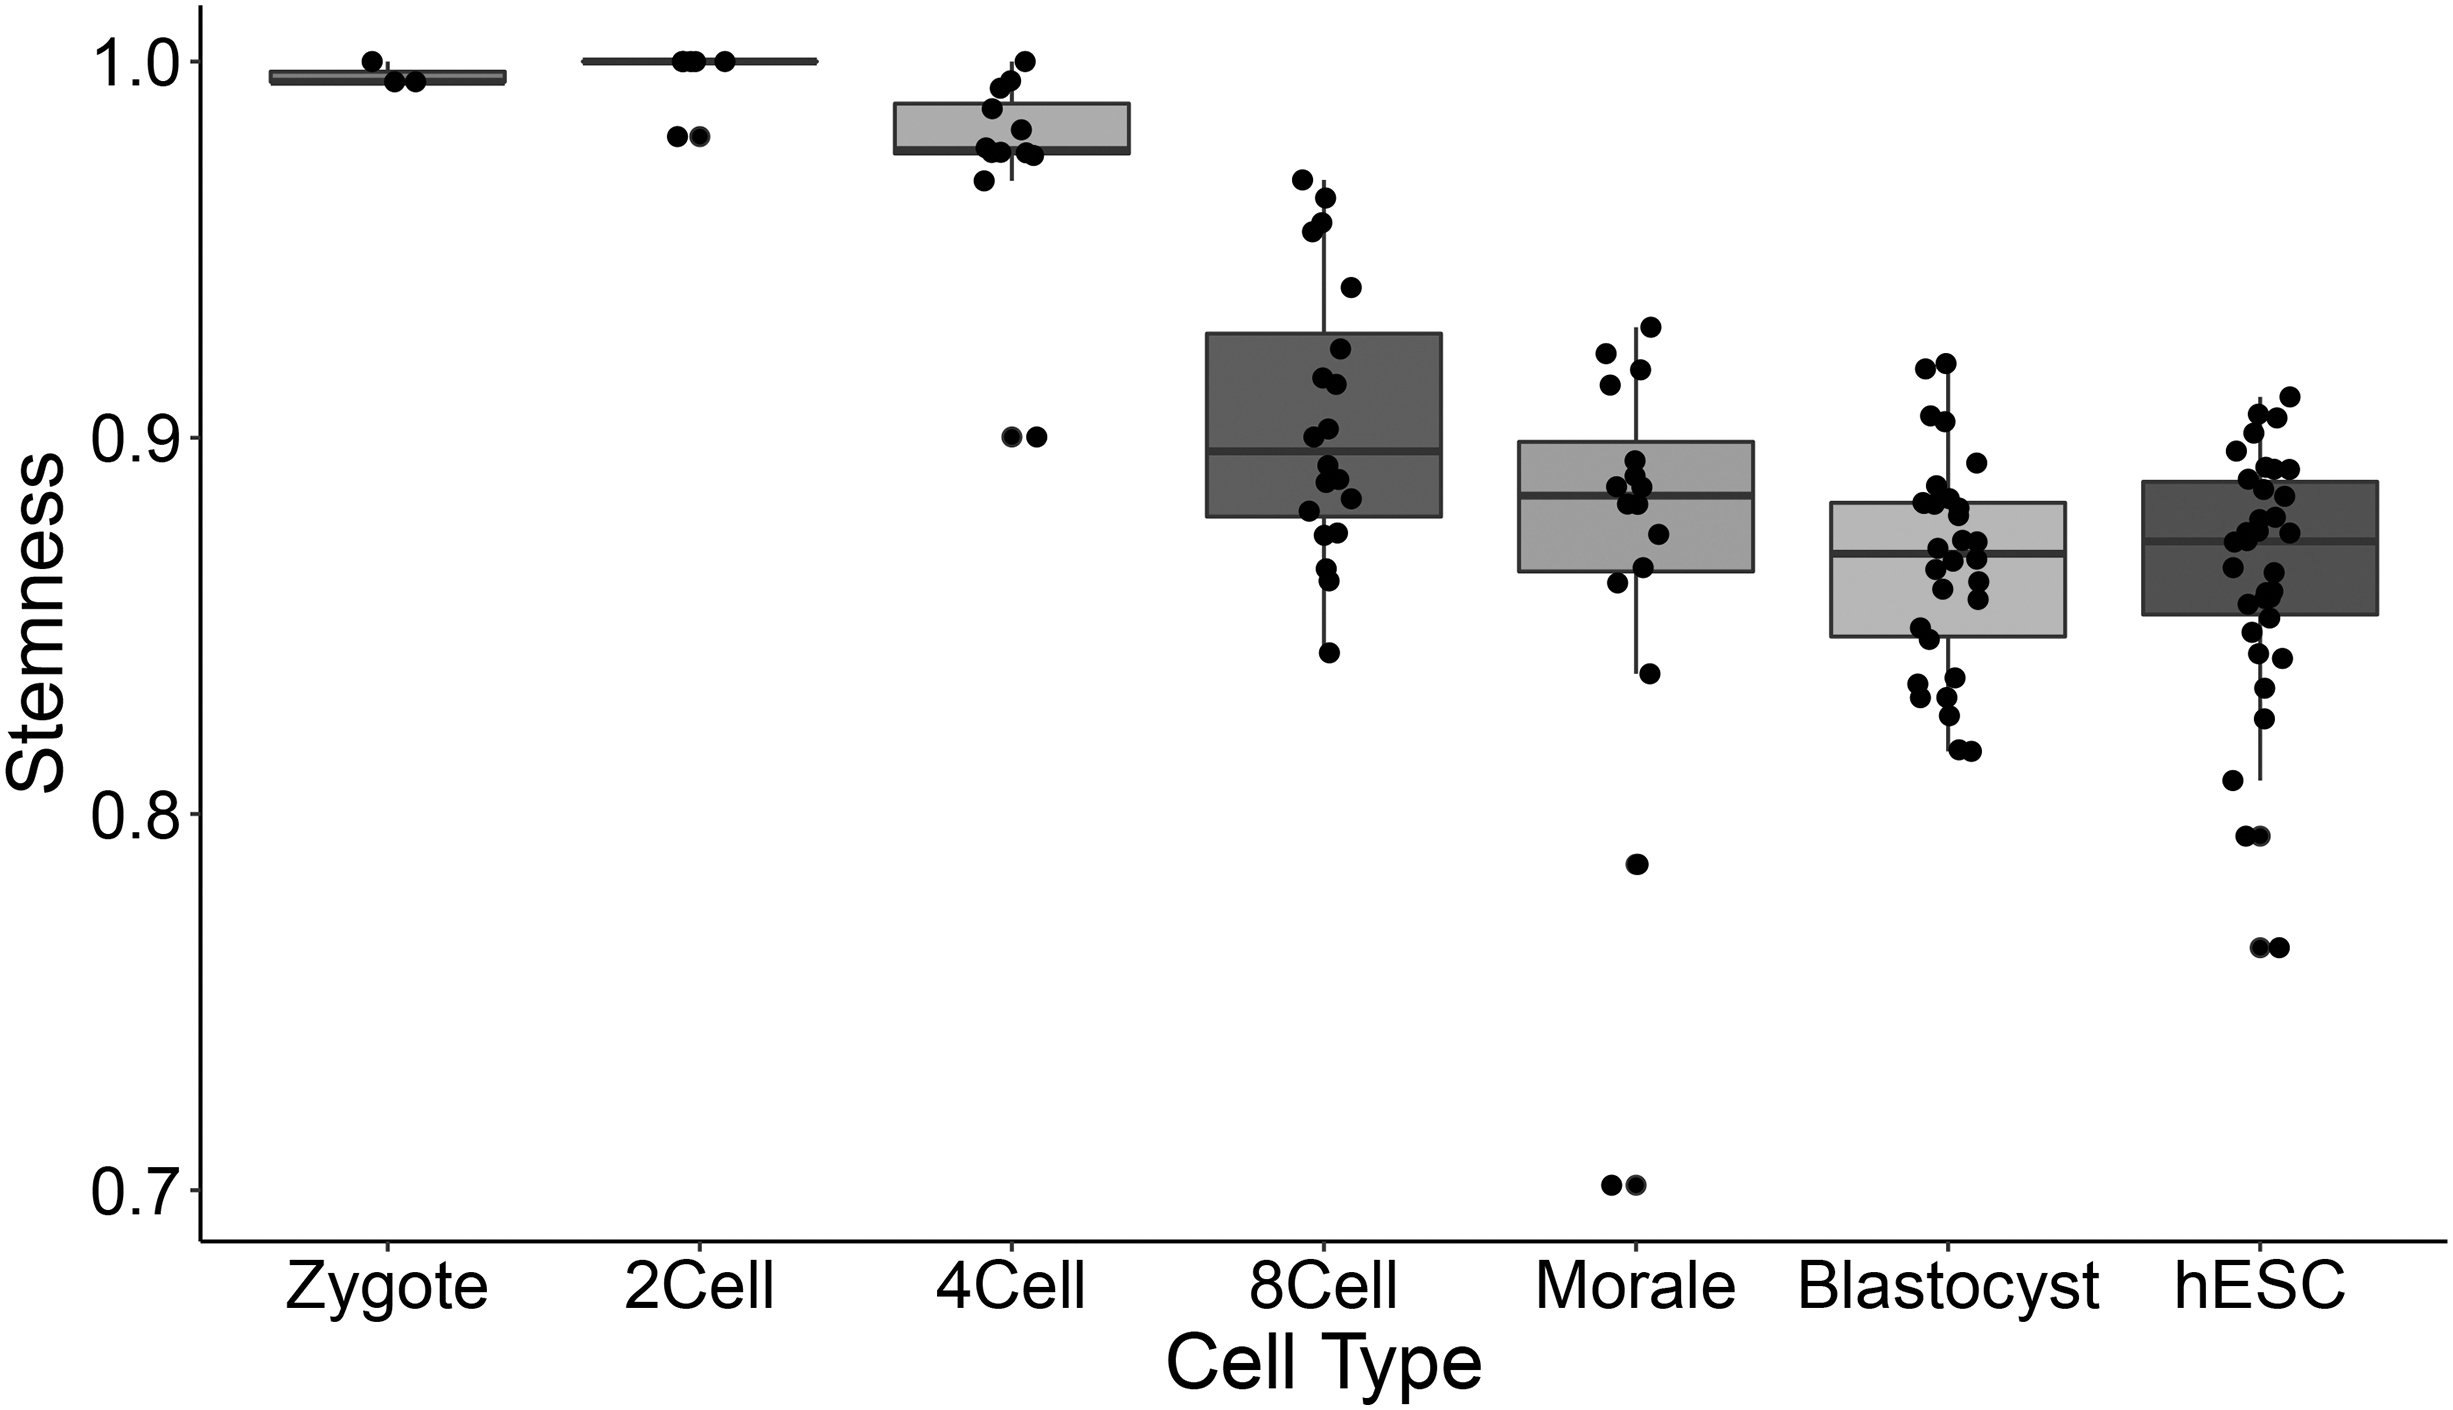
We can apply the OCHSVM stemness to study the cardiac maturation process through cardiomyocyte-iPSCs. Here, we study a data set (GSE72612) of differentiated iPSC-cardiomyocytes at three stages: days 0, 21, and 30. The HSCs with CD34 expression higher than 4.5 are used as the training data set (Giustacchini et al., 2017). We calculated the OCHSVM stemness over the tested data set (GSE72612) through the above trained model. The obtained stemness shown in Figure 4 obviously decreases along the differentiation process, which is consistent with the biological intuition of the decreasing of stemness during differentiation. At day 0, the undifferentiated iPSC-cardiomyocytes show high stemness values of about 0.8.
OCHSVM stemness of the differentiated iPSC-cardiomyocytes at three stages after iPSC differentiation induction. iPSC, induced pluripotent stem cell.
At day 21, followed by an obvious decrement at day 21, the stemness decreases to 0.68 after the induction of cell differentiation and further decreases to about 0.6, with the minimum value of 0.52, at day 30, with further differentiation. Moreover, the variance of the stemness increases over the differentiation process, which suggests the diversity of iPSC-cardiomyocytes during differentiation, in agreement with the experimental observation.
We applied the OCHSVM stemness to study the dynamic interconversion of pluripotent stem cells (PSCs). We obtain the scRNA-seq data from the data set GSE60749 that contains 277 mouse embryonic stem cells (mESCs) and 54 nestin-positive neural precursor cells (NPCs) (Kumar et al., 2014). In our analysis, we took 183 mESCs cultured in serum+LIF media, 94 mESCs cultured in 2i+LIF media (ground-state conditions), and 54 nestin-positive NPCs derived from the mESCs. We calculated the OCHSVM stemness through the trained model on mESCs cultured in 2i+LIF media. The stemness in Figure 5 shows a decrease along the differentiation process from mESCs to NPCs. It should be noted that mESCs cultured in 2i+LIF media establish the ground state, and the mESCs cultured in serum+LIF media exhibit a large degree of heterogeneity, meaning that the cells cultured in serum+LIF media are more prone to be differentiated (Tosolini and Jouneau, 2016).

OCHSVM stemness of mESCs and nestin-positive NPCs. mESCs, mouse embryonic stem cells; NPCs, neural precursor cells.
Our computational results are consistent with the experimental analysis, where the stemness values of the cells cultured in 2i+LIF are mainly 1with only a few cells whose stemness values are less than 1, which suggests the decreasing of stemness during differentiation from mESCs to NPCs.
We examined the stemness of cells along the differentiation of human embryonic stem cells (hESCs) from the data set GSE75748 that contains snapshot progenitors from mesendoderm to definitive endoderm (Chu et al., 2016). The data set contains 374 hESCs, 173 NPCs, 138 definite endoderm progenitors (DEPs), 69 trophoblast cells (TBs), 159 human foreskin fibroblasts (HFFs), and 105 endothelial cells (ECs). First, we trained the model to yield high stemness for hESCs, and then applied the model to calculate the OCHSVM stemness of all cells. Results show the decreasing of stemness along the differentiation process, from the highest level for hESCs to the lowest level for ECs (Fig. 6).

Stemness index by OCHSVM with human embryonic stem cell entry into endoderm progenitors.
We have examined the proposed OCHSVM stemness over four different data sets and have shown that they yield reasonable results in accordance with changes in the stemness of tumor stem cells after TKI therapy, embryo development, and iPSC differentiation. Therefore, the OCHSVM stemness can be a measurement of stemness at a single-cell level based on scRNA-seq data. To show the effectiveness of the proposed OCHSVM method, we compare the results with other state-of-the-art methods. As a supervised, one-class nonlinear method, we first compare the results with representative supervised methods, the OCLR stemness in Sokolov et al. (2016), and one-class SVM methods with different kernel functions: the linear kernel
There are two parameters d (in polynomial kernel) and
First, we compared the stemness of human preimplantation embryo cells at different stages (GSE36552), shown in Figure 7. We use default parameter
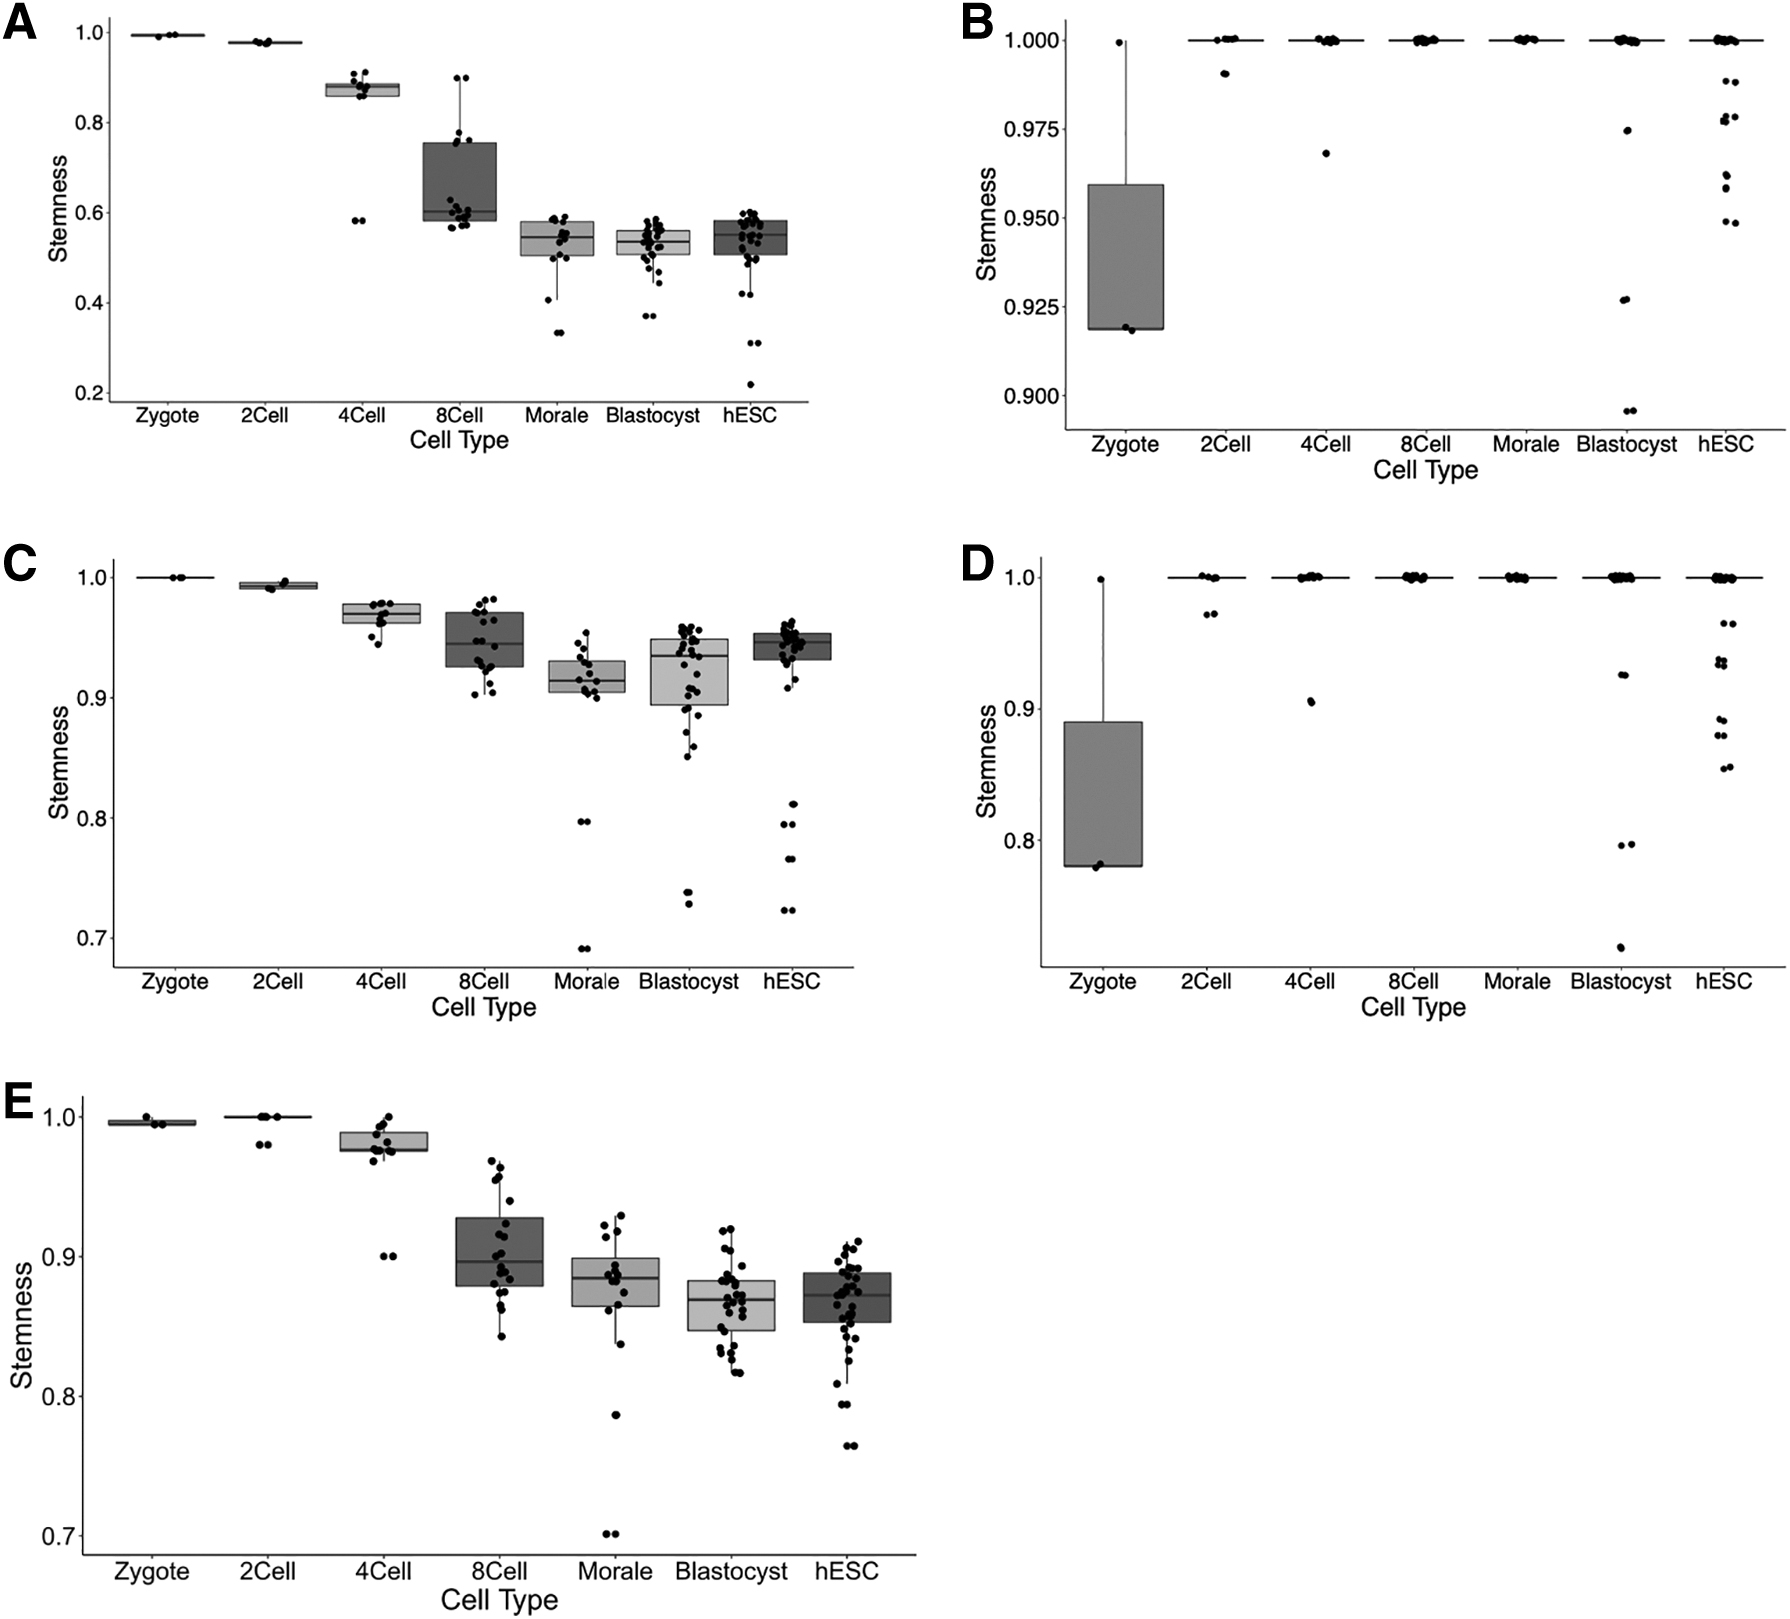
Stemness for different stages of human embryonic stem cell differentiation obtained from different methods
We applied the above methods to the iPSC-cardiomyocyte differentiation data set (GSE72612). The HSCs with CD34 expression higher than 4.5 are used as the training data set (Giustacchini et al., 2017) in model comparisons, the same as OCHSVM model training. We use default parameter
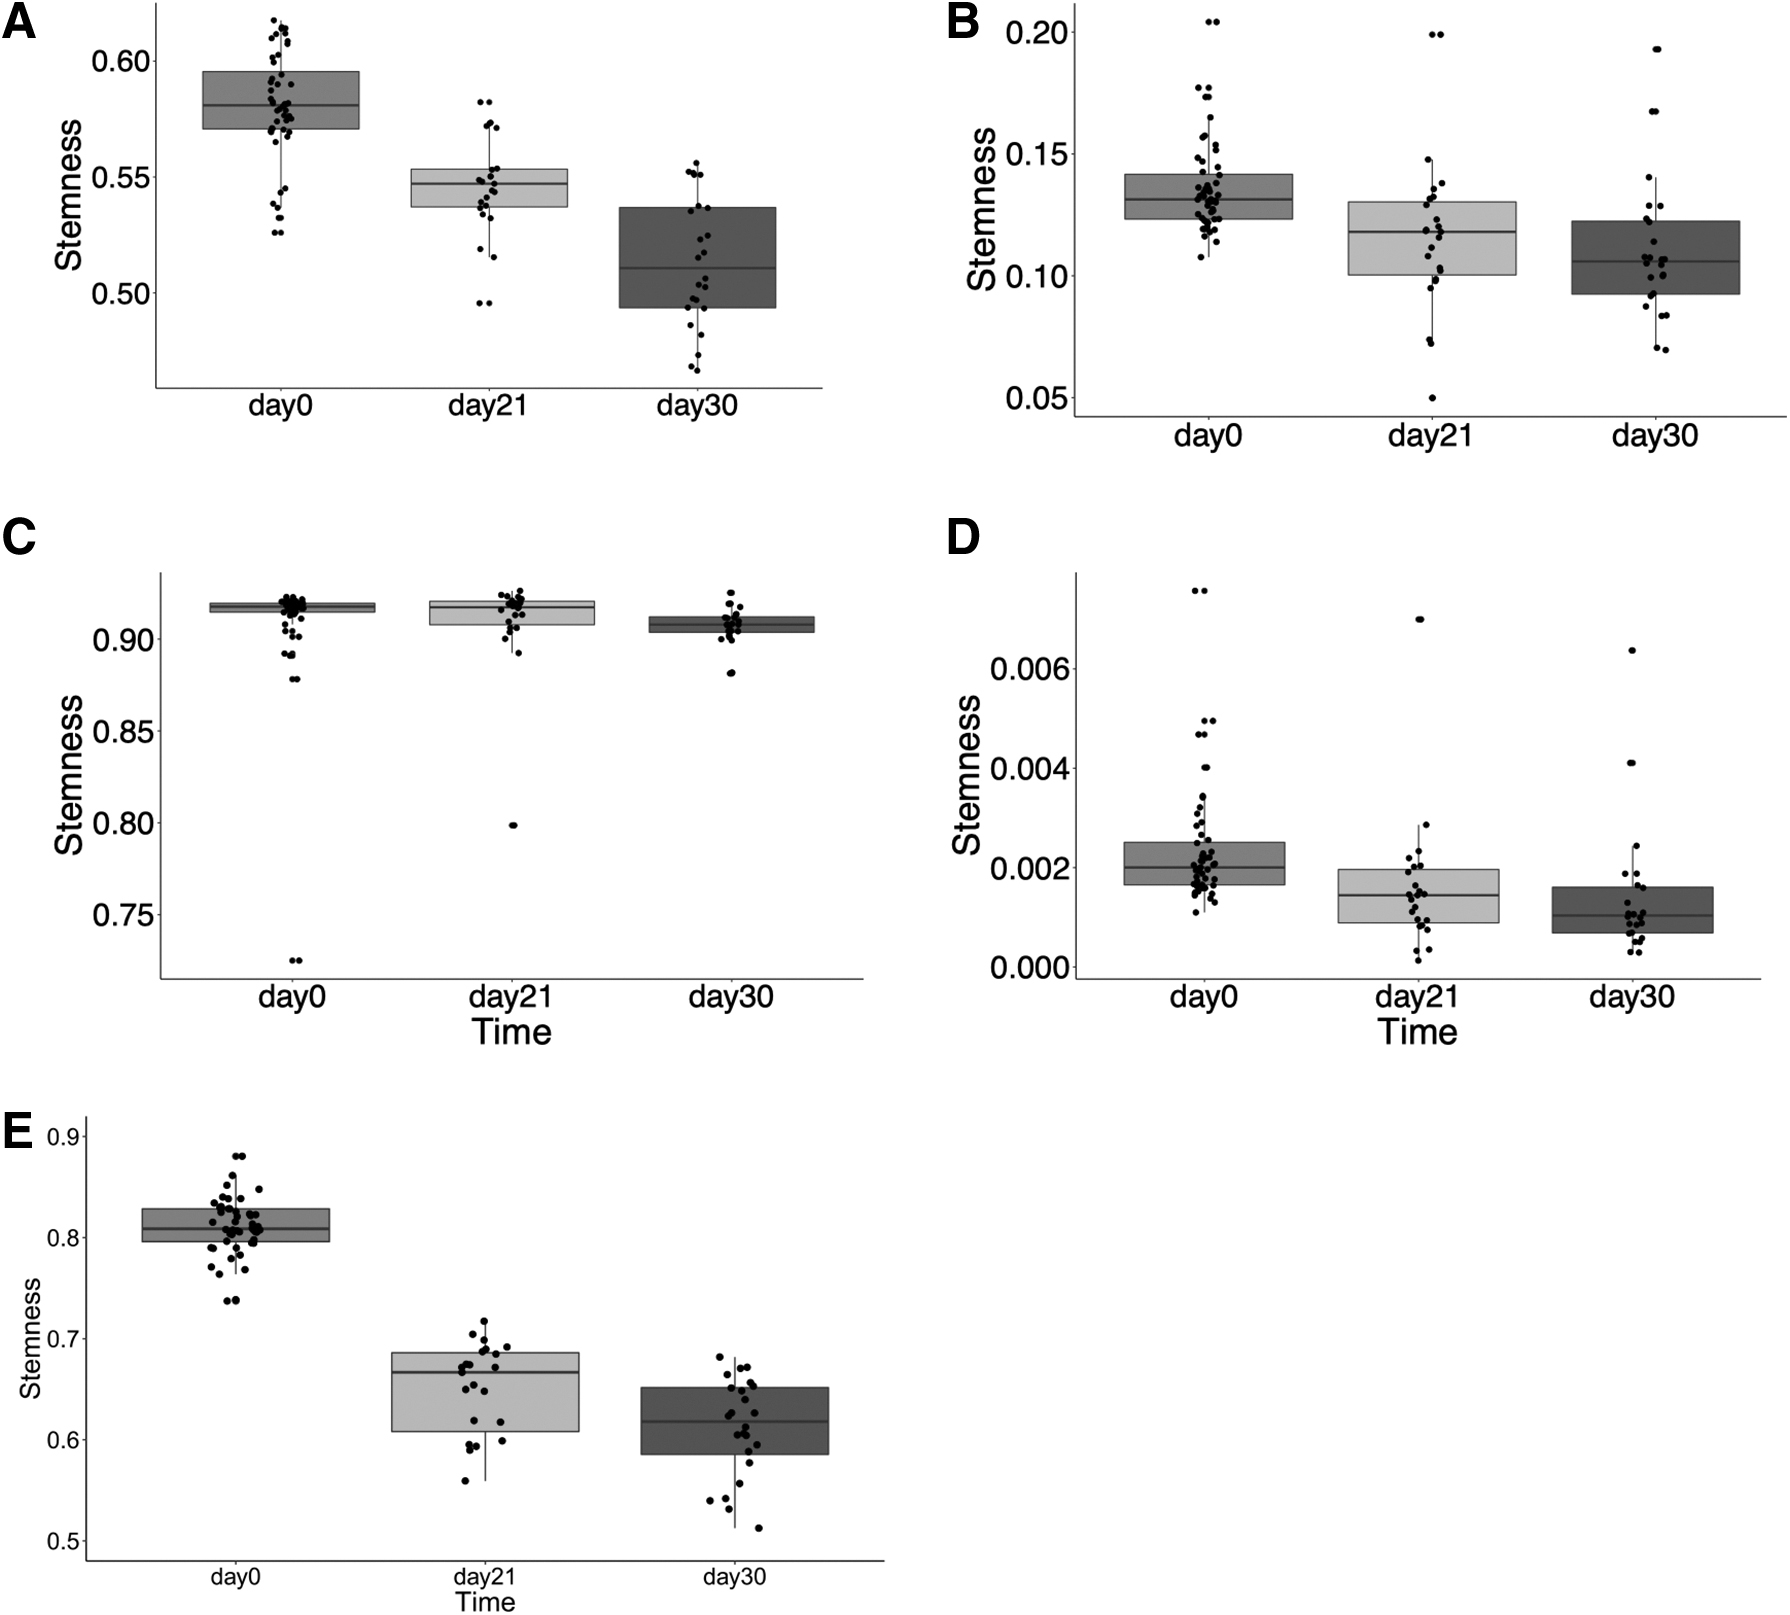
Stemnesses for iPSC-cardiomyocyte differentiation at different stages obtained from different methods
We applied the methods to dynamic interconversion of PSCs from mESCs to NPCs (GSE60749). In the data set, there are 94 mESCs cultured in 2i+LIF media (ground-state conditions). We hence calculated the stemness values through the trained model on mESCs cultured in 2i+LIF media. We use the default parameter

Stemnesses for dynamic interconversion of pluripotent stem cells from mESCs to NPCs obtained from different methods
We applied the methods to human embryonic stem cells undergoing differentiation from hESC to EC (GSE75748). The data set contains 374 hESCs, 173 NPCs, 138 DEPs, 69 TBs, 159 HFFs, and 105 ECs. Similar to OCHSVM, we trained the model to yield high stemness for hESCs, and then applied the model to calculate the stemness of all cells in the comparisons. We use default parameter

Stemness for different stages of human embryonic stem cell differentiation obtained from different methods
In summary, we compared the results obtained from OCHSVM and the other four methods; only the OCHSVM stemness can give results that biologically make sense for the four data sets. Hence, the proposed OCHSVM method is valuable in analyzing the dynamic processes related to stem cell differentiation and/or embryo development.
Moreover, we further compared our proposed method with a recent method CytoTRACE for evaluating the differentiation state (Gulati et al., 2020). CytoTRACE is a simple but robust method to evaluate the developmental potential through the number of expressed genes per cell. Different from the above methods, CytoTRACE is an unsupervised learning framework to predict differentiation states from scRNA-seq data.
CytoTRACE is an unsupervised learning framework to reconstruct trajectories of cellular differentiation (Gulati et al., 2020). Figure 11 shows the prediction results of differentiation states for the four scRNA-seq data sets in both CytoTRACE and OCHSVM: GSE36552, GSE72612, GSE60749, and GSE75748. In human preimplantation embryo cells (GSE36552), CytoTRACE in general can capture the tendency of differentiation trajectory from zygote to hESCs (Fig. 11a). Different from the results obtained by the proposed OCHSVM model, the differentiation trajectory underwent slight decrement in the 4-cell stage that may contradict our usual understanding.

Cellular differentiation states' comparison in CytoTRACE and OCHSVM.
In the data set of iPSC-cardiomyocyte differentiation (GSE72612), both OCHSVM and CytoTRACE can predict the right differentiation trajectory (Fig. 11b, e). The difference between OCHSVM and CytoTRACE lies in that OCHSVM is a supervised method, while CytoTRACE is unsupervised. Moreover, CytoTRACE provides ordering of the considered cells, ranging in [0,1], while OCHSVM can be more elegant to show the degree of differentiation. For example, in GSE36552, the stemness values obtained by the OCHSVM model are in the range [0.8,1], indicating that almost all the cells have great potential of pluripotency.
In GSE60749, mESCs cultured in 2i+LIF media establish the ground state, and the mESCs cultured in serum+LIF media are more prone to be differentiated (Tosolini and Jouneau, 2016). It can be revealed by ordering the results of CytoTRACE (Fig. 11c) that mESCs cultured in 2i-LIF media have larger stemness values.
We applied the CytoTRACE to human embryonic stem cells undergoing differentiation from hESC to EC (GSE75748). Results reveal the increment of differentiation degree along the differentiation process, as seen in Figure 11d and h, where the OCHSVM model can capture the same tendency of cellular differentiation trajectories.
In a further step, we checked the stemness distribution for each data set generated by CytoTRACE and OCHSVM. We estimate probability density f for the sample data in the stemness vector generated by cytoTRACE and OCHSVM, respectively. The estimate is based on a normal kernel function that covers the range of the data, as shown in Figure 12, upper figures refer to OCHSVM probability density, and lower figures refer to CytoTRACE probability density. Besides, we conducted statistical tests to quantitatively compare the performances of both methods, shown in Table 1. We performed t-test on the hypothesis H that the stemness values follow normal distribution with mean 0.5 and unknown variance, and returns the testing result in H. Here

Stemness distribution comparison in CytoTRACE and OCHSVM. Upper figures refer to OCHSVM probability density, and lower figures refer to CytoTRACE probability density in human preimplantation embryo cell (Data set: GSE36552), iPSC-cardiomyocyte (Data set: GSE72612), interconversion of pluripotent stem cells (Data set: GSE60749), and embryonic stem cell differentiation (Data set: GSE75748).
Performance Comparisons of CytoTRACE and OCHSVM in Stemness Distribution
Null hypothesis: The stemness vector is from normal distribution with mean 0.5 and unknown variance.
It is interesting to see that, for all the data sets, CytoTRACE always estimates the stemness vector following a normal distribution with mean 0.5, also indicated by Figure 12, whose probability density values achieve optimal at 0.5. However, it is not quite reasonable that the stemness values in all the data sets have the same expectation in distribution. In comparison, the stemness values estimated by the OCHSVM model are diversely distributed over different data sets. Although the general tendency of stemness in both methods is the same, from the statistical tests we can conclude that the OCHSVM model is more reasonable.
Intratumoral heterogeneity and the presence of CSCs are challenging issues in cancer therapy. In this study, we apply the stemness identification method to check the heterogeneity in CSCs. We extracted the data set from the NCBI GEO database GSE81730 for scRNA-seq data of HSCs from three CML patients. There are 240 HSCs, which were separated into CML-SCs (
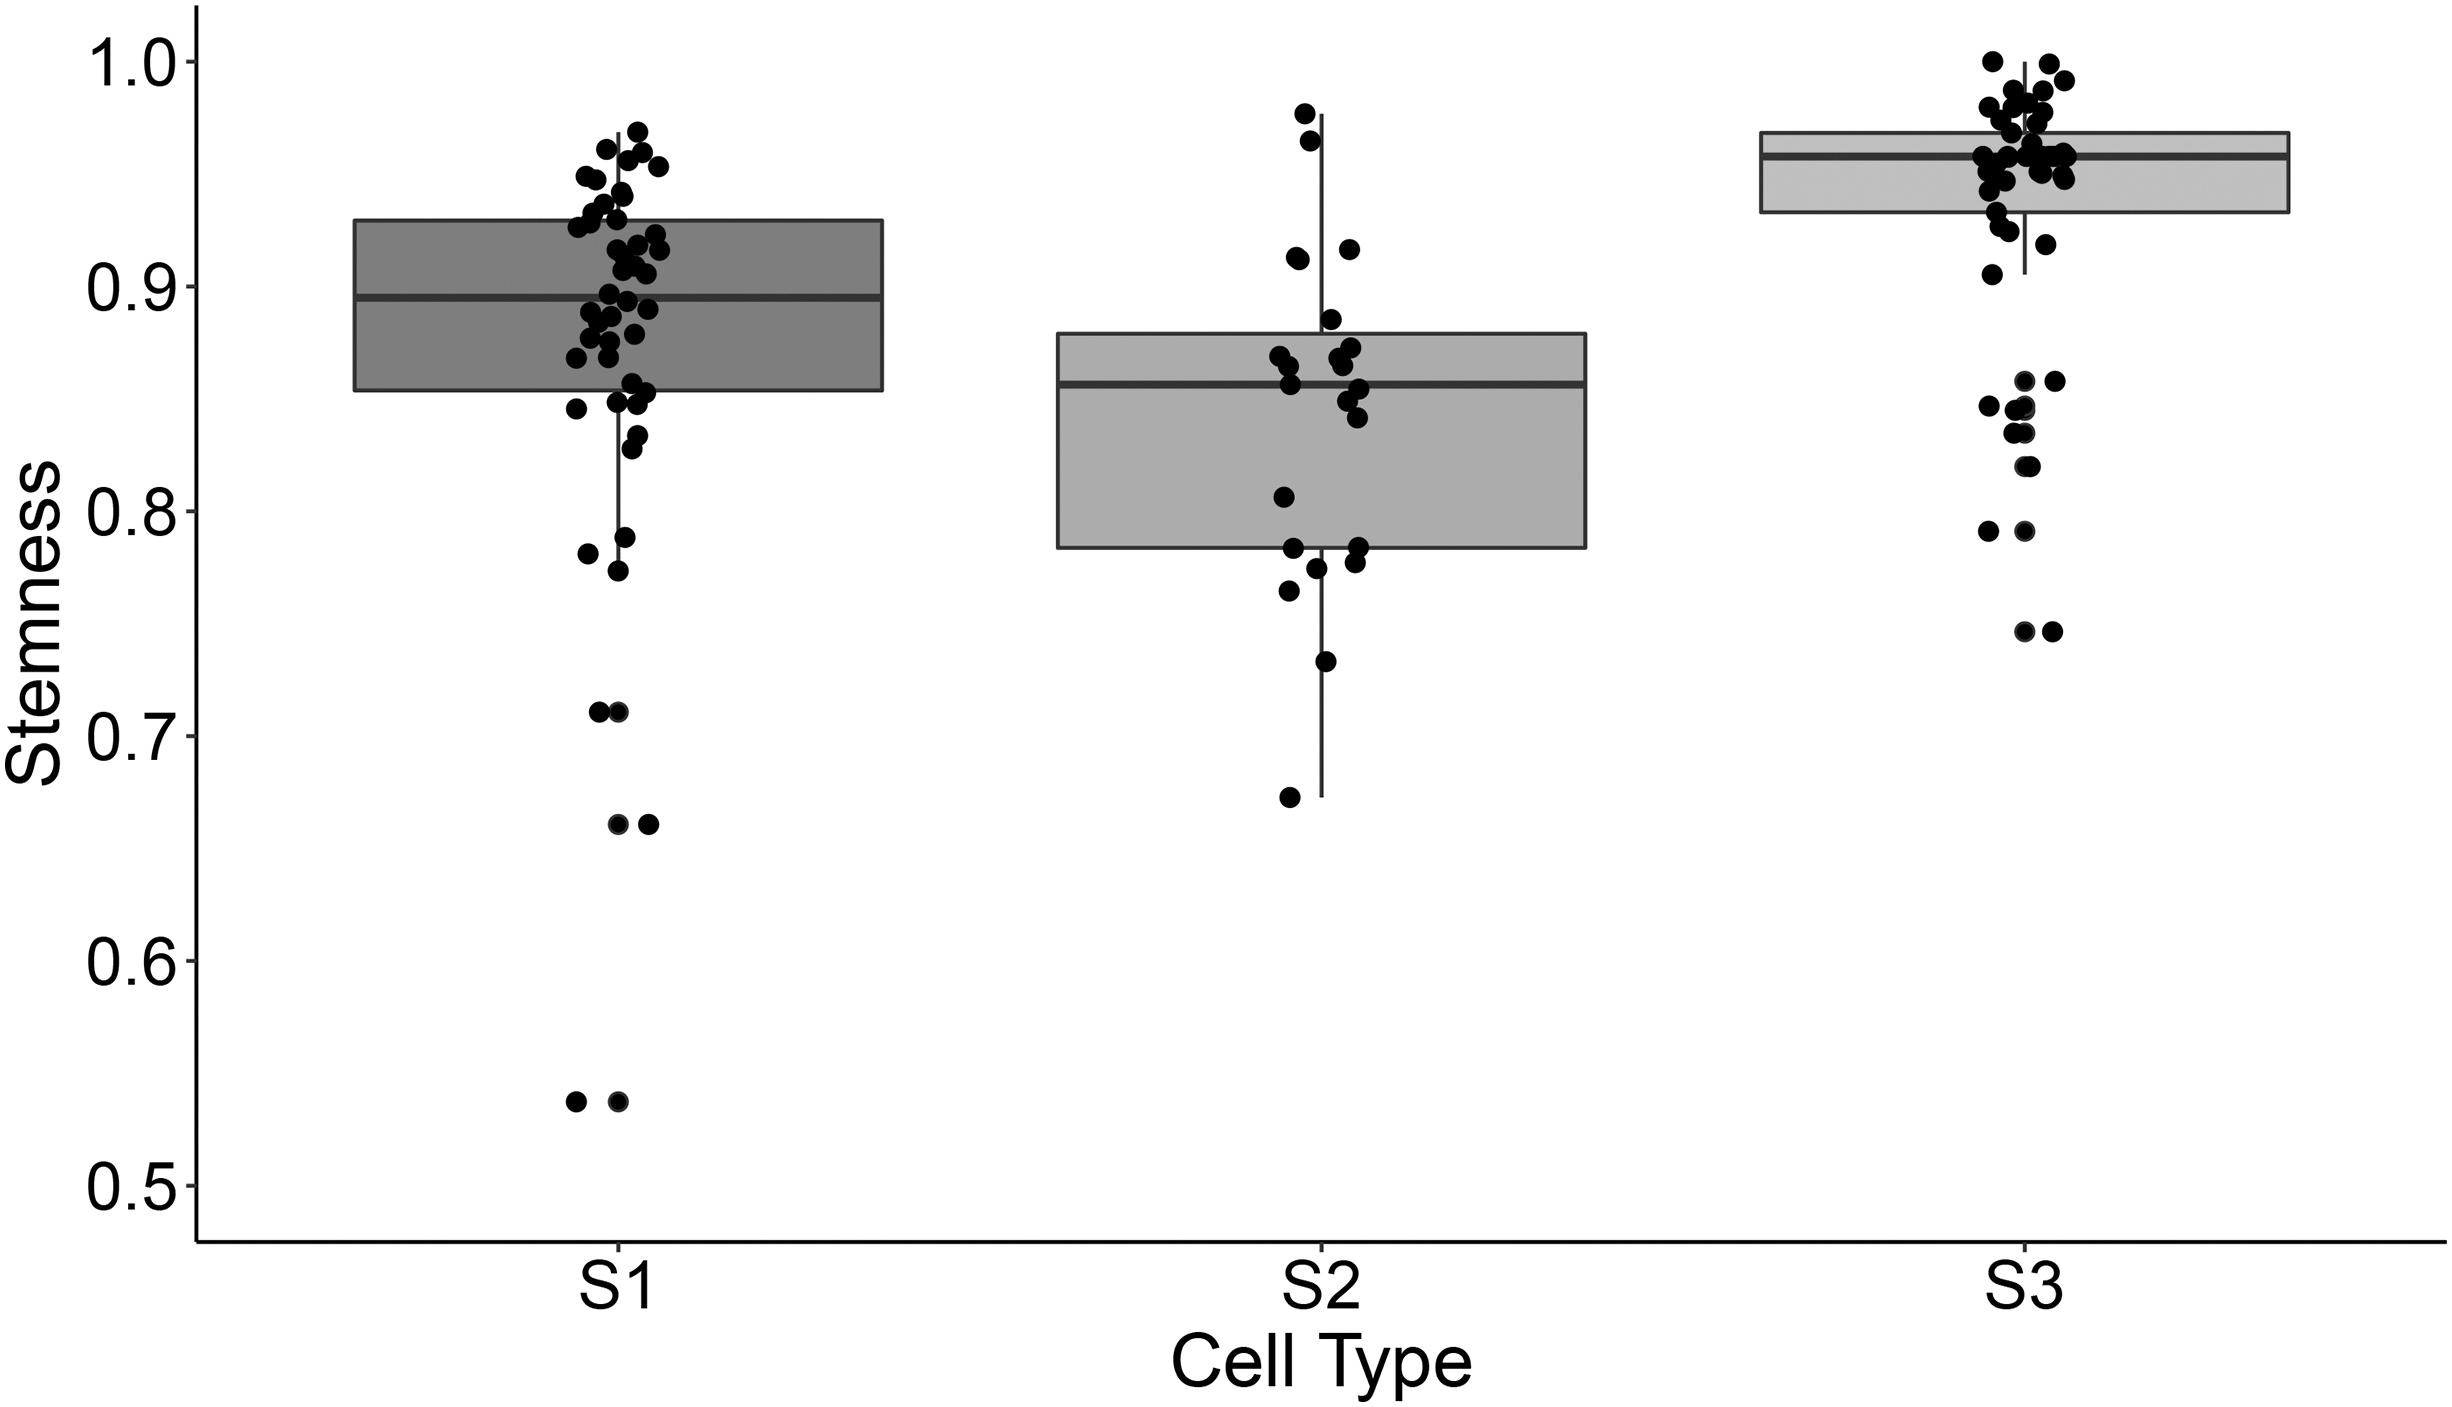
Stemness distribution for chronic myeloid leukemia stem cells in three patient samples.
In patient 3, the stem cells were similar to each other in terms of stemness, which showed compact distribution with a small variance. While the stem cells in patient 2 showed more differentiated features and are more scattered in the stemness distributions. These results showed that the proposed stemness can be an indication of cancer heterogeneity.
In this article, we proposed a nonlinear one-class SVM method, OCHSVM, to calculate the stemness of cells using scRNA-seq data. The OCHSVM method considered the one-class SVM framework for model training, and used the Hadamard kernel to evaluate the nonlinear correlation between different cells. We tested the trained model to analyze CSC development in CML patients after TKI therapy, and explored the evolution of cancer cell stemness in response to the therapy. We also applied the OCHSVM stemness to study the process of human ESC formation during preimplantation, which showed an obvious decrease in the stemness from zygote to hESCs, in agreement with the process of epigenetic reprogramming in the mammalian early embryo development. Moreover, OCHSVM stemness can characterize the differentiation process of iPSC-cardiomyocytes, and the early development of human stem cell differentiations.
The proposed method was compared with a number of state-of-the-art machine learning methods for stemness evaluation, including OCLR and one-class SVM method with several different functions: OCLSVM, OCPSVM, and OCRSVM. Results show that OCHSVM method provides an effective way for modeling the cellular relationships. It was further compared with the most-recent method (an unsupervised learning framework) for differentiation trajectory evaluation, CytoTrace, and can still show superiority and robustness. Besides, the method was also applicable for evaluating tumor heterogeneity. In summary, stemness is an important quantification to measure the ability of self-renewal of stem cells; the proposed OCHSVM stemness offers a method to quantitatively analyze the differentiation status of cells, and to characterize tumor heterogeneity and the patterns in different stages of treatment.
Footnotes
ACKNOWLEDGMENTS
The authors would like to thank the anonymous reviewers for their valuable suggestions.
AUTHOR DISCLOSURE STATEMENT
The authors declare they have no conflicting financial interests.
FUNDING INFORMATION
This research is supported by the National Natural Science Foundation of China Grant Nos. 12271522, 11901575, and 91730301.