
Abstract
We address the problem of rooting an unrooted species tree given a set of unrooted gene trees, under the assumption that gene trees evolve within the model species tree under the multispecies coalescent (MSC) model. Quintet Rooting (QR) is a polynomial time algorithm that was recently proposed for this problem, which is based on the theory developed by Allman, Degnan, and Rhodes that proves the identifiability of rooted 5-taxon trees from unrooted gene trees under the MSC. However, although QR had good accuracy in simulations, its statistical consistency was left as an open problem. We present QR-STAR, a variant of QR with an additional step and a different cost function, and prove that it is statistically consistent under the MSC. Moreover, we derive sample complexity bounds for QR-STAR and show that a particular variant of it based on “short quintets” has polynomial sample complexity. Finally, our simulation study under a variety of model conditions shows that QR-STAR matches or improves on the accuracy of QR. QR-STAR is available in open-source form on github.
INTRODUCTION
Rooted species trees are needed for many biological research problems, including comparative genomics (Jun et al., 2015; Skarp-de Haan et al., 2014) and dating (Renner et al., 2008). The availability of genome-wide sequencing data for many species has made it possible to estimate species trees using different loci from across the genome, thus enabling “multi-locus” species tree estimation. Typically, rooted species trees are estimated in two steps: first the unrooted topology of the species tree is inferred using a multi-locus species tree estimation method, and then that unrooted species tree is rooted.
Alternatively, rooted gene trees can be inferred and then combined into a rooted species tree, using methods such as MP-EST (Liu et al., 2010), STAR (Liu et al., 2009), and GLASS (Mossel and Roch, 2008). However, the estimation of rooted gene trees is itself challenging, making this approach less reliable than methods that operate in the two-step procedure where the unrooted species tree is estimated first and then rooted (Simmons and Gatesy, 2015; Simmons et al., 2022).
The problem of estimating an unrooted species tree has been actively investigated over the past several decades. The classical approach is “concatenation,” where the alignments for the different loci are concatenated into one large “super-alignment,” which is then given to a tree estimation method, such as RAxML (Stamatakis, 2014).
However, evolutionary processes, such as incomplete lineage sorting (ILS) or gene duplication and loss (GDL), can result in different genomic regions (referred to as “loci”) having different evolutionary histories, so that gene trees and species trees can have different topologies (Maddison, 1997). Moreover, when ILS is high, then standard concatenation analyses can have poor accuracy (Kubatko and Degnan, 2007; Molloy and Warnow, 2018), and may even be statistically inconsistent (Roch and Steel, 2015; Roch et al., 2019).
Therefore, to estimate highly accurate species trees in the presence of ILS or GDL, new methods have been developed that take the source of heterogeneity into consideration (Chifman and Kubatko, 2014; Mirarab et al., 2014b; Ogilvie et al., 2017). Species tree estimation in the presence of ILS, as modeled by the multispecies coalescent (MSC) model (Hudson, 1983), is the most well studied, and many methods have been developed for this problem; see Posada (2016) for a survey.
Given an estimate of the unrooted species tree, various methods can be used to infer the root location. Perhaps the most commonly used approach is the use of one or more outgroup species (e.g., the addition of a lizard within a collection of bird species), which allows the unrooted tree on this enlarged set of species to be rooted on the edge leading to the outgroup (Maddison et al., 1984).
Although this approach is natural, there are many challenges in selecting an appropriate outgroup species: if the outgroup is too distantly related to the other species, then it may be attached fairly randomly to the tree containing the remaining species, and if it is too closely related, it may even be an ingroup taxon rather than an outgroup (Felsenstein, 1978; Graham et al., 2002; Holland et al., 2003; Li et al., 2012).
It is also possible to use estimated branch lengths on the species tree to find the root based on specific optimization criteria, often using molecular clock analysis (Drummond et al., 2006); however, these approaches may only be highly accurate when evolutionary rates are close to following the strict molecular clock (which assumes that all sites along the genome evolve under a constant rate) (Hess and De Moraes Russo, 2007; Mai et al., 2017; Tria et al., 2017).
There are also recent developments that seek to find the root based on non-reversible models of DNA substitution (Bettisworth and Stamatakis, 2021; Naser-Khdour et al., 2022). However, none of the methods mentioned so far consider biological processes that cause discord between species trees and gene trees, and they are mainly used and evaluated for rooting gene trees (Wade et al., 2020).
Recently, a few methods have been developed that are specifically designed for rooting species trees under the MSC; these include a rooting method by Tian and Kubatko (2017) that uses site pattern probabilities, and a method that uses approximate Bayesian computation by Alanzi and Degnan (2017). The first method assumes a strict molecular clock and degrades in accuracy when there is deviation from the clock (Tian and Kubatko, 2017), and the second approach relies on a large number of calculations and may not be scalable (Alanzi and Degnan, 2017). Further, the software for these methods is not publicly available, and their performance compared with other methods is not explored in the literature.
We recently introduced Quintet Rooting (QR) (Tabatabaee et al., 2022), a polynomial-time method for rooting an unrooted species tree with at least five leaves given a set of unrooted gene trees, which is designed for use when the gene trees differ from the species tree due to ILS. QR is based on the mathematical theory by Allman, Degnan, and Rhodes (ADR) (Allman et al., 2011) that established that the rooted topology of every 5-leaf species tree is identifiable from the distribution of the unrooted 5-leaf gene tree topologies; a trivial extension to any number
The experimental study in Tabatabaee et al. (2022) showed that QR had good accuracy on simulated ILS datasets in comparison to alternative methods. However, we did not establish whether it was statistically consistent under the MSC. That is, we did not establish whether QR would return the correct root location with probability converging to 1 as the number of true gene trees in the input increases, when given the true unrooted species tree as input.
Although there has been much focus on proving statistical consistency for species tree estimation methods and several methods such as ASTRAL (Mirarab et al., 2014b), SVDQuartets (Wascher and Kubatko, 2021) and BUCKy (Larget et al., 2010) have been proven statistically consistent estimators of the unrooted species tree under the MSC, to the best of our knowledge, no prior study has addressed the statistical consistency properties of methods for rooting species trees.
In this article, we argue that QR is not guaranteed to be statistically consistent under the MSC. We introduce a variant of QR called QR-STAR that is also polynomial-time and uses much of the same algorithmic structure of QR, but with some important changes that enable us to prove statistical consistency under the MSC. We also analyze the sample complexity for QR-STAR, and we provide a variant that achieves polynomial sample complexity. Finally, our simulation study evaluating QR and QR-STAR under a range of model conditions shows that QR-STAR matches or improves on the accuracy of QR, and its error is close to the error of the optimal rooting under many conditions.
The rest of this article is organized as follows. We provide background information on QR in Section 2, as well as the theory established by ADR (Allman et al., 2011). We introduce QR-STAR in Section 3. The theoretical results are provided in Section 4. In Section 5, we report on the results of a simulation study, including the design of QR-STAR and the evaluation of QR-STAR in comparison to QR. We conclude in Section 6 with a discussion of future research.
BACKGROUND
We present the theory from Allman et al. (2011) first, which establishes identifiability of the rooted species tree from unrooted quintet trees, and then we describe QR, our earlier method for rooting species trees. Together, these form the basis for deriving our new method, QR-STAR, which we present in the next section.
ADR theory
ADR (Allman et al., 2011) established that the unrooted topology of the species tree is identifiable from four-leaf unrooted gene trees under the MSC, a result that is well known and used in several “quartet-based” methods for estimating species trees under the MSC (Larget et al., 2010; Mahbub et al., 2021; Mirarab et al., 2014b). ADR also proved that the rooted species tree topology is identifiable from unrooted five-leaf gene tree topologies; this result is much less well known, but it was recently used in the development of QR for rooting species trees.
ADR have described the probability distribution of unrooted gene tree topologies under each 5-taxon MSC model species tree. On a given set of 5 taxa, there exist 105 different rooted binary trees, labeled with
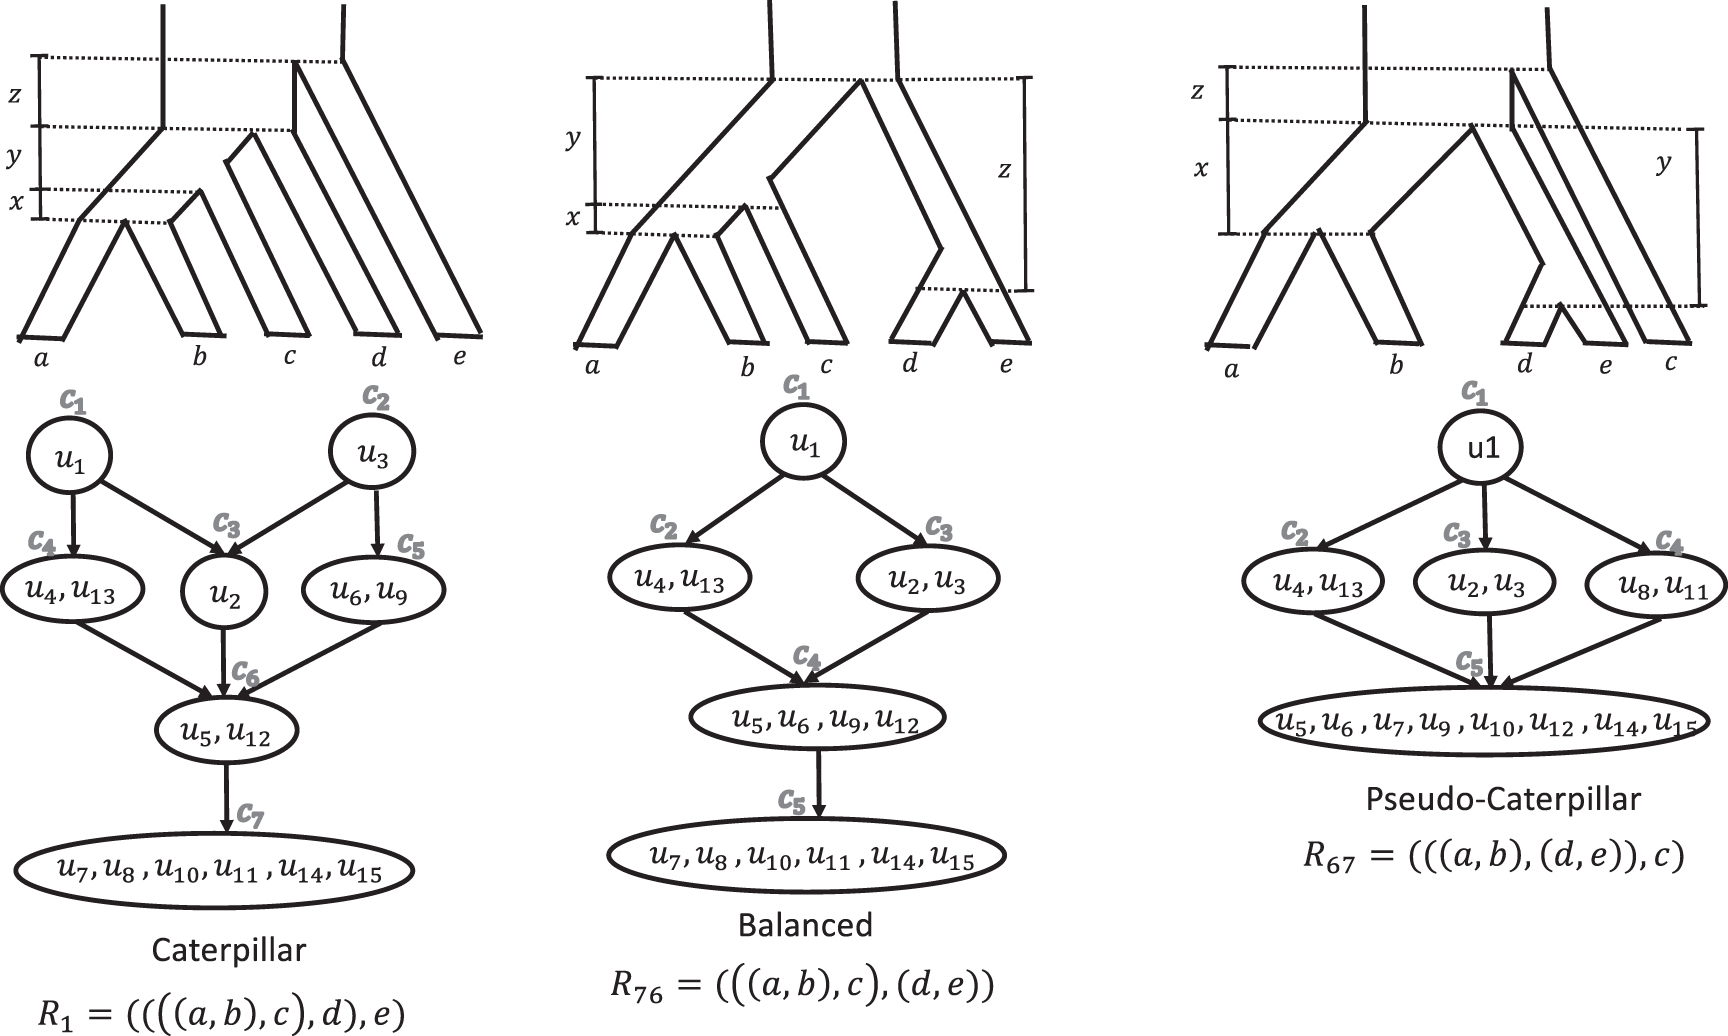
ADR invariants and inequalities for different rooted topological shapes. The invariants (i.e., equalities) and inequalities found by ADR define a partial order on the probabilities of unrooted 5-taxon gene tree topologies for rooted 5-taxon model species trees with different rooted shapes (caterpillar, balanced, and pseudo-caterpillar). There are 15 unrooted binary trees on a given set of 5 leaves. Each of the 105 5-taxon rooted species trees define a specific distribution on the probabilities of these unrooted trees. The topology of the rooted binary species tree can be determined from this distribution (i.e., it is identifiable, as established by ADR). While the branch lengths of the rooted species tree depend on the actual probabilities, the linear invariants and inequalities that hold for these distributions are enough to determine the rooted topology of the model species tree. ADR, Allman, Degnan, and Rhodes.
To prove this identifiability result, the ADR theory specifies a set of linear invariants (i.e., equalities) and inequalities that must hold between the probabilities of unrooted 5-taxon gene trees, for any choice of the parameters of the model species tree. These linear invariants and inequalities define a partial order on the probabilities of 5-taxon unrooted gene tree topologies. In other words, two gene tree probabilities
Figure 1 shows examples of these partial orders, described using Hasse diagrams, for a particular leaf labeling of trees from each rooted shape. Note that some probabilities are members of the same set (e.g., for R1, set c4 contains both u4 and
As can be seen in Figure 1, the number of equivalence classes for caterpillar, balanced, and pseudo-caterpillar trees is 7, 5, and 5, respectively. Each directed edge between two equivalence classes in these Hasse diagrams defines an inequality, so that all gene tree probabilities in class ca at the source of an edge are greater than all gene tree probabilities in class cb at the target, and we show this by
The exact values of the unrooted gene tree probabilities depend on the internal branch lengths of the model tree, and ADR provide a set of formulas that relate the model tree parameters to the probability distribution of the unrooted gene trees in appendix B of Allman et al. (2011), which will be used in our proofs.
The input to QR is an unrooted species tree T with n leaves and a set
QR approaches this problem by selecting a set Q of quintets of taxa from
This results in
Thus, QR provides an exact solution to the optimization problem with the following input and output:
Cost function
The cost function 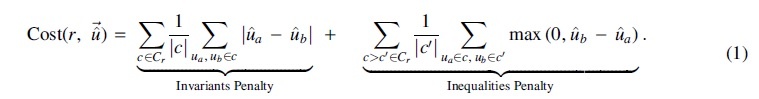
The normalization factors
Quintet sampling
The set Q of quintets in the QR algorithm can be selected in different ways, and here we consider sampling strategies that lead to statistical consistency. These sampling strategies differ in the number of quintets they sample and therefore their runtime. A straightforward sampling strategy is to use all
Alternatively, an
For any edge e that is internal in the tree, the removal of e partitions the set of taxa into four subsets
Lack of consistency for QR
QR uses the cost function in Equation (1) to select between different rootings of a 5-taxon unrooted species tree, given the estimated quintet distribution
Note that class c3 in
According to the proof of Lemma 6 in Section 4, as k increases, for the model tree
For the caterpillar tree R1, most of its inequality penalty terms are also penalty terms in the cost of
In the limit as
QR-STAR is an extension to QR that has an additional step for determining the rooted shape (i.e., the rooted topology without the leaf labels) of each quintet tree, as well as an associated penalty term in its cost function. This penalty term compares the rooted shape of the 5-taxon tree, denoted by

where for all
Each of the 105 rooted binary trees on a given set of 5 leaves have a unique set of inequalities and invariants that can be derived from the ADR theory. The cost function in Equation (3) considers a penalty term for these inequalities and invariants as well as the shape of the tree, so that
Determining the rooted shape
The different rooted shapes (i.e., caterpillar, balanced, pseudo-caterpillar) of model 5-taxon species trees define equivalence classes with different class sizes on the unrooted gene tree probability distribution. These class sizes can be used to determine the unlabeled shape of a rooted tree, when given the true gene tree probability distribution.
For example, the size of the equivalence class with the smallest gene tree probabilities is 8 for the pseudo-caterpillar trees and 6 for balanced or caterpillar trees. Therefore, the size of the equivalence class corresponding to the minimal element in the partial order can differentiate a pseudo-caterpillar tree from other tree shapes. Moreover, both caterpillar and balanced trees have a unique class with the second smallest probability, which is of size 2 for caterpillar trees and size 4 for balanced trees, and this can be used to differentiate a caterpillar tree from a balanced tree. This approach is used in theorem 9 in Allman et al. (2011) for establishing the identifiability of rooted 5-taxon trees from unrooted gene trees.
However, given an estimated gene tree distribution, it is likely that none of the invariants derived from the ADR theory exactly hold, and so the class sizes cannot be directly determined and the approach cited earlier cannot be used as is to infer the shape of a rooted quintet. Here, we propose a simple modification for determining the rooted shape of a tree from the estimated distribution of unrooted gene trees, by looking for significant gaps between quintet gene tree probabilities.
Let T be the unrooted species tree with
We propose a general design for QR-STAR based on a given error probability
estimate the rooted shape
estimate the rooted shape
estimate the rooted shape
The runtime of QR-STAR is the same as QR, as determining the topological shape for each quintet is done in constant time, and the overall runtime remains
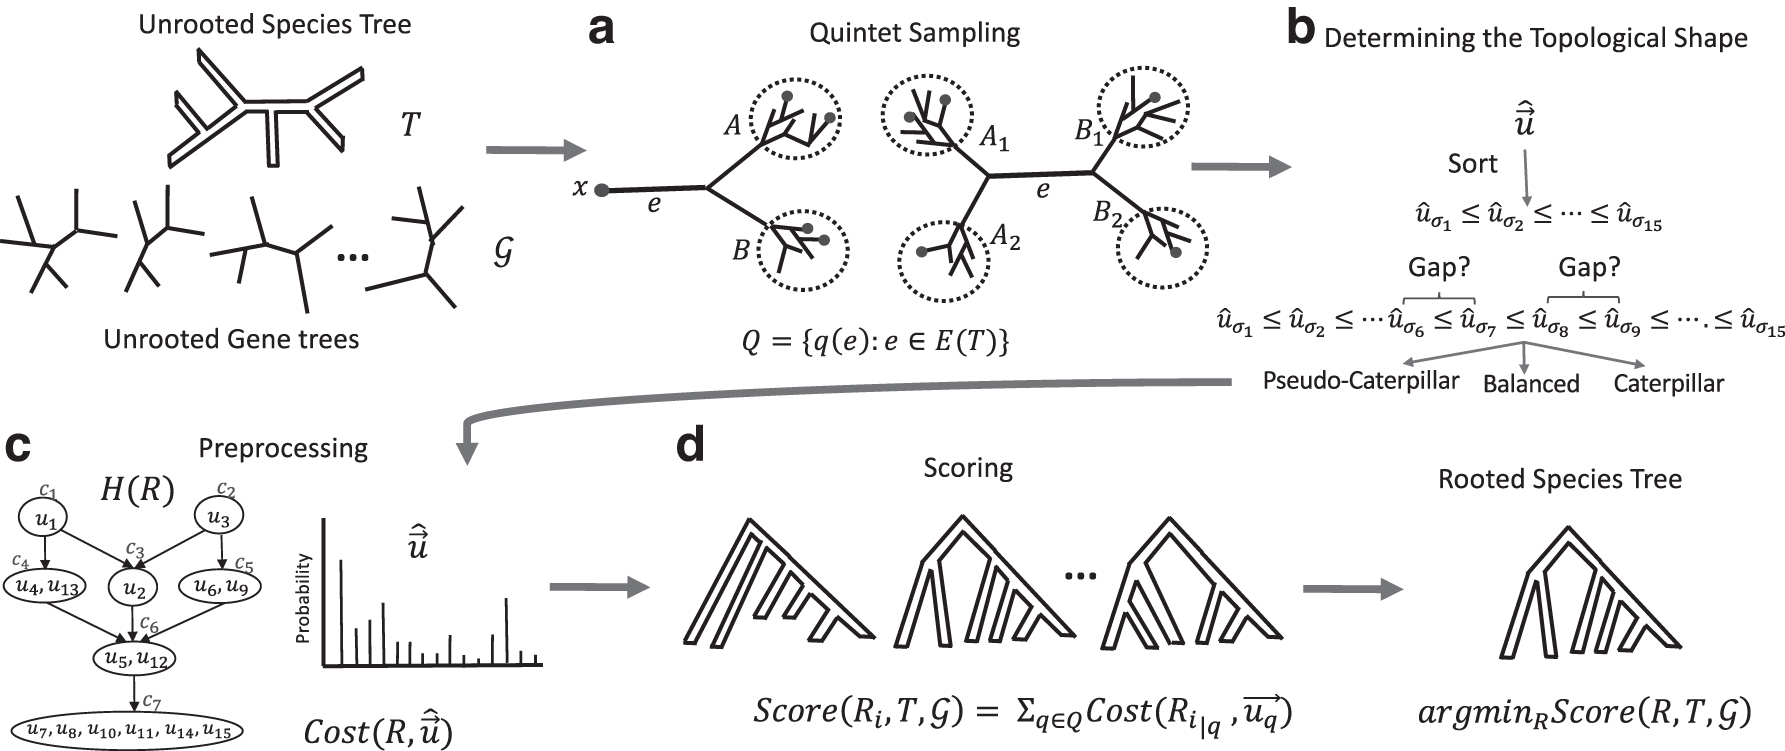
QR-STAR Pipeline. The input is an unrooted species tree T and a set of unrooted gene trees
In this section, we provide the main theoretical results, starting with a series of lemmas and theorems that will be used in the proof of statistical consistency of QR-STAR in Theorem 2. Throughout this article, we assume that discordance between species trees and gene trees is solely due to ILS. In establishing statistical consistency, we assume that input gene trees are true gene trees and, thus, have no gene tree estimation error (GTEE). All trees are assumed to be fully resolved (i.e., binary).
Preliminaries
We begin with some definitions and key observations.
Note that
Proof. Every internal path of
Proof. Let
We show that the lemma holds for all pairs
Caterpillar trees. For a caterpillar tree
where  follows from the fact that
To save space, the rest of the derivations are provided in Appendix B. Therefore, we have:

Since
□
Figure 3a shows an example of
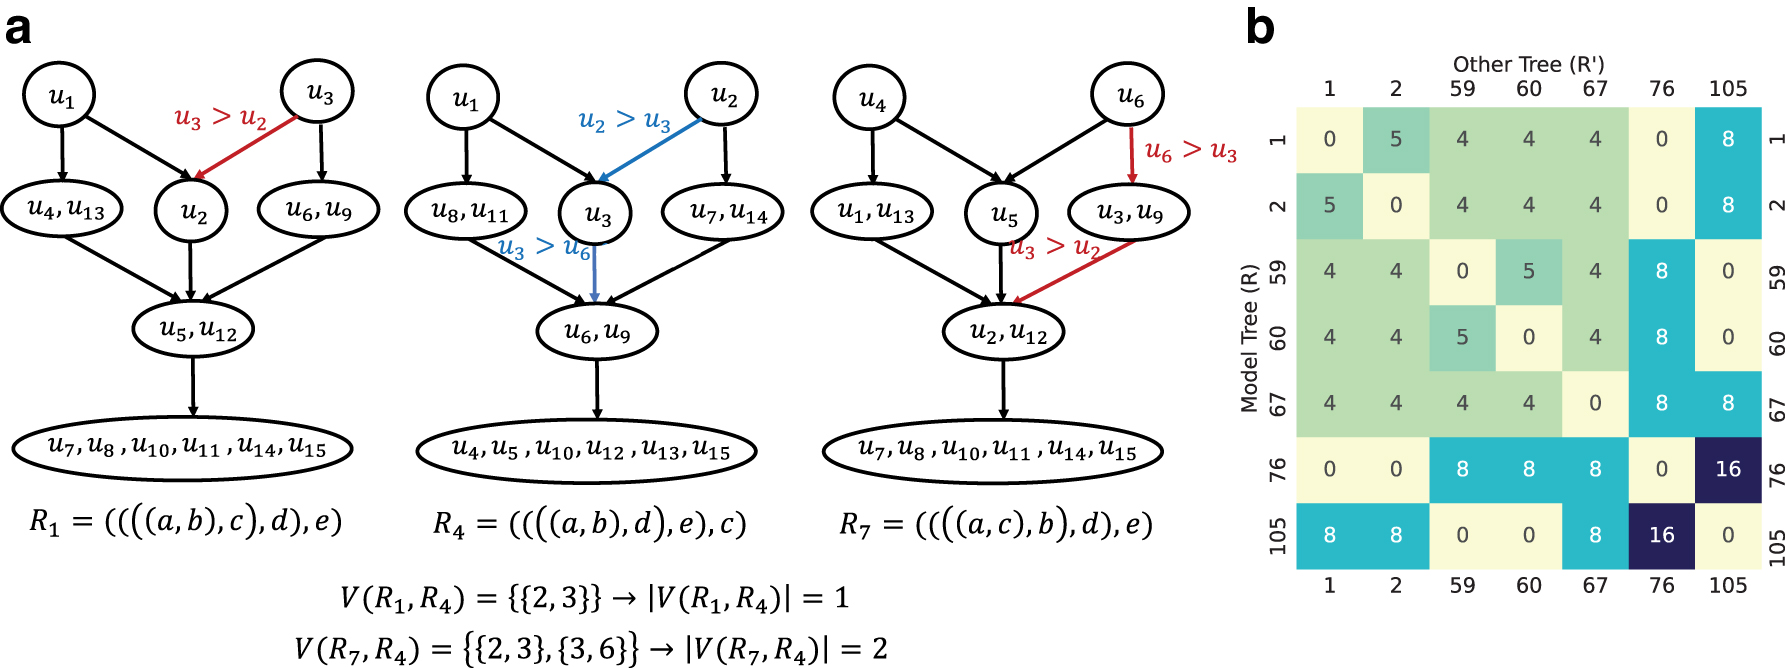
Conflicting inequality penalty terms between rooted 5-taxon species trees.
Proof. (a) In Appendix A, we provide Appendix Figures A2–A4, which show the function
(b) W.L.O.G. (Without loss of generality) assume we have a particular unrooted quintet tree T1 (see table 5 in Allman et al., 2011) so that its seven possible rootings are caterpillar trees
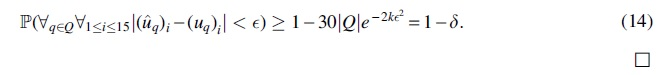
Proof. For an arbitrary 
according to the union bound. Using the Hoeffding inequality (Mitzenmacher and Upfal, 2017) for each of the 15 unrooted 5-taxon tree topologies, we get:
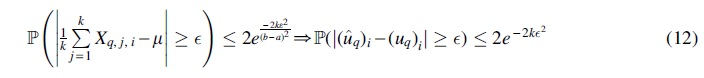
where

Setting 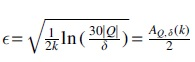 in the equation cited earlier proves the lemma:
We now establish statistical consistency for QR-STAR under the MSC and provide a sufficient condition for a set of sampled quintets that leads to consistency. That is, we prove that as the number of input true gene trees increases, the probability that QR-STAR and its variants correctly root the given unrooted species tree converges to 1. We first prove statistical consistency for QR-STAR when the model tree has only five taxa in Theorem 1 and then extend the proofs to trees with arbitrary numbers of taxa in Theorem 2.
The main idea of the proof of consistency for 5-taxon trees is that we show as the number of input gene trees increases, the cost of the true rooted tree becomes arbitrarily close to zero, but the cost of any other rooted tree is bounded away from zero, where the bound depends on the path length parameter of the model tree
To establish statistical consistency in Theorems 1 and 2, we assume that
Proof. Let
where the last inequality is a result of the assumption
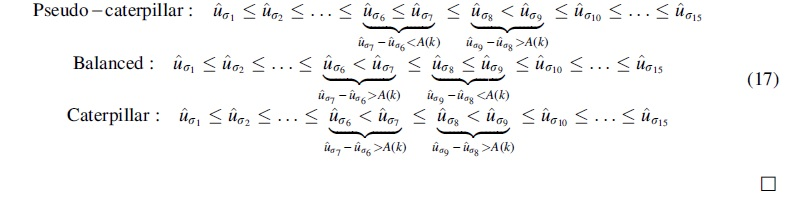
The partial orders on unrooted gene trees defined for each of the three topological shapes have a unique equivalence class whose members have the minimum probability, and for the caterpillar and balanced shapes, there is a unique class whose members have the second smallest probability. Since the distance between elements in different equivalence classes related by an inequality is greater than
Let The first step of QR-STAR determines the tree shape as pseudo-caterpillar if If Finally, when R is a caterpillar tree,
The argument is summarized next:
Proof. Let
when k is sufficiently large that
Therefore, the total sum of the inequality penalty terms in
According to Equation (16), for each invariant penalty term, we have 
The last inequality holds since (1) caterpillar trees have seven equivalence classes with class sizes 1, 1, 1, 2, 2, 2, 6 and therefore
Proof. We will show that we can find k large enough so that QR-STAR will correctly return the rooted version of R with probability at least
According to Lemma 6, when k is large enough so that
Let
Moreover, according to Lemma 5, when
Equation (20) defines a lower bound for the cost of any tree other than the true rooted tree and Lemma 6 gives an upper bound for the cost of the true tree, both with respect to the estimated quintet distribution
(which, once again, is possible under our assumption that
which means that the cost of the true rooted tree will be less than the cost of any other rooted tree on the same leafset with probability at least
As a result, QR-STAR will return the true rooted species tree topology with probability converging to 1 as the number of gene trees grows large, proving the statistical consistency for 5-leaf trees.
The next lemma and theorem extend the proof of statistical consistency to trees with
Proof. Let e be the edge in T corresponding to the root of R. Let When edge e is not incident to a leaf, it partitions the set of leaves of T into four subsets. Let For every other rooted tree Therefore, the leaves When edge e is adjacent to a leaf x, it partitions the set of taxa into three subsets, where one of them contains the single node For every other rooted tree
Lemma 7 states that no two distinct rooted trees with topology T induce the same set of rooted quintet trees on quintets of taxa in a linear encoding
There are also other quintet sets that are not a superset of
Proof. QR-STAR computes the score of each rooted tree R with topology T as  for all
According to Lemma 4,
Also, according to Definition 4, Q has the property that no other rooted tree
As a result, QR-STAR returns the true rooted topology of T with probability converging to 1 as the number of input gene trees increases, establishing the statistical consistency given trees with an arbitrary number of taxa.
Sample complexity of QR-STAR
Having established statistical consistency, we now discuss sample complexity—that is, the number of genes that suffice for QR-STAR to correctly root the model species tree with probability at least
where f and g are the lengths of the shortest internal branch and the longest internal path in R, respectively. When the linear encoding is used so that
Proof. According to the proof of Theorem 2, when k is large enough so that
When the linear encoding is used so that
Theorem 3 yields a sample complexity that is exponential in g, the length of the longest internal path in R. However, an improved sample complexity can be obtained through a more nuanced analysis as well as using a modified version of the linear encoding, as we now show.

Note that
We now define a variant of the linear encoding, which we refer to as a “short quintet encoding” of the tree. This variant is motivated by the concept of “short quartets” (which are quartets of leaves sampled around each internal edge in a tree so that they are the closest leaves to that edge) and the strong theoretical properties of the “short quartet methods,” which estimate phylogenetic trees from aligned sequences by first estimating quartet trees that seem likely to be short quartets and then combining the quartet trees into a tree on the full dataset (Erdős et al., 1999a; Erdős et al. 1999b; Roch, 2019; Warnow et al., 2001).
As proven in Erdős et al. (1999a, 1999b), even simple versions of these methods have provably polynomial sample complexity under standard models of sequence evolution down trees [e.g., the Generalized Time Reversible model (Tavaré, 1986)], after bounding (arbitrarily) the length of the shortest and longest internal edges in the model tree.
Note that there can be more than one short quintet encoding of a tree, and that every short quintet encoding is root-identifying (since each is a linear encoding).
Proof. Recall that for any set Q of quintets,
By arguments similar to the proof provided for Theorem 3 and by substituting

Note also that gQ (the length of the longest internal path of the quintet trees using the short quintets in Q) is
This means that QR-STAR has a polynomial sample complexity when we fix
Overview
We performed four experiments in this study. Experiment 0 was used for the design of QR-STAR, where we used a training dataset with 101-taxon species trees to set the numeric parameters in its cost function. Experiments 1–3 are on test datasets, which are separate from the training data. Experiments 1 and 2 examine rooting of the true or estimated species trees, respectively, on a dataset with 201-taxon trees generated using SimPhy (Mallo et al., 2016) under different model conditions.
Experiment 3 examines rooting of estimated species trees on two simulated datasets with model trees resembling real biological datasets [a 48-taxon avian species tree from Jarvis et al. (2014) and a 37-taxon mammalian tree from Song et al. (2012)]. Overall, the model conditions in the test datasets vary in terms of the number of taxa, number of genes, GTEE, level of ILS, and topological shape of the species tree.
For each model condition (both in training and in test datasets), we report the level of ILS using the average normalized RF [i.e., Robinson-Foulds (Robinson and Foulds, 1981)] distance between the model species tree and true gene trees, and denote this value by AD, or average distance. We also report the average GTEE using normalized RF distance between true and estimated gene trees.
We evaluated rooting error using normalized clade distance (nCD) (Tabatabaee et al., 2022), which is a rooted version of the normalized RF distance. For the training experiments, we also report the proportion of the trees that are correctly rooted.
For the training experiment, we only rooted the true species tree topology to directly observe the rooting error. In the test experiments, we rooted both the model species tree and estimated species tree, as produced by ASTRAL, using both true and estimated gene trees. Throughout these experiments, we set
All datasets, along with the estimated gene trees, are from prior studies (Mirarab and Warnow, 2015; Mirarab et al., 2014a; Zhang et al., 2018) and are available online. Additional information about the simulation study is provided in Appendix C.
Designing QR-STAR
We used the 101-taxon simulated datasets from Zhang et al. (2018) as our training data, which had model conditions characterized by four GTEE levels, ranging from 0.23 to 0.55 for 1000 genes. The normalized RF distance between the model species tree and true gene trees (denoted AD) in this dataset was 0.46, which indicates moderate ILS.
We explored a range of values for the shape coefficient (parameter C) and the relative weight of inequalities and invariants (the ratio
Figure 4 shows the impact of shape coefficient on the accuracy of QR-STAR, where the weights of invariant and inequality penalty terms are fixed to the weights in the original cost function of QR. For small C values (i.e., less than 1E-02), the accuracy of QR-STAR does not seem to be affected by the shape coefficient, but as C gets larger, the accuracy degrades until it reaches a stationary point again.

Impact of shape coefficient (C) on QR-STAR.
This suggests that the shape coefficient should be kept relatively small compared with the invariant and inequality penalty weights, as they may better capture the difference between two rooted quintet trees. Since Equation (21) suggests that larger C values are theoretically preferred, on the experiments on the test dataset, we set the value of C as 1E-02 (the largest value before accuracy degrades).
Figure 5 shows the impact of the ratio

Impact of
For both figures, the trends for different sequence lengths are similar, and the degradation in accuracy starts almost at the same point, but the accuracy is higher for longer sequence lengths, which is expected as shorter sequence lengths correspond to higher levels of GTEE. In general, these experiments show that optimal accuracy could be achieved for a wide range of parameters in QR-STAR. For experiments on the test dataset, we set C as 1E-02 and
Using the numeric parameters selected in Experiment 0, we compared QR-STAR to QR in two basic experiments on the test datasets. Experiment 1 compares QR and QR-STAR when rooting the true (model) species tree, given true or estimated gene trees, where the final error solely shows the rooting error. Experiment 2 compares these methods when rooting an estimated species tree produced by ASTRAL, given true or estimated gene trees, where the final error is a combination of species tree estimation and rooting error.
For this second experiment, as the clade distance from the rooted version of the ASTRAL tree is a combination of RF distance between the estimated species tree and the true species tree as well as the error produced by the rooting method, we also report the optimal rooted species tree error, which is the lowest nCD error rate achieved across all possible rootings of the ASTRAL tree (see Appendix D for additional comments).
Datasets
We used a set of 201-taxon simulated datasets from Mirarab and Warnow (2015) as our test data; these are characterized by two different speciation rates and three tree heights (thus six tree shapes), and three number of genes for each tree shape. The AD levels for this dataset for 1000 genes ranged from 0.09 (for the 10M, 1e-07 condition) to 0.69 (for the 500K, 1e-06 condition).
The estimated gene trees were inferred using FastTree 2 (Price et al., 2010). The GTEE levels on the test data varied from 0.22 (for the 10M, 1e-06 condition) to 0.49 (for the 500K, 1e-06 condition). Appendix Table C1 in the Appendix C summarizes these statistics. The number of replicates for each model condition in this dataset was 50.
We also performed experiments on the 48-taxon avian-like and 37-taxon mammalian-like simulated datasets from Mirarab et al. (2014a), which had model species trees based on biological datasets from Jarvis et al. (2014) and Song et al. (2012), respectively. The default model condition in these datasets (shown with 1X ILS) had an ILS level that resembled the gene tree discordance in the corresponding biological data, but additional model conditions were created by multiplying or dividing branch lengths by two, thus decreasing or increasing the level of ILS, respectively (i.e., the highest ILS level we test for each biological dataset is indicated by 0.5X).
True gene trees were simulated within the model species trees under the MSC, and then sequences with varying lengths were evolved under each gene tree. Finally, RAxML (Stamatakis, 2014) was used to estimate gene trees from these sequence alignments, creating conditions with varying GTEE levels. These datasets had 20 replicates in each model condition, but the model tree in all replicates was the same tree from the corresponding biological study. Appendix Tables C2 and C3 in the Appendix C summarize the statistics for these two datasets.
Results for experiment 1: rooting the true species tree
Figure 6 (left) shows the result of rooting the model species tree with true gene trees on the test datasets. These results show that rooting error for both QR and QR-STAR decreases with the number of genes, as expected. We also see that rooting error is lowest for the highest ILS level (left-most column), and it increases as the ILS level decreases.
Rooting the model species tree on 201-taxon simulated datasets. Comparison between QR and QR-STAR in terms of rooting error (nCD) for rooting the true unrooted species tree topology using true or estimated gene trees on the 201-taxon datasets, with 50 replicates in each model condition. The columns show tree height (500K for high ILS, 2M for moderate ILS, and 10M for low ILS), and the rows show speciation rate (1e-06 for recent speciation, 1e-07 for deep speciation). ILS, incomplete lineage sorting.
The impact of speciation rate on rooting error is seen by comparing the top and bottom rows; this impact is small except for the lowest ILS case, where deep speciation (1e-07) generally leads to lower error than recent speciation (1e-06). A comparison of nCD error rates for QR and QR-STAR shows that the two methods are close in accuracy for some conditions (notably for high or moderately high ILS with a sufficient number of genes) but when there are differences, QR-STAR has lower rooting error.
The advantage for QR-STAR over QR is largest for conditions with moderate to low ILS, and a few genes. However, under the lowest ILS condition and with speciation rate 1E-06 (bottom right subfigure), there is a consistent advantage to QR-STAR across all numbers of genes.
Figure 6 (right) shows the same comparison with estimated gene trees. As with true gene trees, increasing the ILS level (by reducing tree height) decreases the rooting error, increasing the number of genes also generally reduces rooting error (although much less under the lowest ILS level where tree height is 10M), and changing the speciation rate has a small impact (even on the low ILS condition).
A comparison between QR and QR-STAR shows that the relative accuracy depends on the ILS level. For the highest ILS condition (leftmost column), QR and QR-STAR are very close but with possibly a small advantage to QR. However, for moderate to low ILS conditions, QR-STAR matched or improved on QR.
Figure 7 show results on the test dataset, when rooting species trees estimated using ASTRAL with true or estimated gene trees. For all three methods (QR, QR-STAR, and optimal rooting), and using both true and estimated gene trees, increasing the number of genes improves accuracy, but increasing the ILS level reduces accuracy (in contrast to Experiment 1).

Rooting the ASTRAL species tree on 201-taxon datasets. Comparison between QR, QR-STAR, and optimal rooting in terms of rooted species tree error (nCD) for rooting the species trees estimated by ASTRAL, using true or estimated gene trees on the 201-taxon datasets across 50 replicates. The columns show tree height (500K for high ILS, 2M for moderate ILS, and 10M for low ILS), and the rows show speciation rate (1e-06 for recent speciation, 1e-07 for deep speciation). The y-axes are cut at 0.4 to improve clarity, removing five outliers in the bottom figure from all methods in the 500K, 1e-06 model condition (see Appendix Fig. A6 in Appendix A for the full-scale figure).
We also see that under high ILS, the error in the rooted species tree is high (on average 14.6% when using only 50 true gene trees, and 21.4% when using 50 estimated gene trees), but decreases rapidly as the number of genes increases. Error is higher for speciation close to the leaves (1e-06) than for speciation closer to the root (1e-07), a pattern that was also observed when rooting the model species tree.
The trends relating QR-STAR and QR are interesting to discuss. When using true gene trees, the relative accuracy of QR and QR-STAR depends on the ILS level, with an essentially identical error for the high ILS condition, but then an advantage to QR-STAR for the moderate or low ILS conditions (except when there is a sufficient number of genes).
When used with estimated gene trees, the relative accuracy between QR and QR-STAR depends on the ILS level, but the gap between QR and QR-STAR is smaller. There is essentially no difference for the high ILS condition, a very small difference for the moderate ILS condition (but only if the number of genes is small), and a small difference for the low ILS condition that holds across both low and moderate numbers of genes.
Thus, the trends for rooting ASTRAL species trees are somewhat different in terms of absolute rooting error (which increases, compared with rooting the true species tree), but the relative performance of QR-STAR and QR shows similar results as for rooting true species trees. The main difference is that the difference between the methods seems to have decreased.
Finally, a comparison between QR-STAR and the optimal rooting provides some noteworthy trends. Specifically, for both true and estimated gene trees and under both high and moderate ILS, QR-STAR and optimal rooting are extremely close in terms of rooting error (with no detectable differences under high ILS and only a small difference under moderate ILS with only 50 genes).
Thus, under these conditions, there is little room for improvement over QR-STAR. Interestingly, there is a bigger gap between QR-STAR and optimal rooting for low ILS than under the higher ILS conditions, especially when the speciation rate is 1e-06 (i.e., speciation toward the leaves). We also see that there is a slightly bigger gap between QR-STAR and the optimal rooting when QR-STAR is using estimated gene trees than when using true gene trees; as expected.
Figure 8 shows results when using QR or QR-STAR to root the ASTRAL species trees on the avian or mammalian simulated datasets. Most trends are similar to the trends seen on 201-taxon datasets: accuracy with true gene trees is better than with estimated gene trees, and using more genes improve the results, as expected. The accuracy advantage of QR-STAR over QR can be seen in these two datasets as well, especially with true gene trees or low ILS.

Rooting the ASTRAL species tree on biological simulations. Comparison between QR, QR-STAR, and optimal rooting on (left) 48-taxon avian simulated datasets, (right) 37-taxon mammalian simulated datasets, both from Mirarab et al. (2014a). The columns show the ILS level, and the rows show whether true or estimated gene trees (based on 500 bp sequences) were used. For both datasets, the number of replicates in each model condition is 20, but the model species tree is fixed across all replicates.
However, unlike the 201-taxon datasets where the accuracy of QR-STAR was close to optimal in most cases, here we see a bigger gap between the optimal rooting and QR-STAR in general. On the mammalian simulated datasets, this gap is small under the highest ILS condition (0.54 AD) and the medium ILS (0.33 AD) with true gene trees, but there is a larger gap in the other three conditions.
On the avian simulations, this gap is visible in all model conditions, but it becomes smaller as ILS level increases. For the avian simulations, the overall rooted species tree error is higher under high ILS conditions, suggesting that the error is dominated by species tree estimation error (Appendix Table C6 in Appendix C), and is consistent with the trend seen on the 201-taxon datasets.
However, this trend is reversed for the mammalian simulations, and the final rooted tree error is higher under the lowest ILS (0.18 AD) condition when rooting with QR-STAR (also see Appendix Table C5 in the Appendix C for ASTRAL RF rates).
Some trends seen here are as expected: for example, accuracy generally improves for both QR and QR-STAR with the number of genes, and using true gene trees produces better accuracy than using estimated gene trees. These trends can be explained by noting that more data and better-quality data improve accuracy. On the other hand, we also see that the combination of low ILS and deep speciation (toward the root) makes for easier conditions for both QR and QR-STAR, whereas low ILS and recent speciation (toward the leaves) makes for more challenging conditions for QR and QR-STAR; it is not clear why this is true.
An interesting trend seen in our experimental study is that rooting with QR and QR-STAR is more accurate under higher levels of discordance due to ILS, and becomes less accurate as the ILS level decreases. An explanation for this is that for a fixed number of gene trees, with less discordance due to ILS, it is likely that many gene trees that have low probability of appearing will not appear in the input, or will appear with very low frequencies, thus leading to higher error in the estimated probability distribution on quintet trees.
This will increase error in the rooting performed by QR and QR-STAR. Further, when enough gene trees fail to appear in the distribution, some estimates of quintet probabilities would become zero, and it may not be possible to differentiate some of the rooted quintets using the inequalities and invariants derived from the ADR theory.
In the extreme case where there is no discordance due to ILS (and so all true gene trees are identical to the species tree), there will be only one quintet gene tree with non-zero probability: when this happens, the identifiability theorem in Allman et al. (2011) would not hold and it becomes impossible to find the root. In contrast, the accuracy of ASTRAL and other species tree estimation methods decreases under higher levels of ILS (Mirarab and Warnow, 2015; Mirarab et al., 2014b; Molloy and Warnow, 2018).
Inference of the rooted species tree depends on both accurate estimation of the unrooted species tree topology as well as correct rooting of that tree. However, the level of ILS has a very different impact on these two steps. In most cases in our study, the overall error was dominated by species tree estimation error, and hence increased as the ILS level increased.
However, we saw a different trend on the mammalian dataset, in which the species tree estimation error was very low in the lowest ILS condition, but the rooting error was high such that the overall error was dominated by rooting error. In general, for the purposes of estimating a rooted species tree using this approach, moderate levels of ILS may make for a better overall outcome than very low or very high levels of ILS.
Another important trend is that QR-STAR is nearly always at least as accurate as QR, and it is more accurate under most conditions. In general, there is a clear advantage to QR-STAR over QR for the low ILS condition that holds across the different conditions (varying number of genes, using true or estimated gene trees, and rooting true or estimated species trees), and this advantage is also seen for the moderate ILS condition when the number of genes is small.
In contrast, for the high ILS condition, there is typically no or very little difference between the two methods, and in some cases QR can be somewhat more accurate. We also note that QR-STAR's advantage over QR is largest when using true gene trees, even under high ILS (Fig. 6), which suggests that QR may be somewhat more robust to GTEE than QR-STAR. Thus, QR-STAR has a theoretical advantage over QR but not always an accuracy advantage.
For many conditions, we observed a small gap between optimal rooting and QR-STAR. For example, on the 201-taxon dataset in moderate or high ILS conditions (Experiment 2), there was a very small difference in rooting error between QR-STAR and the optimal rooting, even using estimated gene trees, suggesting that QR-STAR is doing very well in these conditions.
Under the low ILS conditions of the 201-taxon data, however, there is a larger gap between QR-STAR and optimal rooting, especially when using only a small to moderate number of estimated gene trees. We also saw a larger gap between QR-STAR and the optimal rooting in Experiment 3 where the model trees were based on the avian and mammalian datasets, although the gap was less under the high ILS conditions than for the low ILS conditions.
These differences indicate that there are conditions where improvements to QR-STAR for its empirical performance should be sought, especially when the ILS level in the data is low. There are at least two ways to improve empirical performance, without sacrificing statistical consistency—modifying the cost function and changing the quintet sampling strategy—and both of these should be explored in future work.
CONCLUSIONS
We have presented QR-STAR, a polynomial-time statistically consistent method for rooting species trees under the MSC model. QR-STAR is an extension to QR, a method for rooting species trees introduced in Tabatabaee et al. (2022). QR-STAR differs from QR in that it has an additional step for determining the topological shape of each unrooted quintet selected in the QR algorithm, and incorporates the knowledge of this shape in its cost function, alongside the invariants and inequalities previously used in QR.
We also showed that the statistical consistency for QR-STAR holds for a larger family of optimization problems based on cost functions and sampling methods, and that modifying the linear encoding to be based on short quintets enables QR-STAR to have polynomial sample complexity.
To the best of our knowledge, this is the first work that established the statistical consistency of any method for rooting species trees under a model that incorporates gene tree heterogeneity. It remains to be investigated whether other rooting methods can also be proven statistically consistent under models of gene evolution inside species trees, such as the MSC or models of GDL.
For example, STRIDE (Emms and Kelly, 2017) and DISCO+QR (Willson et al., 2023) are methods that have been developed for rooting species trees from gene family trees, where genes evolve under GDL; however, it is not known whether these methods are statistically consistent under any GDL model.
This study suggests several directions for future research. For example, we proved statistical consistency for one class of cost functions, which was a linear combination of the invariant, inequality, and shape penalty terms; however, cost functions in other forms could also be explored and proven statistically consistent.
Theorem 3 shows that the sample complexity of QR-STAR depends on both the length of the shortest branch and the longest path in the model tree. This suggests that having very short or very long branches can both confound rooting under ILS, which is also suggested in previous studies (Alanzi and Degnan, 2017; Allman et al., 2011). This is unlike what is known for species tree estimation methods such as ASTRAL, where the sample complexity is only affected by the shortest branch of the model tree (Chan et al., 2022; Shekhar et al., 2017), and trees with long branches are easier to estimate.
Another theoretical direction is the construction of the rooted species tree directly from the unrooted gene trees. As explained in Remark 2, the proof of consistency of QR-STAR for 5-taxon trees does not depend upon the knowledge of the unrooted tree topology; this suggests that it is possible to estimate the rooted topology of the species tree in a statistically consistency manner directly from unrooted gene tree topologies. Future work could focus on developing statistically consistent methods for this problem, which is significantly harder than the problem of rooting a given tree.
There are also directions for improving empirical results. An important consideration in designing a good cost function is its empirical performance, as many cost functions can lead to statistical consistency but may not provide accurate estimations of the rooted tree in practice (Figs. 4 and 5).
One potential direction is to incorporate estimated branch lengths, whether of the gene trees or of the unrooted species tree, into the rooting procedure. These improvements can especially be useful for datasets with low levels of ILS, which create the most difficult conditions for QR-STAR and where there is a gap between the accuracy of QR-STAR and the optimal rooting.
Finally, the experiments in this study were limited to comparisons between QR, QR-STAR, and the optimal rooting of the ASTRAL species trees. In our prior study presenting QR (Tabatabaee et al., 2022), we showed that QR had good accuracy compared with many prior rooting methods. That study, however, was restricted to a small number of model conditions. Hence, future work should also include a comparison of QR-STAR to a larger number of rooting methods, including outgroup rooting, and under a wider range of model conditions.
Footnotes
CODE AND DATA AVAILABILITY
QR-STAR is available at https://github.com/ytabatabaee/Quintet-Rooting. The scripts and data used in this study are available at ![]() .
.
ACKNOWLEDGMENTS
S.R. thanks Cécile Ané and her group for helpful discussions. Y.T. thanks Mohammed El-Kebir for helpful suggestions on an earlier version of this work.
AUTHORs' CONTRIBUTIONS
The authors all contributed to conceptualization, formal analysis, writing, review, and editing. Y.T.: software, visualization, investigation, methodology, data curation, and original draft preparation. S.R.: methodology, investigation, and funding acquisition. T.W.: investigation, project administration, supervision, funding acquisition, and resources.
AUTHOR DISCLOSURE STATEMENT
The authors declare they have no conflicting financial interests.
FUNDING INFORMATION
S.R. was supported by NSF grants DMS-1902892, DMS1916378, and DMS-2023239 (TRIPODS Phase II), as well as a Vilas Associates Award. T.W. was supported by the Grainger Foundation. Y.T. was supported in part by UIUC C.L. and Jane W-S. Liu Award.