




Abstract
Most tools for analyzing large gene expression datasets, including The Cancer Genome Atlas (TCGA), have focused on analyzing the expression of individual genes or inference of the abundance of specific cell types from whole transcriptome information. While these methods provide useful insights, they can overlook crucial process-based information that may enhance our understanding of cancer biology. In this study, we describe three novel tools incorporated into an online resource; gene set-based analysis of The Cancer Genome Atlas (GS-TCGA). GS-TCGA is designed to enable user-friendly exploration of TCGA data using gene set-based analysis, leveraging gene sets from the Molecular Signatures Database. GS-TCGA includes three unique tools: GS-Surv determines the association between the expression of gene sets and survival in human cancers. Co-correlative gene set enrichment analysis (CC-GSEA) utilizes interpatient heterogeneity in cancer gene expression to infer functions of specific genes based on GSEA of coregulated genes in TCGA. GS-Corr utilizes interpatient heterogeneity in cancer gene expression profiles to identify genes coregulated with the expression of specific gene sets in TCGA. Users are also able to upload custom gene sets for analysis with each tool. These tools empower researchers to perform survival analysis linked to gene set expression, explore the functional implications of gene coexpression, and identify potential gene regulatory mechanisms.
INTRODUCTION
Cancer is a leading cause of mortality worldwide. Despite progress in the diagnosis, treatment, and prevention of cancer, there were nearly 10 million cancer-related deaths in 2020 alone (World Health Organization, n.d.). The application of high-throughput sequencing-based approaches to map tumor genetics, epigenetics, and gene expression across large numbers of cancer patients, and associate them with clinical parameters such as survival, has revolutionized cancer research.
The Cancer Genome Atlas (TCGA) has enabled access to in-depth molecular characterization of a large number of human cancers. The Pan-Cancer Atlas represents a subset of TCGA dataset curated to allow comparison of gene expression, genomic and epigenetic data across a variety of cancer types (Weinstein et al., 2013). The Pan-Cancer Atlas dataset contains data from over 9000 tumors across 33 different cancer types (Weinstein et al., 2013).
Gene set enrichment analysis (GSEA) is a commonly used analytical approach for determining the enrichment of experimentally, computationally, or manually defined groups of genes (a gene set) within global gene expression changes, as measured by high-throughput RNA sequencing or microarrays (Subramanian et al., 2005).
A large library of experimentally, computationally, and manually derived gene sets is available from the Molecular Signatures Database (MSigDB), including manually curated gene sets with known involvement in specific biological processes (Hallmark), experimentally curated gene sets (e.g., C2: curated gene sets), and experimentally determined gene sets with relevance to specific processes (e.g., C7: immunologic signature gene sets) (Godec et al., 2016; Liberzon et al., 2015; Liberzon et al., 2011; Subramanian et al., 2005).
When coupled with MSigDB gene sets, GSEA enables the enrichment of biological processes, gene regulatory phenomena, or cell types to be inferred from differences in gene expression between samples and treatment conditions. The method determines whether genes composing gene sets are distributed randomly within the global gene expression changes between two groups, or are enriched among up- or downregulated transcripts (Subramanian et al., 2005).
The gene set-based analysis of The Cancer Genome Atlas (GS-TCGA) web tools described in this article utilize the rich resource of gene sets in MSigDB to derive biological process-based information pertaining to cancer biology and survival from TCGA data. One tool focuses on determining how the enrichment of specific gene sets associates with patient survival, and two tools can be used to infer novel gene functions by exploiting the heterogeneity present in TCGA gene expression data to identify coregulation of genes with related gene sets.
Enabling analysis of over 15,000 gene sets in over 9000 cancer samples of 32 cancer types, GS-TCGA provides an accessible online user interface for researchers to investigate genes or biological processes of interest and can be a useful resource in hypothesis generation when investigating genes and processes implicated in cancer biology. GS-TCGA is available online at http://gs-tcga.roychoudhurilab.org/
METHODS
Data and code availability and preprocessing
Pan-Cancer Atlas source data are publicly available and were downloaded from the Genomic Data Commons platform (Jensen et al., 2017; https://gdc.cancer.gov/about-data/publications/pancanatlas), from which gene expression and clinical data were used. The EBPlusPlusAdjustPANCAN_IlluminaHiSeq_RNASeqV2.geneExp.tsv file (synapse ID 4976363) containing RNA-Seq data was downloaded for analysis. This file contains transcripts per million (TPM) data that were processed and normalized using RNA-Seq by expectation maximization (RSEM) (Li and Dewey, 2011) and were subject to batch normalization, as detailed in the synapse description. The clinical data are from TCGA-CDR-SupplementalTableS1.xlsx table (Liu et al., 2018). Only primary tumors were used in the analysis.
Table 1 describes the gene sets used in GS-TCGA, all of which were downloaded from MSigDB (Godec et al., 2016; Liberzon et al., 2015, 2011; Subramanian et al., 2005). The Human_Gene_Symbol_with_Remapping_MSigDB.v2023.2.Hs.chip file was downloaded from MSigDB and used to map gene symbols in the Pan-Cancer Atlas data to those used in MSigDB (Godec et al., 2016; Liberzon et al., 2015, 2011; Subramanian et al., 2005).
Gene Sets Used in the Gene Set-Based Analysis of the Cancer Genome Atlas
Gene Sets Used in the Gene Set-Based Analysis of the Cancer Genome Atlas
All tools were developed using R, version 4.3.0, and run as ShinyApps instances from the shinyapps.io server. The code is available in Supplementary Data and on GitHub at https://github.com/TBar123/gs-tcga
Users select the tumor type, gene of interest, correlation method, and a collection of MSigDB gene sets. Individual tumor cases can also be selected for exclusion from analysis. Using the selected options, Pearson's or Spearman's correlation is used to calculate the correlation coefficient between the expression of the selected gene and all other genes within all tumor gene expression profiles of the selected cancer type.
The genes are then rank ordered by decreasing the correlation coefficient, and this is passed to the fgsea function of the R fgsea package (version 1.26.0; Korotkevich et al., 2021) to perform GSEA. The co-correlative GSEA (CC-GSEA) tool generates a table of results and a volcano plot of normalized enrichment scores (NESs) against –log10(Padj). Users can select a specific gene set to plot an enrichment plot using the plotEnrichment function of the R fgsea package (Korotkevich et al., 2021) and generate summary statistics.
All outputs are available for download, including all plots and tables, the list of tumor cases used in the analysis, and the leading edge.
The CC-GSEA (Custom) tab allows users to perform a similar analysis using a user-defined gene list rather than an MSigDB gene set. The gene set must include human gene symbols and can be pasted into the website or uploaded as a comma separated values (csv) file.
Analytical approach used in GS-Corr
Users select a cancer type, gene set of interest, and correlation method and have the option to select individual patient cases for exclusion from analysis. All genes with the upper quartile of expression <10 reads are removed, and gene expression is scaled to between 0 and 1 using the R rescale function from the scales package (version 1.2.1; Wickham and Seidel, 2022). This value is then used to calculate the median expression of genes listed in the selected MSigDB gene set.
The median expression of the gene set of interest is correlated with expression of all other genes, excluding those included in the gene set of interest. Correlation coefficients are calculated using either Pearson's or Spearman's correlation, as selected by the user. The correlation coefficients are outputted into a table ordered by decreasing correlation coefficient. The list of genes in the selected gene set is also provided.
GS-Corr (Custom) performs the same analysis as GS-Corr using a user input gene list rather than a predefined MSigDB gene set. The gene list must include human gene symbols and can be pasted into the website or uploaded as a csv file. The Gene Set Membership tab outputs a list of gene sets containing the user-selected gene of interest. All tables outputted by the tool and a table of the tumor cases used in analysis are available for download.
Analytical approach used in GS-Surv
Users select a cancer type and gene set of interest and have the option to select individual patient cases for exclusion from analysis. All genes with the upper quartile of expression <10 reads are removed, and gene expression is scaled to between 0 and 1 using the rescale function from the R scales package (version 1.2.1; Wickham and Seidel, 2022). These data are then used to calculate the median expression of genes listed in the selected MSigDB gene set.
Patients are then ranked by median relative expression of the selected gene set and stratified into groups based upon median gene set expression. These groups are then subject to Kaplan–Meier analysis (Kaplan and Meier, 1958) to define survival of the patient groups. There are two options available to define the patient categories, using either a cutoff at the median gene set expression or two cutoffs separating patients into three groups of equal size. Kaplan–Meier plots are produced for each of the stratification options using the survival (version 3.5-5; Therneau, 2023; Therneau and Grambsch, 2000) and survminer packages (Kassambara et al., 2021), with the number of patients per group reported in the figure legend.
The tool reports Cox proportional hazards (CoxPH) ratios and p values generated using the median gene set expression as continuous variables, and also CoxPH ratios, CoxPH p values, and log-rank test p values generated using high, mid, and low gene set expression as a categorical variable (Cox, 1972; Mantel, 1966). CoxPH analysis and log-rank tests were performed using the R survival package (version 3.5-5; Therneau, 2023; Therneau and Grambsch, 2000). The tool also outputs a histogram of the distribution of median gene set expression across patients with the relevant cutoff point(s) marked and a list of genes in the selected pathway.
The GS-Surv (Custom) analysis follows the same procedure as GS-Surv, but the input is a user-defined gene list rather than an MSigDB gene set. The tool requires human gene symbols, and gene lists can either be uploaded as a csv or pasted into the relevant box.
All outputs are available for download, including the tumor cases included in the analysis and their individual median relative gene set expression values.
RESULTS
GS-Surv determines the association between expression of gene sets and survival in human cancer
While widely accessible tools exist to analyze the association between the expression of individual genes and survival within TCGA data (Li et al., 2020; Xu et al., 2019), there is a lack of accessible tools enabling examination of the relationship between expression of modules of genes driven by specific biological processes and cancer survival.
We therefore developed GS-Surv, which determines the association between the average expression of genes composing gene sets within MSigDB and cancer survival, using data from TCGA Pan-Cancer Atlas (Fig. 1A). First, the average relative expression of the genes composing a selected gene set within the gene expression profiles of each patient tumor of a selected cancer type is calculated. Patients are then ranked based on relative gene set expression and stratified into those with high and low expression, or high, medium, and low expression, and a Kaplan–Meier analysis (Kaplan and Meier, 1958) is performed to define survival of patient groups.
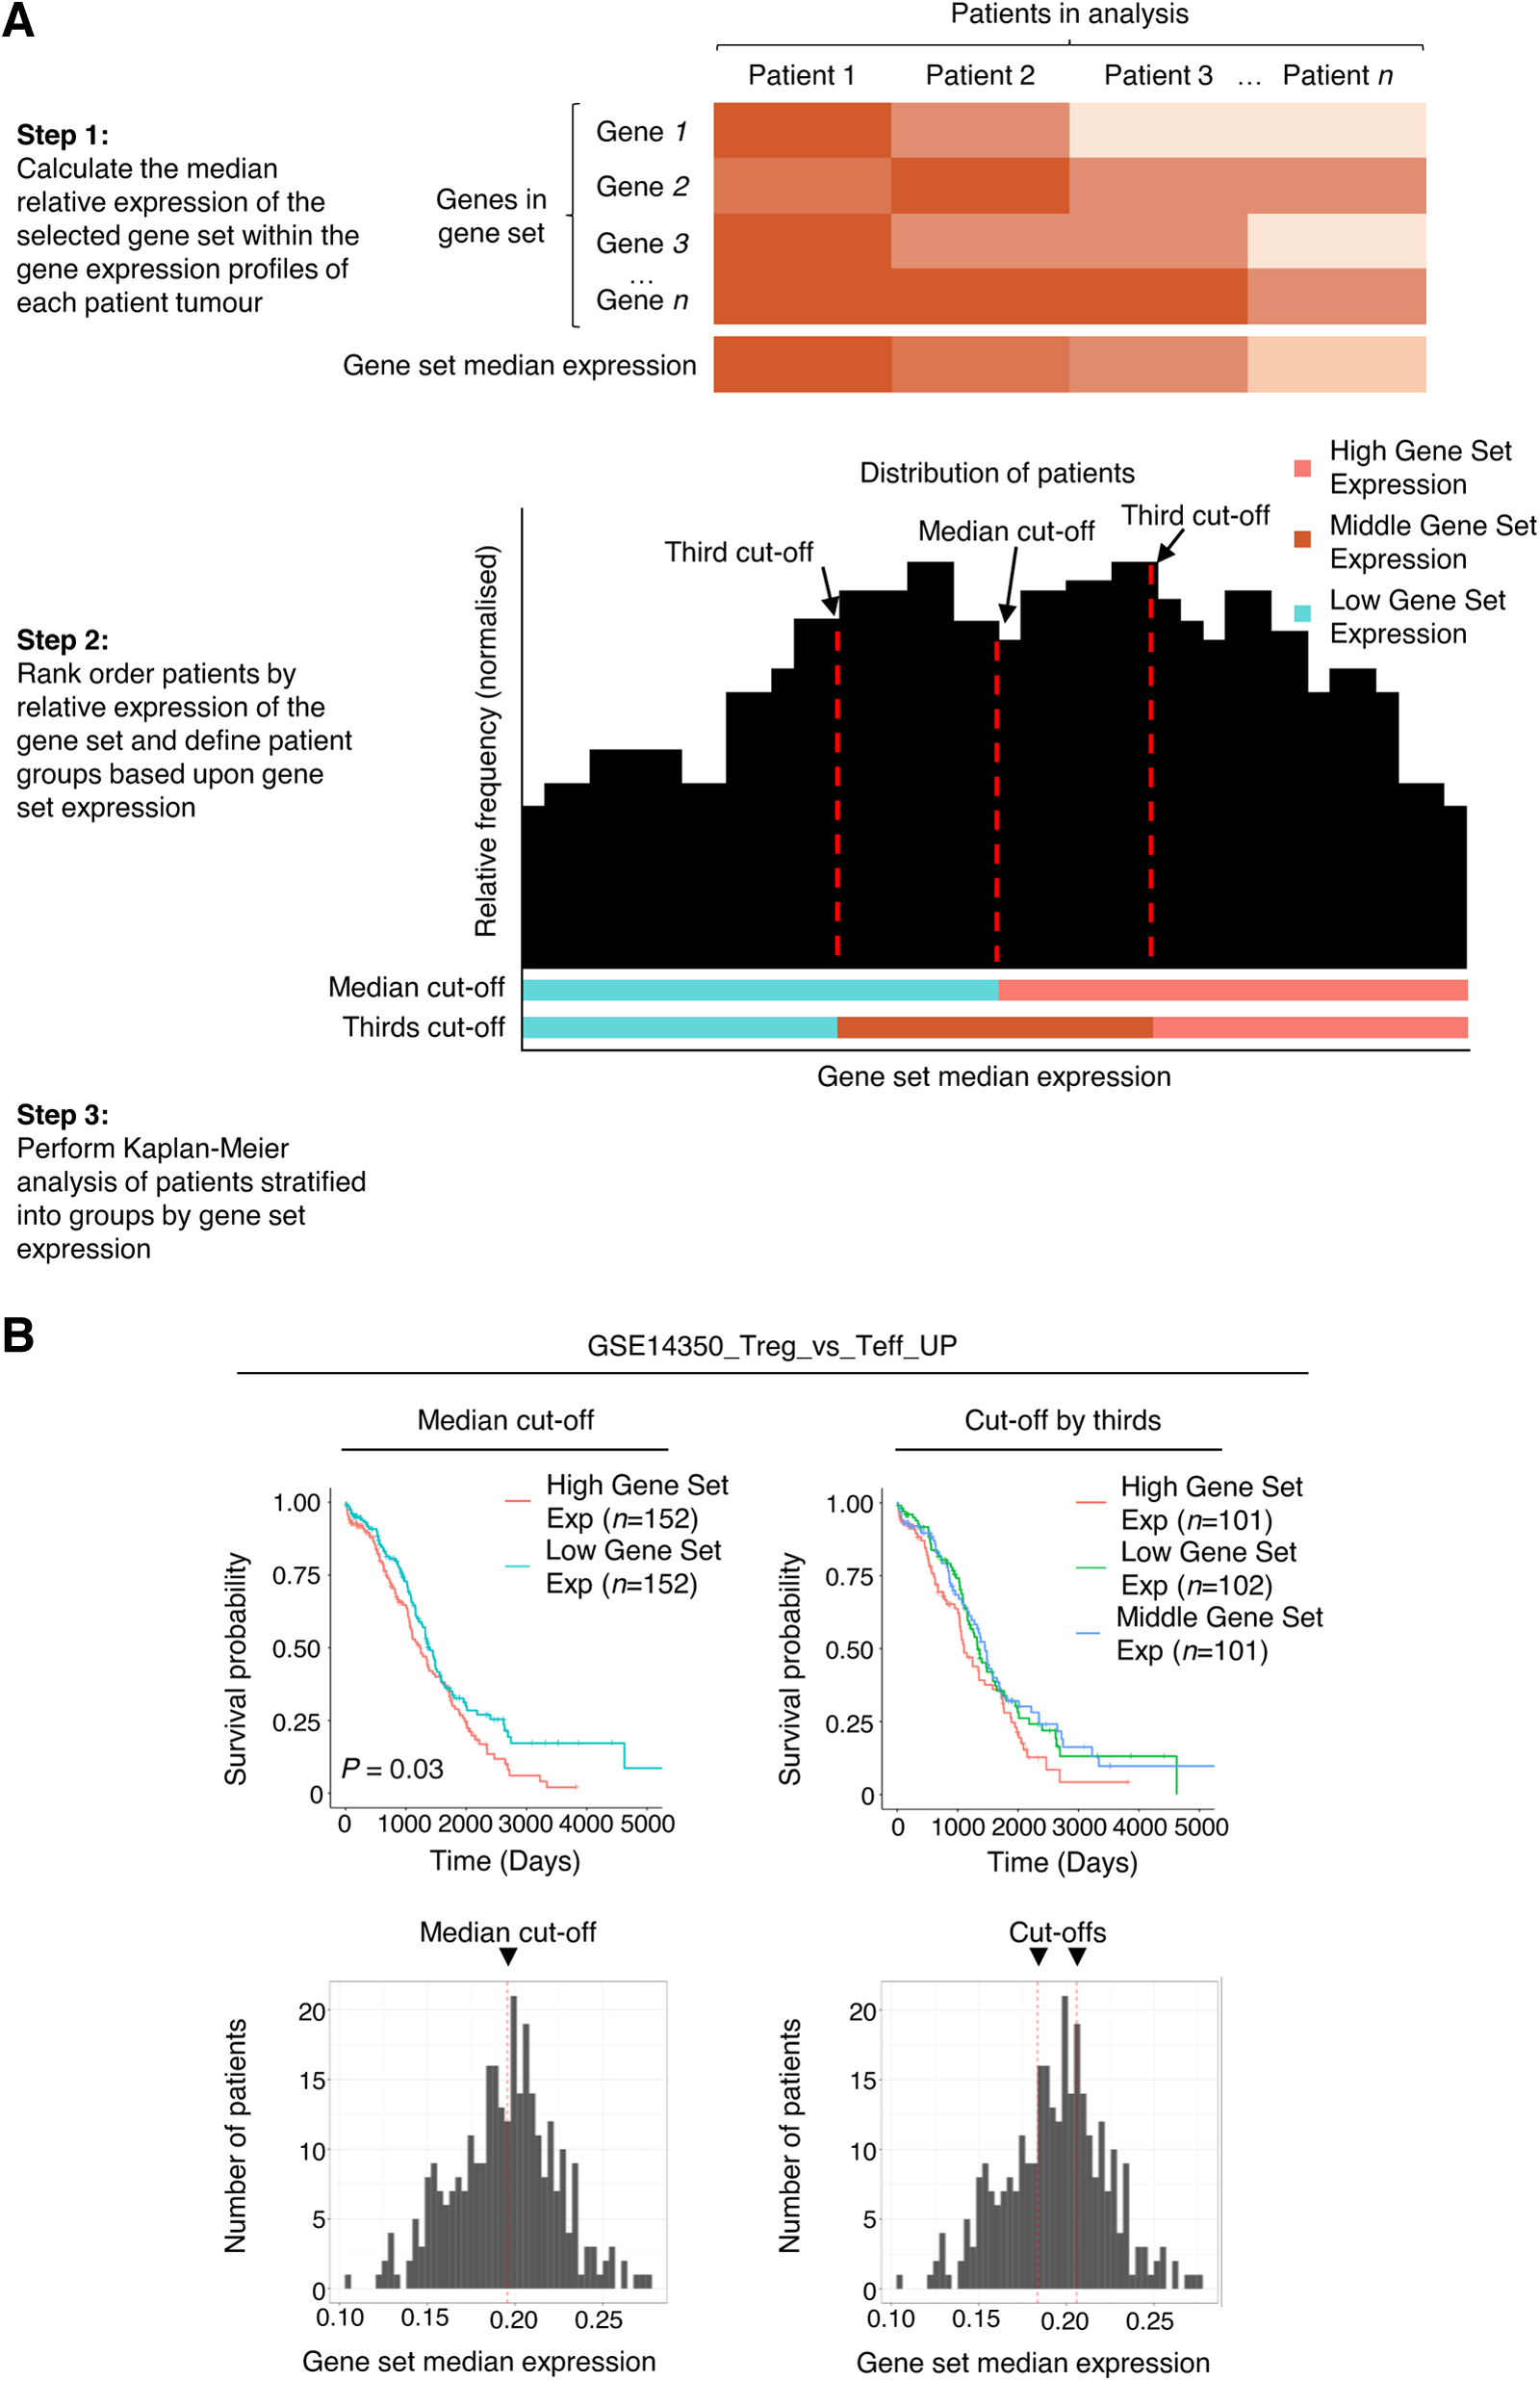
The GS-Surv tool determines the association between expression of gene sets and survival in human cancers.
Two cutoff types for stratifying patients by gene set expression can be selected—the first is a median cutoff, which splits the patient cohort into two groups of approximately equal size based on high/low expression, and the second method uses two cutoffs to separate patients into three groups (low/mid/high) of equal size.
The tool produces Kaplan–Meier overall survival plots and histograms showing the distribution of median gene set expression across patients within the selected cancer type, with the position of the selected cutoff(s) marked. The tool also performs CoxPH analysis and the log-rank test on the data and generates a list of genes in the selected pathway (Cox, 1972; Mantel, 1966).
The GS-Surv (Custom) tool performs the same function with the same outputs as GS-Surv, but takes a user-defined custom gene list as an input instead of predefined gene sets from MSigDB. This tool allows users to test whether the expression of an experimentally, computationally, or manually selected set of genes is associated with differences in cancer survival.
CD4+ Treg cells represent an immunosuppressive subset of CD4+ T cells with known roles in tumor immunosuppression (Ohue and Nishikawa, 2019). The relative enrichment of Treg cells over conventional CD4+ T cells is a prognosticator of cancer survival in a number of cancer types (Quezada et al., 2011; Roychoudhuri et al., 2015).
We used GS-TCGA to test whether the differential expression of the gene set, GSE14350_Treg_vs_Teff_UP, which comprises genes upregulated in Treg cells compared with CD4+ conventional T cells (Yu et al., 2009), is associated with differences in survival in ovarian serous cystadenocarcinoma patients. We observed a significant reduction in survival in patients with high expression of genes composing the GSE14350_Treg_vs_Teff_UP gene set when patients were stratified into groups using the median cutoff (Fig. 1B). This is consistent with a role of Treg-associated genes in cancer immunosuppression and poor patient prognosis (Ohue and Nishikawa, 2019).
Heterogeneity in gene expression between tumor samples is an important potential source of information regarding gene coregulation and function. We hypothesized that GSEA of genes coregulated with a given gene may enable insights into the biological function of that gene.
GSEA has typically focused on discovery of enrichment of gene sets within gene expression datasets. CC-GSEA extends this framework to examine enrichment/biased distribution of MSigDB gene sets within genes rank ordered by their co-correlation with a gene of interest (Fig. 2A). This enables insights into the biological function of the selected gene based on GSEA of its co-correlated transcripts.

The CC-GSEA tool infers functions of genes based on GSEA of coregulated transcripts in TCGA.
Users select a gene, cancer type of interest, correlation method, any tumors to be excluded from the analysis, and the collection of MSigDB gene sets of relevance to the analysis (e.g., C2: curated gene sets, or C7: immunologic gene sets) (Godec et al., 2016; Liberzon et al., 2015, 2011; Subramanian et al., 2005).
First, correlation between the expression of the selected gene and all other genes within the tumor gene expression profiles of the selected cancer type is calculated, resulting in a set of Pearson or Spearman correlation coefficients for each gene. Second, the genes are rank ordered based on their correlation coefficient, and this rank-ordered list is used as input for GSEA. CC-GSEA outputs a table of gene sets rank ordered by their NES (Korotkevich et al., 2021; Subramanian et al., 2005).
In addition to standard statistics, the tool also reports the leading edge, which lists the genes contributing most greatly to the enrichment score (Subramanian et al., 2005). The tool produces a volcano plot of NES and −log10(Padj) values, with significant pathways highlighted in red. The user can also select a specific gene set of interest, prompting the tool to output an enrichment plot and a table of summary statistics for that gene set.
CC-GSEA (Custom) allows users to perform CC-GSEA on a user-defined gene set rather than a predefined gene set from MSigDB. This tool allows users to explore whether their chosen list of genes is enriched within co-correlates of their selected gene of interest.
CD8α, encoded by the gene CD8A, is a marker of cytotoxic T cells (Raskov et al., 2021). We performed CC-GSEA on CD8A to test whether CC-GSEA can identify the cytotoxic function of CD8+ T cells in skin cutaneous melanoma. The top ten genes with expression positively correlated to CD8A expression are known to be enriched in lymphocytes (Fig. 2B; Chauvin and Zarour, 2020; Dehmani et al., 2021; Deng et al., 2019; Ge et al., 2019; Kioussis and Ellmeier, 2002; Wang et al., 2019; Yigit et al., 2019). Upon CC-GSEA, the top five pathways identified were all immune associated (Liberzon et al., 2015), demonstrating that this analysis can identify gene sets associated with known gene functions.
The gene sets within MSigDB contain a wealth of information; however, curated lists are not exhaustive, and experiments to derive gene sets are necessarily performed in specific experimental contexts. We hypothesized that identifying genes whose expression is coregulated with the average expression of a given gene set across tumor samples may suggest a functional or cellular coexpression relationship between the identified genes and the selected gene set.
Currently available tools calculate single-gene co-correlates of individual genes, but not single-gene co-correlates of biologically relevant gene sets (Li et al., 2020). We therefore developed GS-Corr, a tool that calculates the correlation between gene set expression and individual gene expression in TCGA (Fig. 3A).

The GS-Corr tool identifies genes coregulated with the expression of user-entered gene sets based on interpatient heterogeneity in cancer gene expression profiles.
First, the median relative expression of a selected gene set within the gene expression profiles of patient tumor samples of a selected cancer type is calculated. This is then used to calculate the correlation between the relative median expression of the selected gene set and expression of all other genes within TCGA, excluding those contained within the gene set. The tool outputs a set of Pearson or Spearman correlation coefficients for each gene.
The GS-Corr (Custom) tab allows users to explore the correlation between gene expression and expression of genes in a user-defined gene set. This tool can suggest additional genes with a similar function or regulatory mechanism to those in the user-defined gene list.
The Gene Set Membership tab identifies gene sets containing the gene of interest. This allows identification of possible gene functions through the gene sets they are included in, and also provides relevance to the results of GS-Corr, allowing users to identify gene sets containing genes that were correlated with the gene set of interest in GS-Corr analysis.
The HALLMARK_INFLAMMATORY_RESPONSE gene set contains a list of genes related to inflammation (Liberzon et al., 2015). We analyzed this gene set using GS-Corr to test whether GS-Corr could identify additional inflammation-related genes in lung adenocarcinoma.
The top ten genes with expression that positively correlated with the median relative expression of the HALLMARK_INFLAMMATORY_RESPONSE gene set have roles related to inflammation or the immune system (Fig. 3B; Al Barashdi et al., 2021; Alim et al., 2022; Castro et al., 2020; Chen et al., 2017; Dunlock, 2020; Glowacka et al., 2012; Hirahara and Nakayama, 2016; Lanzi et al., 2012; Parker, 2018; Wolf et al., 2020). This suggests that GS-Corr can identify additional genes associated with the biological functions of gene sets or coexpressed in cell types in whose expression profile the gene set is enriched.
Large data sets such as TCGA have tremendous use in cancer research. The tools developed here allow researchers to explore the involvement of biological processes in cancer progression and infer novel gene functions and regulatory mechanisms. Although the outputs of these tools are based upon correlation and would always require experimental validation, we believe they will be of significant value in hypothesis generation and validation of experimentally derived findings, particularly when investigating genes that lack comprehensive literature.
TCGA contains a wide range of clinical data, including patient age, tumor stage, and sex. There is potential in the future for development of tools and approaches to examine association of gene expression data at the level of biological processes based upon such characteristics, allowing a more nuanced interrogation of processes associated with phenotypic variations and disease outcomes between patients. GSEA of gene co-correlates may also be applied more broadly to other experimentally or patient-derived datasets.
GS-Surv and GS-Surv (Custom) investigate the predictive capabilities of gene sets on patient survival. TIMER2.0 and Xena are two very successful pre-existing tools that allow survival analysis of individual genes in TCGA data (Goldman et al., 2020; Li et al., 2020). SurvNet takes survival analysis further and combines protein–protein interaction databases with TCGA data to allow users to extract the genes most predictive of survival from protein interaction networks (Li et al., 2012). This is a powerful technique to extract important proteins from the complexity of cellular interactions, but does not account for the effects of whole pathways or transcriptional programs on survival.
Ke et al. (2022) performed a survival analysis of TCGA using 318 Kyoto Encyclopedia of Genes and Genomes (KEGG) pathways, identifying several prognostic pathways. This study highlights the utility of pathway-based survival analysis, but GS-Surv expands on these previous data by allowing users to select from over 15,000 gene sets. These gene sets are experimentally and manually curated and cover a wider field than solely cellular pathways, including transcription factor targets, targets of epigenetic regulation, and differentially expressed genes between cell types and treatment conditions (Godec et al., 2016; Liberzon et al., 2015, 2011). Using MSigDB gene sets rather than individual genes or a limited number of biological pathways allows far more expansive exploration of cellular processes and survival than pre-existing tools and data (Godec et al., 2016; Liberzon et al., 2015; Liberzon et al., 2011). In addition, GS-Surv (Custom) allows users to assess the clinical relevance of their own data in patient tumors.
The CC-GSEA and GS-Corr tools use pathways to predict gene function. CC-GSEA performs GSEA on co-correlated genes, and GS-Corr correlates gene expression with median gene set expression. Current tools exploring gene expression correlations, such as TIMER2.0 and OncoDB, focus on correlation of two individual genes (Li et al., 2020; Tang et al., 2022). The cancer regulome (https://explorer-cancerregulome.systemsbiology.net/) takes this one step further through using more of TCGA data, including gene expression, copy number, and methylation data, to perform a multivariate analysis and identify co-correlated genes in a highly statistically robust manner (Madhavan et al., 2013). Using gene sets in addition to individual gene expression allows CC-GSEA and GS-Corr to expand upon these pre-existing tools and, as such, they can provide novel hypotheses of gene function or regulation.
In addition, the ability to analyze custom user-defined gene sets allows users to explore their own experimentally or computationally derived data in the context of the Pan-Cancer Atlas. The Xena tool from The University of California, Santa Cruz (UCSC) provides excellent visualization of gene correlation, with the ability to visualize many clinical elements (Goldman et al., 2020). This tool also contains a GSEA function, whereby it generates a list of differentially expressed genes from clinical patient groups (e.g., comparing stage I and IV cancers in TCGA) and then uses this as an input for GSEA (Goldman et al., 2020). This tool is powerful, but performs a different function than CC-GSEA, as CC-GSEA performs GSEA on genes co-correlated with a gene of interest, suggesting novel gene functions, whereas Xena explores gene sets that correspond to clinical phenotypic differences (Goldman et al., 2020).
Overall, this article describes the development of three tools to enable process-based analysis of TCGA, focusing on predicting patient survival and exploring novel gene functions or regulatory mechanisms. These tools use patient-derived data, ensuring the relevance of results in the clinic, and can provide novel hypotheses of gene functions or regulation to inform research. GS-TCGA is available online at http://gs-tcga.roychoudhurilab.org/
Footnotes
ACKNOWLEDGMENTS
The authors thank members of the Roychoudhuri Lab, including Alex C. Evans, Alexander Weslowski, Alberto G. Conti, Sarah K. Whiteside, Jie Yang, Charlotte Imianowski, and Natanya Cartwright, for insights and discussion. The authors also thank members of Enrico Lugli's laboratory for their comments, including Emilia Razza, Marco De Luca, and Simone Puccio.
The results here are based upon data generated by TCGA Research Network: https://www.cancer.gov/tcga. This work was performed using resources provided by the Cambridge Service for Data-Driven Discovery (CSD3), operated by the University of Cambridge Research Computing Service ( ), and provided by Dell EMC and Intel.
AUTHORs' CONTRIBUTIONS
T.B. was involved in conceptualization, software, data curation, writing—original draft, review and editing, and visualization. R.R. was involved in conceptualization, data curation, writing—review and editing, supervision, and funding acquisition.
AUTHOR DISCLOSURE STATEMENT
The authors declare they have no conflicting financial interests.
FUNDING INFORMATION
The research was supported by the UK Medical Research Council (Grant No. MR/W018454/1), the UK Biotechnology and Biological Sciences Research Council (Grant No. BB/X006344/1), and an ERC Consolidator Grant awarded to R.R., funded by the UKRI Horizon Europe Underwrite scheme (Grant No. EP/X024709/1). T.B. is funded by the BBSRC Cambridge Doctoral Training Partnership.
References
Supplementary Material
Please find the following supplemental material available below.
For Open Access articles published under a Creative Commons License, all supplemental material carries the same license as the article it is associated with.
For non-Open Access articles published, all supplemental material carries a non-exclusive license, and permission requests for re-use of supplemental material or any part of supplemental material shall be sent directly to the copyright owner as specified in the copyright notice associated with the article.
