
Abstract
Gene duplication has a central role in evolution; still, little is known on the fates of the duplicated copies, their relative frequency, and on how environmental conditions affect them. Moreover, the lack of rigorous definitions concerning the fate of duplicated genes hinders the development of a global vision of this process. In this paper, we present a new framework aiming at characterizing and formally differentiating the fate of duplicated genes. Our framework has been tested via simulations, where the evolution of populations has been simulated using aevol, an in silico experimental evolution platform. Our results show several patterns that confirm some of the conclusions from previous studies, while also exhibiting new tendencies; this may open up new avenues to better understand the role of duplications as a driver of evolution.
INTRODUCTION
Gene duplication is largely responsible for boosting the innovation and function variation of genomes (Carvalho et al., 2010; Kuzmin et al., 2021; Vosseberg et al., 2021), and plays a central role in the evolution of gene families (Demuth and Hahn, 2009). Copies of genes arising from duplication can undergo multiple evolutionary fates (Ohno, 2013). For instance, the copies may perform the same role, share functions, or one of them could accumulate mutations, whereas the other maintains the original function (Ohno, 1999). The more commonly studied fates will be described in detail in the next section: pseudogenization (loss of one gene), (double) neofunctionalization (divergence in function for both/one gene), conservation (maintenance of the original functions for both genes), subfunctionalization (division of the original functions between the two copies), and specialization (division of the original functions along with the acquisition of novel ones).
Little is known about whether certain fates occur more frequently than others and how environmental conditions influence their relative occurrence. Determining the fate of paralogous genes is challenging owing to two primary factors. First, the functions of their common ancestor are often unknown, impeding the ability to foresee the evolutionary development of each copy. Additionally, even with knowledge of the ancestral functions, their evolution may not fit perfectly into one of the established classes. Several works have focused on understanding the role of duplications [see e.g., (Ascencio et al., 2021)], but to our knowledge, no rigorous framework has been developed to classify these roles. In this context, our goal is to establish a comprehensive framework for formally describing the possible fates of duplicated genes, allowing for their differentiation through the analysis of phylogenetic data. Our method involves assessing the biological functions of both the original gene and its duplicates, creating a spectrum that captures the various possible fates along a continuum.
The majority of studies addressing this subject primarily focuses on theoretical aspects and put forth statistical fate models for predictive purposes. One illustrative instance is the work by Lynch et al. (Lynch and Force, 2000; Lynch et al., 2001), which conceptualizes genes as discrete sets of functions. The authors introduce a population-based model of subfunctionalization, taking into account mutation rates in regulatory regions. Notably, their findings indicate that the likelihood of subfunctionalization diminishes toward 0 with larger population sizes. Using similar ideas, Walsh (Walsh, 2003) compares pseudogenization against other fates, showing that predictions depend on mutation rates. In Stark et al. (2017), the authors also compare subfunctionalization and pseudogenization using a mechanistic model based on Markov chains, which allows for data fitting and improved characterizations of hazard rates of pseudogenization. Markov chains were also used in Diao et al. (2020) to predict the evolution of gene families undergoing duplications, loss, and partial gain/loss of function. Also, the theoretical impacts of neofunctionalization on orthology prediction were discussed in Lafond et al. (2018). Classification tools based on gene-species reconciliation have also been proposed, for example, for xenologs (Darby et al., 2017), which are pairs of genes whose divergence includes a horizontal gene transfer.
In more practical settings, perhaps the closest work to ours is that of Assis and Bachtrog (Assis and Bachtrog, 2013). Based on the ideas of Otto and Yong (2002), they used Euclidean distances between gene expression profiles to distinguish between neofunctionalization, subfunctionalization, conservation, and specialization. Utilizing data from Drosophila, they demonstrate that neofunctionalization prevails as the primary fate, followed by conservation and specialization, with a limited occurrence of subfunctionalization. In He and Zhang (2005), the authors use
This article fills this gap by employing aevol to simulate the progression of individual populations. Subsequently, we utilize our framework to categorize the duplications present in the simulated data. Our tests on aevol confirm the experimental studies on Drosophila data (Assis and Bachtrog, 2013), which showed that conservation/neofunctionalization were much more likely than subfunctionalization/specialization, while at the same time exhibiting proportions that differ from ours within these two groups of fates.
POSTDUPLICATION FATES
Several classes and subclasses of postduplication fates have been proposed in the literature; here, we recall the main ones that we model in our framework. These fates have been chosen because they are generally agreed upon, as discussed in various surveys [see e.g., (Hahn, 2009; Zhang, 2003)]; each class is assigned an acronym that we shall use in the following of the article.
METHODS
We first describe our theoretical model of fate classification, and then proceed to describe our experiments.
We assume the existence of a set of possible biological functions that we denote by

An illustration of genes expressing functions in a Gaussian pattern.
We define the following comparative tools for two genes g and h:
for gene g, we define
For technical reasons, when contrib(g) = 0, we define
We may write g + h and
Suppose that a and b are two extant paralogs and that their least common ancestor is g. For each fate described in Section 2, that is, for each fate
The formulas for computing the proportion of each fate are detailed in Table 1.
The Formulas Used to Compute the Proportion of Each Fate
The Formulas Used to Compute the Proportion of Each Fate
Each fate is illustrated in Figure 2, using the example of Gaussian gene functions. Note that P and N are the only fates to use a maximum of two values. This is because there are two ways in which P can occur (either gene loses functions), and in which N can occur (either gene diverges). In the other fates (
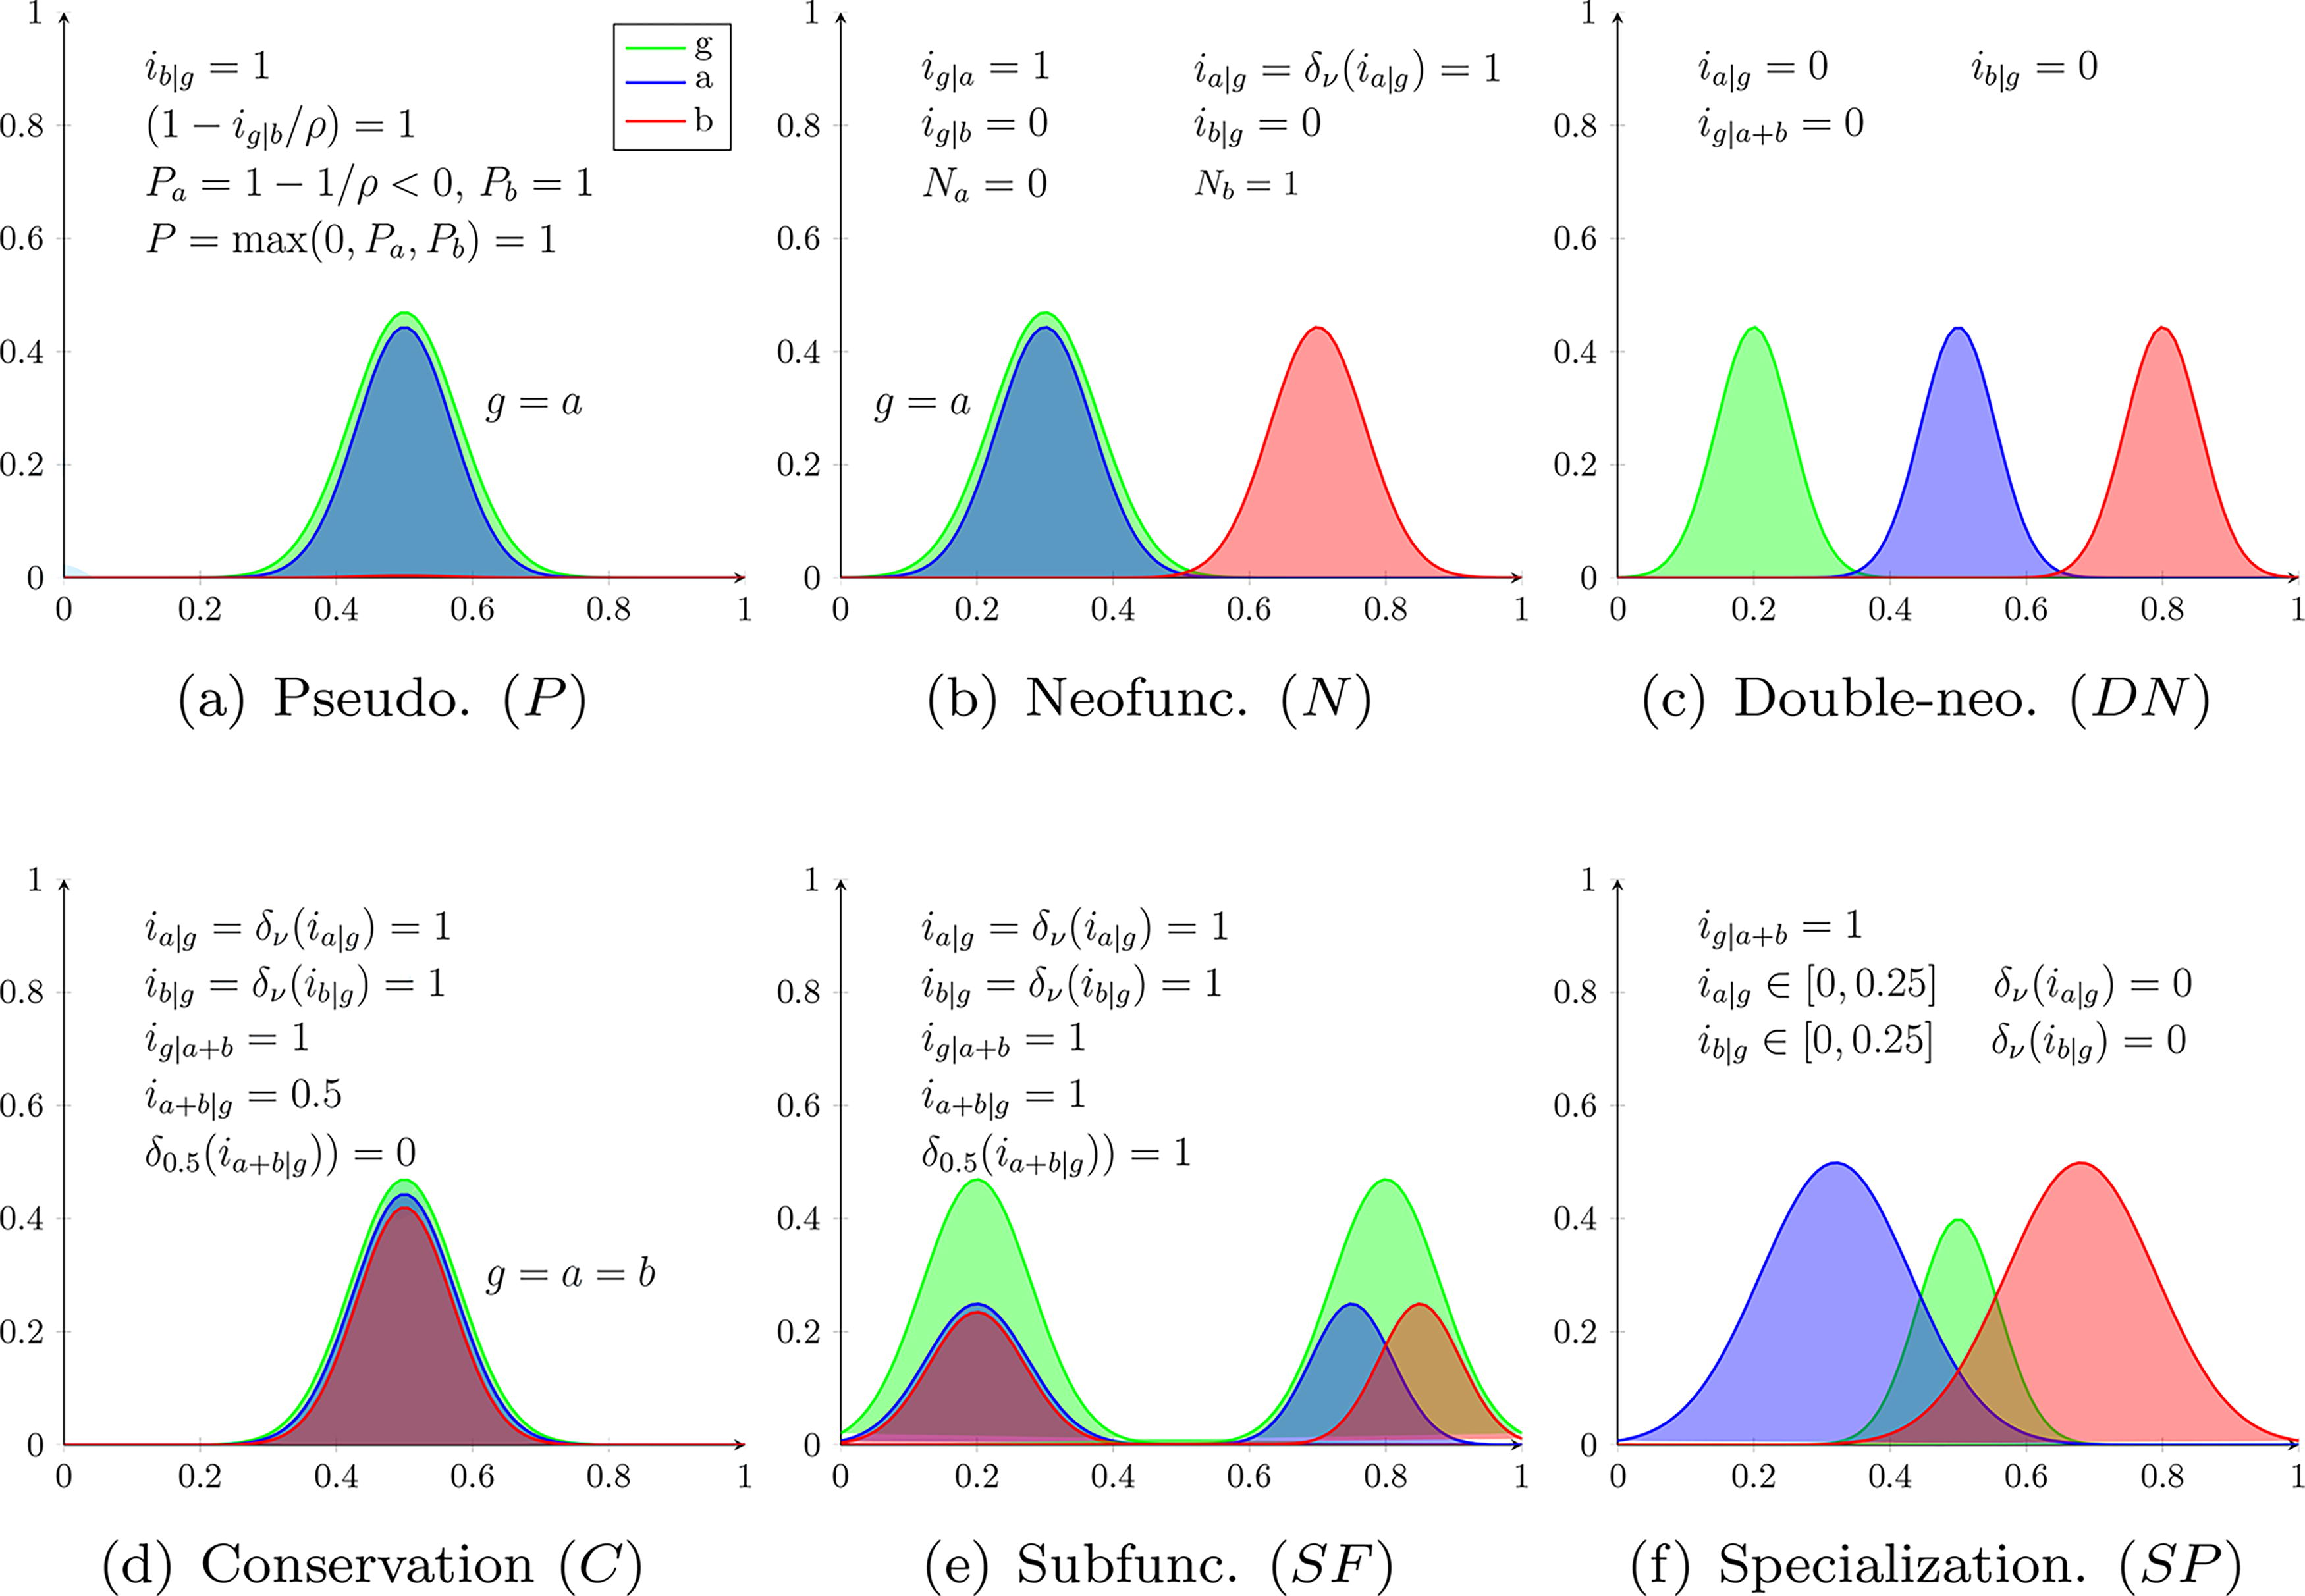
The canonical fates using the Gaussian representation. Note that in the case of SF and SP,
Recognizability: When the gene copies have the exact behavior that is expected from a given fate, then our formulas assign 1 to that fate. This requires that each multiplicative factor present in a fate formula is 1.
Distinguishability: When one of the fates is clearly present and assigned 1, all the other fates are assigned 0. This requires the other fates to have at least one multiplicative factor equal to 0.
For each fate, we recall the expected behavior and argue that both criteria are met by the formulas in Table 1. We also explain the rationale behind our usage of threshold functions.
Recognizability. When b does not perform novel functions outside of g, the
The same applies to a and Pa, and P is the maximum of 0, Pa and Pb, indicating the the P fate is predicted when at least one gene pseudogenizes.
Distinguishability. Notice that every other fate includes the factor
Although not strictly required for our criteria, note that the factor
Recognizability. As b only has novelty, none of its functions are covered by g and the factor
Distinguishability. As already argued, P = 0. The fate DN is excluded since it has the factor
We mention in passing that the factor
Recognizability. When neither a nor b intersects with g, each of the factors
Distinguishability. The fate P is excluded since P = 0 as we just saw. The fate N is excluded since
Recognizability. The factors
Distinguishability. Since
Recognizability. When SF occurs, a, b are covered by g and g is covered by
Distinguishability. The fate SF is separated from N, DN, SP for the same reasons as C, and is separated from C because of
Recognizability. The factor
Distinguishability. We just argued that P = 0 and it is thus excluded. We have DN = 0 because
If one considers our formulas as a probability distributions on fates, the sum of values of each fate should sum to 1 (i.e.,
As previously mentioned, our framework allows the quantification of hybrid fates. Figure 3 illustrates two examples of such fates, which are similar to fates encountered in our experiments described later on. In these examples, we model genes as triangles, which makes the proportions easier to see and is the same representation used in our experiments.
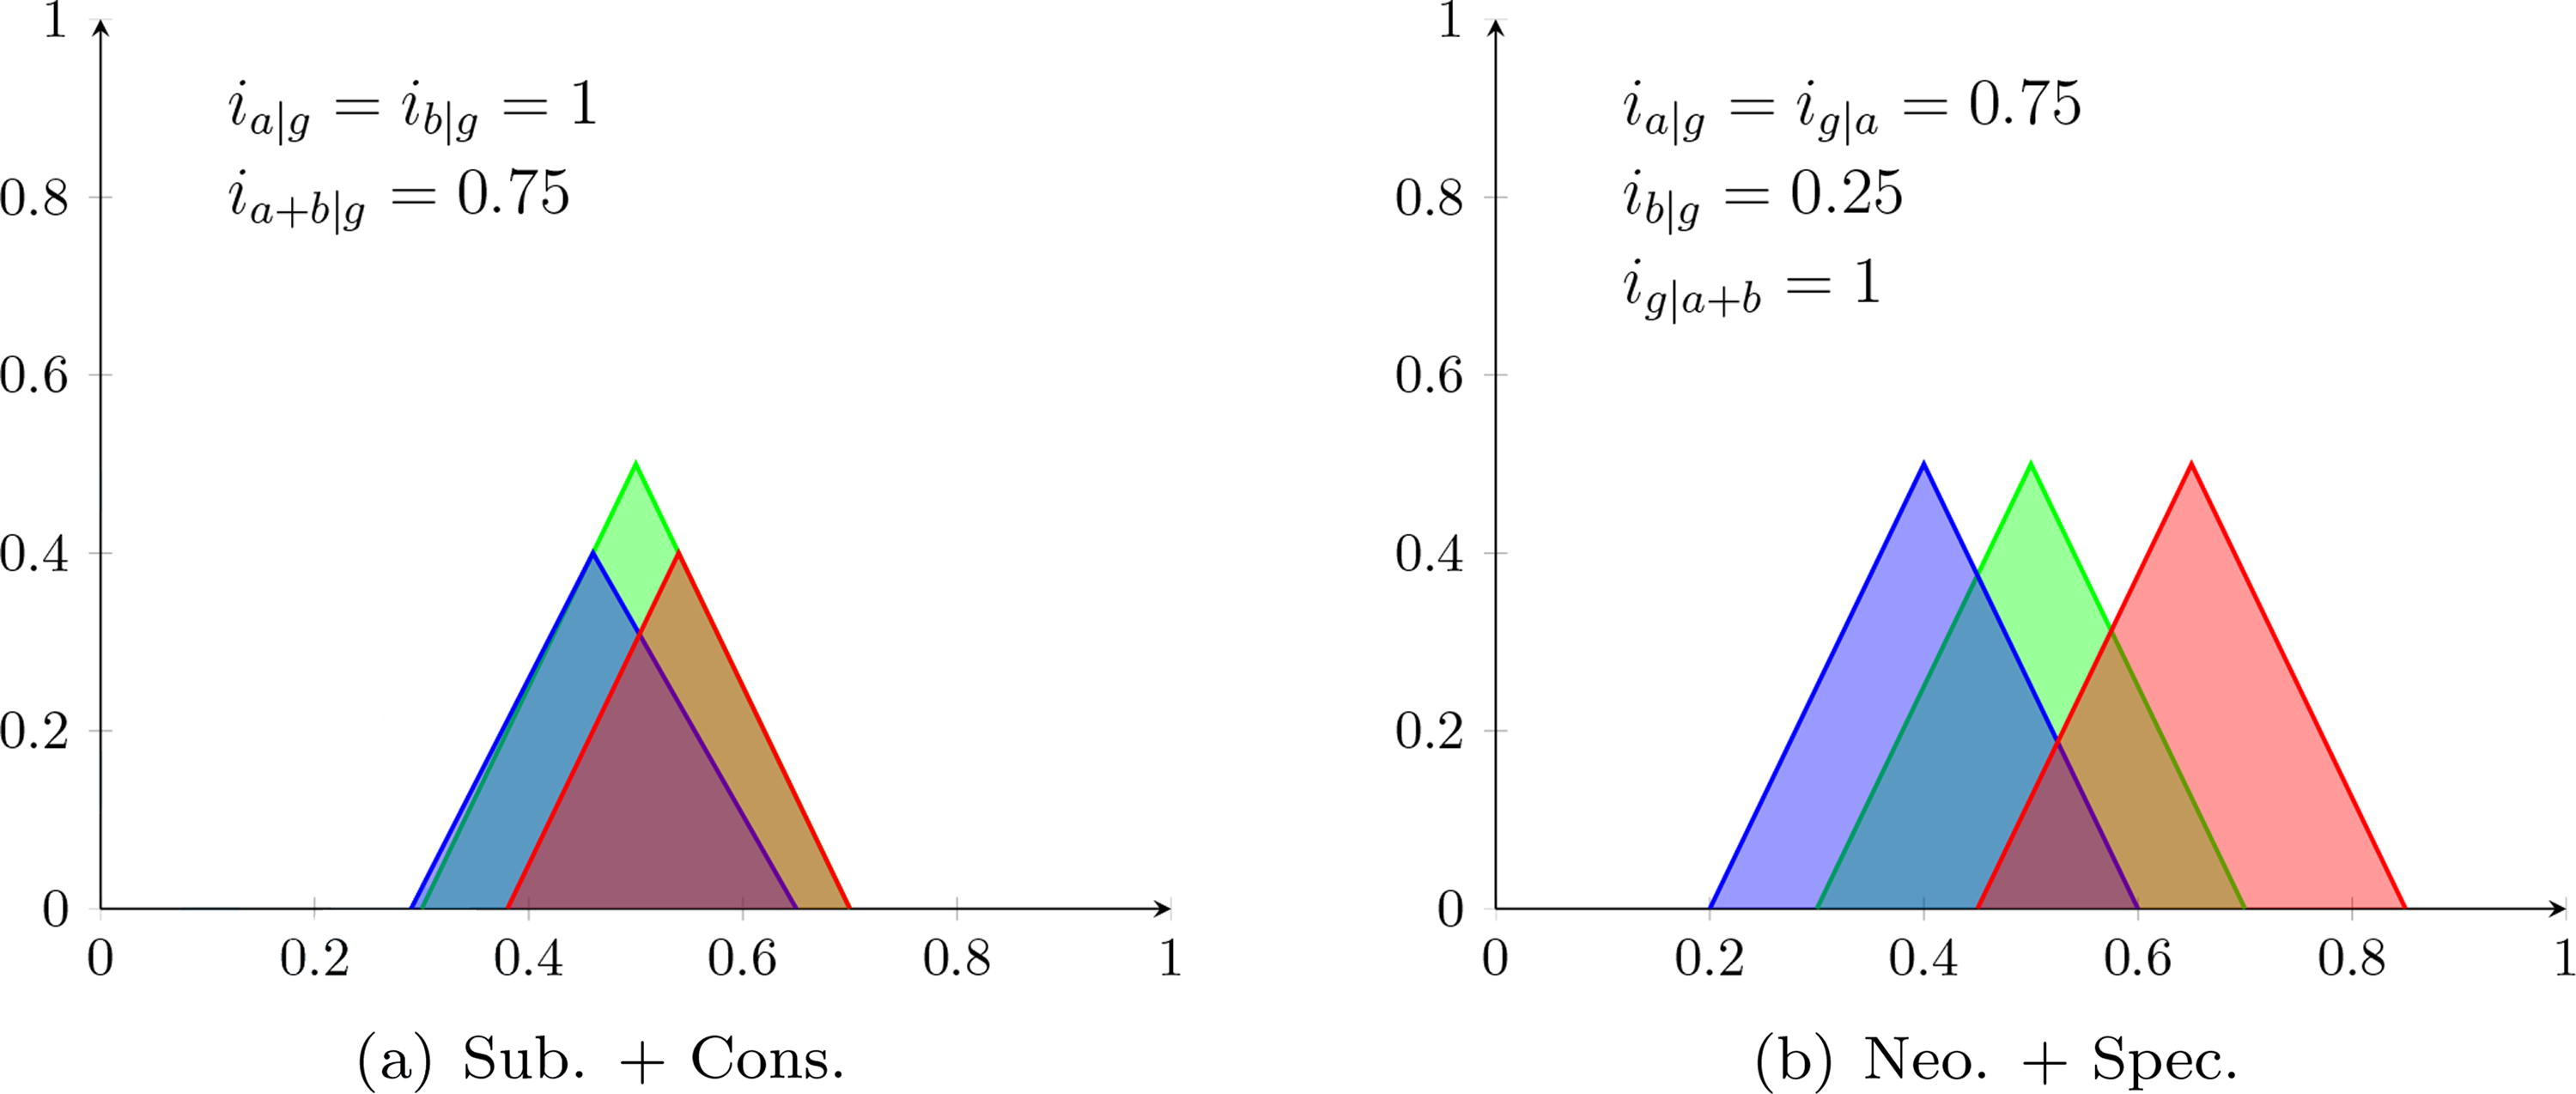
Two examples of hybrid fates. In panel
Figure 3a illustrates a mix of SF and C. In the figure, a and b have both preserved a significant portion of g and have not developed new functions, which is the behavior of conservation, but not entirely since they also lost a portion of g. The copies also realize g together as in subfunctionalization, but this is not exactly SF since a + b is much larger than g. Using threshold
Figure 3b displays a mix of N and SP whose sum-of-fates is <1. This fate is close to N since gene a maintained most of the functions of g, whereas b mostly developed new functions. However, it is not purely N because a has some new functions and b preserved some. In fact, it is also a mix of SP since the functions of g are covered by
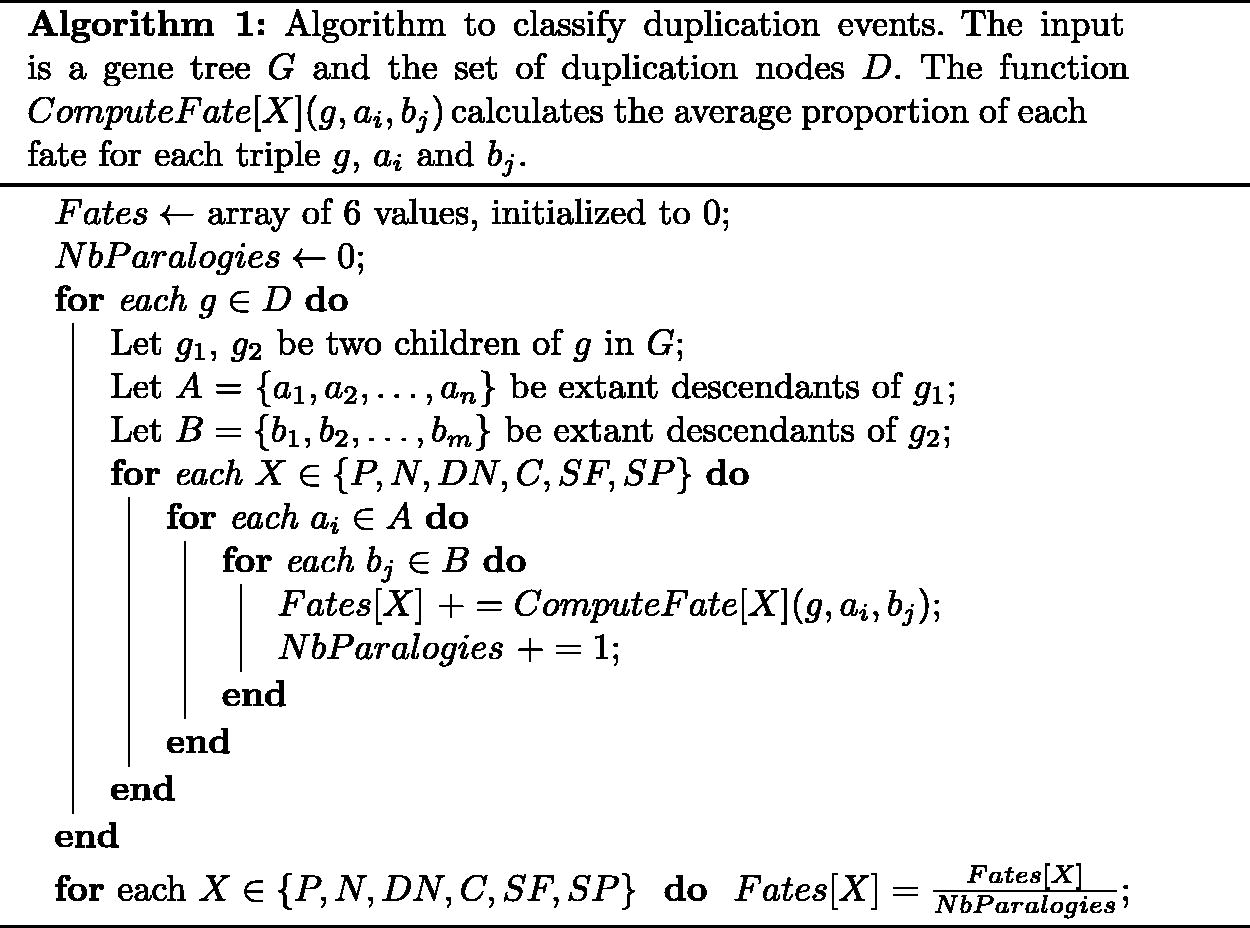
The previous section describes how to compute the fate of a gene g and two of its paralogous descendants a and b. However, in the case of successive duplications, g may have multiple pairs of such paralogous descendants. In Algorithm 1, we describe how to compute the fate proportions between all paralogs in a gene tree G, in which leaves are extant genes and internal nodes are ancestral genes. For the purposes of our algorithm, we assume that the functions of both extant and ancestral genes are known. We also assume knowledge of a set of duplication nodes D, which can be inferred through reconciliation (Chauve and El-Mabrouk, 2009; Jacox et al., 2016). Then, for each gene
Simulations
As already mentioned, to test our method, we used simulated data generated using the aevol platform. Aevol is an in silico experimental evolution platform that simulates the evolution of a population or digital organisms.1 In aevol, each organism owns a genome (a binary double-stranded circular sequence inspired from bacterial chromosome, see Fig. 5, upper part) and a multisteps genotype-to-phenotype map simulates transcription and translation to identify genes on the sequence, compute the phenotype that results from the interaction of the proteins encoded by these genes and ultimately compute the fitness of the organism (Fig. 4). Importantly, this genotype-to-phenotype map is divided in two parts. (1) The localization of the genes is based on the identification of signal subsequences on the genome that initiate translation (step 1 on Fig. 4) and identify the mRNAs sequences. Then, on each mRNA the model searches for transcription initiation subsequences to identify the genes (step 2 on Fig. 4). Hence, at the sequence level aevol mimics the structure of bacterial chromosomes, allowing for gene duplication. (2) At the functional levels (proteins and phenotype), aevol switches to an abstract mathematical world in which biological traits are represented by a couple of values
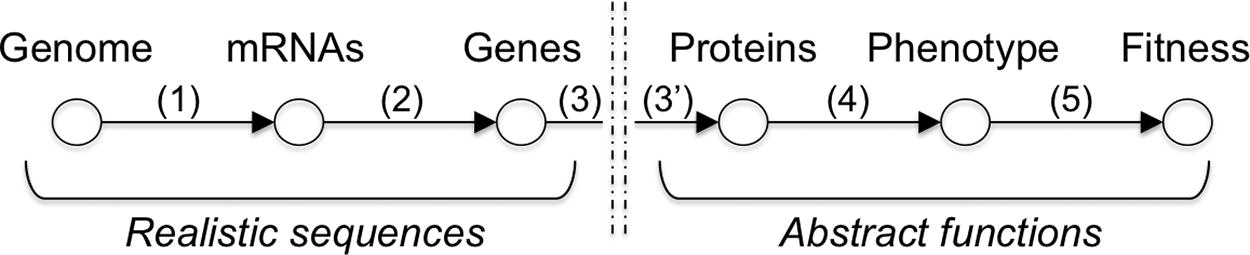
Overview of the genotype-to-phenotype map in aevol. Genomes are decoded into a phenotype through a multistep process that first decodes the genome sequence to identify the genes (steps 1 and 2), then decodes the gene sequence to compute the protein functions (step 3 and 3′), the phenotype (step 4), and ultimately, the fitness of the organism (step 5). See main text for details.

Overview of an aevol wild-type. Top: Sequence level (genome, RNAs, and genes). The double-stranded genome is represented by a circle (thin line). Black arcs represent mRNAs
As aevol has already been extensively described elsewhere (Banse et al., 2023; Batut et al., 2013; Knibbe, 2006; Knibbe et al., 2007b; Liard et al., 2020; Rutten et al., 2019), we will not describe it in more details here. Now, given our objective, there are a number of advantages of using aevol. First, the platform enables both variation of gene content and genes sequences, a mandatory property to study the fate of duplicated genes. Second, in the model two, gene copies have exactly the same set of
We now discuss our simulation framework. As briefly described above, in aevol, the environment is represented by a
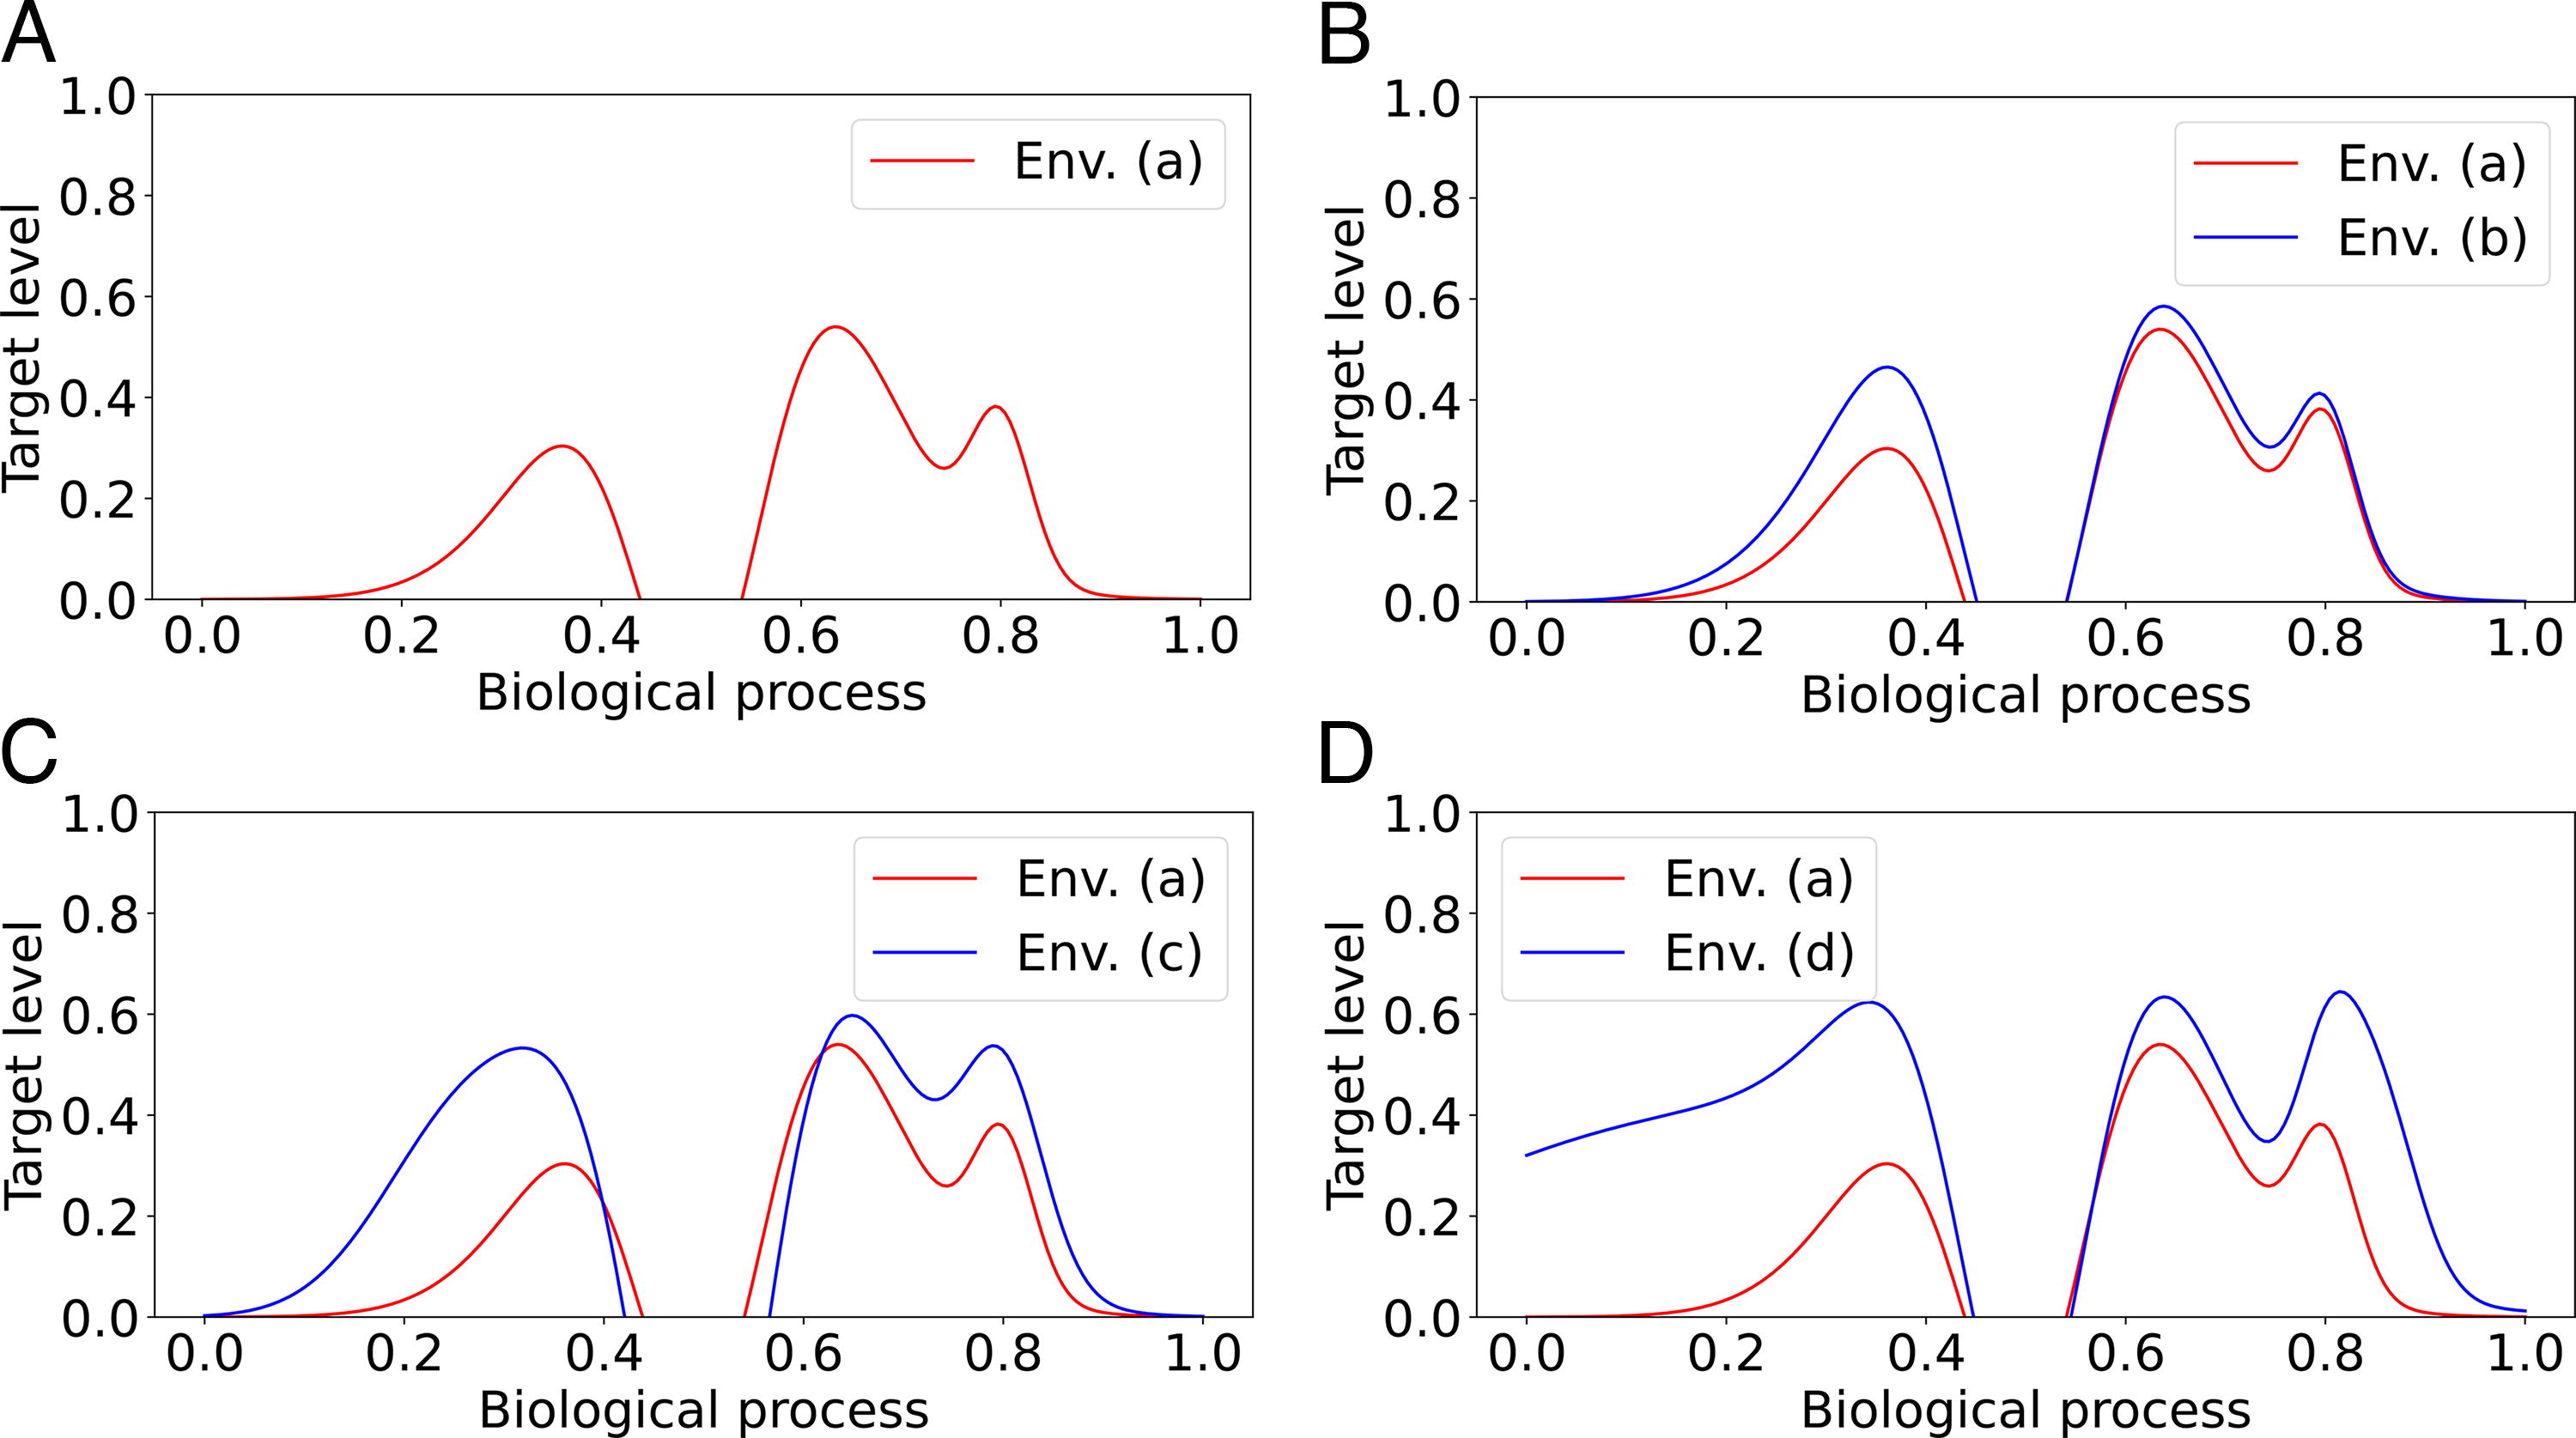
The four different environments used in the simulations. On the x-axis, we assume that the set of functions (biological processes) is the interval
We used each generated wild-type as an initial genome for further 1 million generations of evolution in our four different environments. Note that, since wild-types are already adapted to environment (a), we expect very few duplications to occur in this environment. The other three environments range from mild, medium, and heavy change with respect to the original environment; the intent of these simulations is to evaluate how individuals respond to different degrees of changes in their environment. Therefore, we expect the genomes that evolve under (d) to undergo more duplications. For each wild-type and each environment, we then performed 20 independent simulations.
Finally, we collected the most fit individuals at the end of each simulation (i.e., the individual which phenotype is the closest to the target function, hence which fitness is the highest). The extant paralogs that we analyzed were those found in their genome at the end of the process. As explained above, this procedure does not consider genes lost after duplication (either through sequence deletion or inactivation of transcription/translation initiation sequences). Thus, the pseudogenization fate here only considers extant genes whose activity has been strongly reduced. The source code is available at https://github.com/r3zakalhor/Post-Duplication-Fate-Framework.
Fates of duplication
As explained above, starting from wild-types evolved in environment (a) with different maximum pleiotropic levels wmax, we simulated the evolution of 20 populations in 4 environments (ordered by increased variation compared with the environment of the wild-type) and for 1 million generations. We first verified that our phylogenies contain enough fixed duplications to enable studying the fate of duplicated genes with a reasonable precision. Table 2 shows the number of duplications per million generations observed for each environment. Recall that observed duplications are only those that result in at least one pair of extant paralogs, that is, we do not consider duplications in intergenic regions, or in which a copy is lost.
Rate of Observable Gene Duplications for Each Environment (Number of Gene Duplications Fixed per Million Generations, Averaged over Every Possible Wmax)
Rate of Observable Gene Duplications for Each Environment (Number of Gene Duplications Fixed per Million Generations, Averaged over Every Possible Wmax)
Not surprisingly, the rate of fixed duplications is minimum when the organisms evolve in the constant environment (a) and it increases with the amount of change in the environments. Since each dataset comprises a million generations, the number of duplications is large enough to observe a large variety of fates. Interestingly, the number of gene duplications depends not only on the amount of environmental variation but also on the degree of pleiotropy. Indeed, Table 3 clearly shows that the lower the pleiotropy (i.e., the smaller
Rate of Observable Gene Duplications for Each Pleiotropy Level (Number of Gene Duplications Fixed per Million Generations, Averaged over Every Environment)
Table 4 show the proportions of the different fates estimated on the aevol simulations (for each wild-type, we simulated 4 environments × 20 parallel repetitions evolved for 1 million generations4). The majority of the fates are classified by our classification rules. The column “Total” reports the sum of proportions for each row. The gap between these values and 1 can be interpreted as the amount of fates that remained “unclassified.” It would be easy to turn our predictions into a probability distribution by normalizing them, but we prefer to emphasize the fact that paralogs underwent fates that, on average, had between 10% and 25% of their behavior that did not fit any of the canonical fates. Notice that environment (a) has the lowest classification rate. This might be explained by the fact that in this setting, duplications are less likely to contribute to fitness and may therefore undergo fates that are not as well-understood, in which case they do not correspond directly to the ones expected from the literature.
Several notable results can be observed from this table. When the organisms do not need to adapt in environment (a), P tends to be the dominant fate, even if we only detect observable pseudogenes. This is not surprising, again because duplicated genes are unlikely to contribute to fitness. The fact that the N fate dominates for wmax = 0.01 is likely because genes have limited individual effect, hence allowing their maintenance and their neofunctionalization, as discussed below. When the organisms must adapt to a new environment (b, c, and d), the most frequent fate of duplications is C, followed by N. The high level of conservation may be attributed to the changes in the target levels in the fitness curves, as the new environments require dosage adaptation for genes function (see Fig. 5 for an example of such effect). Indeed, one can see from Figure 6 that significant portions of the functional landscape require increased expression levels. This suggests that the genes performing these functions were duplicated and conserved for amplification, whereas other genes used neofunctionalization and performed the remaining extra functions required. Overall, the fates C, N, P are more frequent than SF, SP, and DN. This partially agrees with the findings of Assis and Bachtrog (2013), who found that
Moreover, we observe that the rate of N decreases as pleiotroty increases, which is not surprising. As wmax increases, the range of functions performed by an individual gene increases, hence the probability that one duplicate loses the ancestral function and acquires a new one decreases. A most striking result is the very low percentage of SF. However, this result is coherent with the theoretical predictions of Lynch and Force (2000) and the experimental results of Assis and Bachtrog (2013), and probably results from the fact that SF provides no fitness advantage (since the extant function is the same as the ancestral one) but requires a transitory loss of fitness (when both copies have not yet diverged). Notably, the proportion of SF tends to increase with wmax. This may be explained by the fact that a higher pleiotropy level allows for alternative adaptive pathways (by adapting either genes with a high/low pleiotropy), which can compensate each other. A similar reasoning applies to SP, which has low frequency in general, but has the inverse relationship with wmax. Perhaps this is because SF tends to take over the “sharing of functions” fates as pleiotropy increases, for the reasons mentioned above. Finally, DN is by far the rarest event, occurring in highest proportions when wmax = 0.01, which is expected as small pleiotropy makes it easier to diverge.
We also evaluated the relationship between the fate of a duplication and the time at which it occurs (in terms of number of generations). We formed bins of 100,000 generations each and, for each duplication event across all simulated wild-types and environmental conditions, we put the duplication in the bin containing the generation it occurred in (recall that generation 0 is the most ancient and 1M the most recent). Then for each bin, we computed the average proportion of each fate within the bin (sum of fate proportion divided by number of duplications in the bin). Table 5 presents the number of duplications in each bin, and Figure 7 illustrates the relationship between time and fate.

Average proportion of each duplication fate per generation bin.
Average Fate Proportions. Most Frequent Fates Are Boldfaced
Number of Duplications per Generation Bin, for Bins of Size 100K, for Each Environment. For Instance, Column 400K Contains the Number of Duplications During Generations 300K–400K
It is immediately apparent from Table 5 that almost all duplications occur within the first 100K generations when the environment changes [env. (b), (c), (d)]. Although this may not appear as a surprise, recall that in aevol, duplications are only one of the many evolutionary mechanisms that affect genome evolution (other events include substitutions, Indels, transpositions, inversions, and segmental deletions). The fact that duplications are so prevalent early on therefore shows how important it is during phases of adaptation. A detailed comparison of the adaptation power of duplications against other evolutionary mechanisms is out of the scope of the current paper, but it will be interesting to perform these analyses in the future (Banse et al., 2023). In any case, there appears to be no trend in the number of duplications after 100K or 200K generations. One may arguably view the early duplications as necessary for selection, and the later ones as duplications becoming fixed by chance.
As for Figure 7, the fates C, N, and P remain largely dominant through most generations, which is to be expected from the results of the previous section. Notably, P is rare in the early generations since duplicates tend to be preserved for adaptation, but quickly sees a sharp increase as duplications start to introduce redundancy. Interestingly, the last 200K generations introduce significant variations in the fate proportions. First, there is a sharp increase in the amount of Conservation toward the end, going from 0.2 in the 800K bin to 0.55 in the 1000K bin, which is in line with the intuition that time is needed for divergence (and hence there may not be enough time for the duplicated genes to become P or N). Since all the predicted fates in our experiments sum to at most 1, the other fates see a decrease in these last 200K generations, which also explains why C appears to be inversely correlated with P and N.
We also checked whether rounds of successive duplications could affect fates. When a gene duplicates and one or both copy also duplicate later on, it is possible that a bias toward certain fates is introduced. Therefore, for each duplication g, we looked at the number of descendants of g in its gene tree (see Algorithm 1), where here the number of descendants is the number of leaves under the duplication node. For instance, g having two descendants means that no copy duplicated further, having three descendants means that one copy also duplicated, and so on. The second column of Table 6 reports the number of duplication events encountered for each number of descendants. The vast majority of duplications have only two descendants and, across all the simulations, the maximum number of descendants of a duplication is 16. The other columns report the average proportion of fates, for the pair of paralogs whose common ancestor has the number of descendant for the row.
Average Proportion of Fates per Number of Descendants. The Second Column Reports the Number of Duplication Events for Each Number of Descendants, and the Last Column, the Sum of Fate Proporitions for Each Row
Average Proportion of Fates per Number of Descendants. The Second Column Reports the Number of Duplication Events for Each Number of Descendants, and the Last Column, the Sum of Fate Proporitions for Each Row
Generally speaking, the numbers shown in Table 6 are distributed in a similar manner across the rows, and are also similar to the fate proportions reported in the previous section. It is worth noting that C decreases as the number of descendants increases. This is likely because when an ancestral gene produces several pairs of paralogs, only a few of them may preserve the original function, as otherwise this would create overly high dosage effects. Therefore, even though a few pairs of paralogs may preserve the function, the number of paralogous pairs that do not tend to bring the proportion of C down. Also, DN seems to increase with the number of descendants (until 10, afterward we do not have enough statistical power), probably because the successive duplications produce copies that are free to develop new functions. In the future, it might be beneficial to classify the fate of a duplication more “locally,” that is, by looking at its descending genes until a certain point, as going too far down the gene tree may introduce interference in our analysis.
In this article, we introduced a formal methodology for categorizing the fates of gene duplications based on the functions of existing paralogs and the ancestral gene. The aim is to offer the scientific community precise definitions and a mathematical toolkit for distinguishing between various fates. Indeed, without a comprehensive toolkit, the comparison of experimental and/or theoretical studies becomes extremely challenging, thereby restricting the potential for understanding gene duplication—a mechanism widely regarded as pivotal in molecular evolution. Our framework underwent thorough testing using simulated data from aevol, an independently developed platform. Our tests confirmed several, but not all, tendencies reported in the literature (Assis and Bachtrog, 2013; Guillaume and Otto, 2012), showing the relevance of our classification. Further work will permit to study a broader set of parameters, both for the simulations and for the classification thresholds, to confirm these trends. Incidentally, our results also confirm the interest of using aevol as benchmark to test bioinformatics tools.
Our research opens several fields of research, spanning comparative genomics, phylogenetics, simulation, and, notably, evolutionary biology. Although a substantial proportion of gene duplicates is classified (>0.70 in all scenarios), indicating progress, it underscores the necessity for additional investigation into the unclassified fates. Furthermore, although not detailed in this report, we have identified a minor fraction of “hybrid fates” that warrant dedicated scrutiny. Lastly, it is important to acknowledge that our methodology, centered on extant paralog analysis, falls short of encompassing the complete spectrum of pseudogenization fates. Indeed, in our results P is always lower than 20% (except in constant environment—see Table 4), which is much lower than the 80% observed in the Zebrafish (Otto and Yong, 2002). We conjecture that the variation stems from the specific approach in choosing gene duplicates in this study. An exciting avenue for research involves expanding the P class to encompass the entire spectrum of pseudogenization fates. Finally, we could use real data available in published datasets such as Gaudet et al. (2011) to further test our approach. Although aevol simulations enabled testing the continuous version of our framework, other datasets could enable testing the discrete version, for example, by classifying paralogs annotated with Gene Ontology (Zhao et al., 2020).
In this study, we employed aevol to evaluate our framework, demonstrating its ability to produce data resembling real-world observations. This encourages us to delve deeper into the exploration of gene duplications within the simulator. Notably, aevol not only provides the end results of organisms but also supplies information about past individuals and the precise gene phylogeny. This enables us to discern the precise trajectory of each gene along every branch, encompassing instances of gene loss. We used this information to refine our study and tested how the fate of duplicated genes evolves in time after the founding duplication event, a question that is almost impossible to study in vivo. We showed that although, on the long term, conservation, neofunctionalization, and pseudogenization are the most probable fates, immediately after the duplication events, the dominant fate is conservation. Let us also note that it is likely that this dominance depends on the type of environmental variation as, in our experiments, the variation favors gene amplification. Further studies could reveal which fates are more likely to open the path to others, an information that could be used to predict the evolution of specific gene branches following recent duplications. The model also enables “in silico genetic engineering.” We intend to create a set of mutants by manually duplicating genes and allowing them to evolve. This approach will pave the way for a systematic examination of gene duplication within the model. We could also observe the fate of duplicates in more specific settings, such as after a whole-genome duplication (WGD), and check whether it depends on the characteristics of the ancestral gene (e.g., on essentiality, pleiotropy, or transcription level…). In aevol, WGD can easily be simulated by evolving wild-types with low-y target functions and then propagating these wild-types in a new environment where the target function is multiplied by two. Using this procedure, we can observe the fate of the duplicated genes immediately after the WGD but also after thousands or even millions of generations. We plan to test this exciting prospect in a near future. Another interesting avenue of research would be delving into the influence of regulation on the frequency of fates, particularly in relation to subfunctionalization. Although the current iteration of aevol does not incorporate regulation, there is an ongoing development of an extension to encompass the evolution of transcription factors. This extension aims to provide insights into how regulation might affect these aspects.
Finally, it would also be interesting to study how specific biological duplication mechanisms, for instance unequal crossing over, tandem duplication, or retrotransposition (Reams et al., 2012), are associated with fates. Such investigations would probably require to analyze not only gene functions but also gene genealogies.
Applying our framework to real data would require as input a set of genes and the knowledge of their functions and gene expressions. With the sequences at hand, we would need to align them and reconstruct a phylogeny from the gene family alignment, and infer duplication events via reconciliation tools (Jacox et al., 2016, for example). Then, using as input the gene phylogeny and the functions of the extant genes, the functions of ancestral genes could be predicted using tools such as PAINT (Gaudet et al., 2011) or PANTHER (Mi et al., 2017). Finally, ancestral gene expressions could be reconstructed by inferring ancestral transcriptomes, similarly to what was done in Mika et al. (2022). This would enable us to analyze real data, which we leave for future work.
Footnotes
ACKNOWLEDGMENTS
The authors thank the anonymous reviewers for their helpful comments on the article. We thank the ISEM platform and the Alliance Canada platform for the computing facilities.
AUTHORS’ CONTRIBUTIONS
All the authors contributed to every step of the research: devising the classification approach, implementing the approach, performing the simulations, analyzing the data, and writing the article.
AUTHOR DISCLOSURE STATEMENT
The authors declare that they have no competing interest.
FUNDING INFORMATION
This work was supported by French Agence Nationale de la Recherche through the CoCoAlSeq project (ANR-19-CE45-0012) and by the Natural Sciences and Engineering Research Council of Canada-Alliance Catalyst (ALLRP 578495-22).