
Abstract
The purpose of integrating different omics data is to study cellular heterogeneity at the level of transcriptional regulation from different gene levels, which can effectively identify cell types and reveal the pathogenesis of Alzheimer’s disease (AD) from two perspectives. However, implementing such algorithms faces challenges such as high data noise levels, increased dimensionality, and computational complexity. In this study, multigraph regularization constraints were introduced in the network-based integrative clustering algorithm (MGR-NIC) to remove redundant features and keep the geometry structures underlying the data by fusing two types of data (snRNA-seq and snATAC-seq) of glial cells from AD samples. The effectiveness of the MGR-NIC algorithm was validated using both simulation datasets and real datasets derived from various tissues. The MGR-NIC algorithm can improve clustering accuracy by selecting features that better represent the dataset’s structure. The clustering results obtained with the MGR-NIC algorithm show strong consistency with the clustering results inherent to the published DLPFC dataset, while the classification results generated using the NIC algorithm often lead to cluster overlap when applied to the DLPFC dataset. We will use the same state-of-the-art algorithms for a comprehensive evaluation with our proposed MGR-NIC algorithm, including NIC, scAI, Multi-Omics Factor Analysis v2, and JSNMF. MGR-NIC is the most stable and reliable method, implying its robustness across different datasets and its reliability in yielding consistent and accurate results.
INTRODUCTION
Nowadays, single-cell multi-omics datasets offer unprecedented opportunities for cell clustering from multiple perspectives. Joint analysis using multi-omics data can provide insights into intermolecular regulation and causal relationships, and characterize intercellular heterogeneity from various perspectives. Alzheimer’s disease (AD) is a complex neurodegenerative disorder, and the precise elucidation of its pathogenic mechanisms is crucial for research and treatment. The limitations of current data clustering methods have driven continuous optimization and innovation in multi-omics data analysis algorithms tailored for AD. The innovation and application of multi-omics algorithms will provide powerful tools for AD research.
The main difference between current clustering algorithms (Dey et al., 2021; Dong et al., 2021; Li et al., 2021) is how the cellular features are extracted and how the clusters are selected. K-means (Grün et al., 2015) and its variant Clustering through Imputation and Dimensionality Reduction (CIDR) perform clustering of cells by constantly updating the centers of similar cell samples, however, these algorithms struggle to handle the heterogeneity of the data properly (Lin et al., 2017). Multi-omics factor analysis (MOFA) ignores relationships in multi-omics data (Argelaguet et al., 2018). Multi-omics factor analysis v2 (MOFA+) reconstructs a low-dimensional representation of the data to cluster the data (Argelaguet et al., 2020). It is unsuitable for sparse or noisy data and may lead to poorer results. It is an effective and advanced tool for characterizing many types of measurements and dissecting the cellular heterogeneity of the data (Jin et al., 2020). However, scAI is less suitable for large-scale datasets due to longer computation times and higher computational resource requirements.
The NIC algorithm circumvents the drawbacks mentioned in the above algorithms (Li et al., 2022). To address the above issues, NIC is designed to handle large-scale datasets. By leveraging efficient computational techniques, NIC can process large datasets within reasonable timeframes. NIC automatically constructs similarity networks of cells for each data based on adaptive learning. The data are downscaled using an orthogonal projection matrix, followed by the decomposition of the cellular similarity network using the nonnegative matrix factorization (NMF) to obtain the cellular features of each data (Wu et al., 2022). Finally, NIC utilizes the shared features of cells to identify cell types and extract genes. Although the algorithm has a lot going for it, the NIC algorithm is susceptible to the input data, and some outliers or noise in the dataset may significantly impact the clustering results, leading to unstable clustering results. Given a data matrix, NMF in the algorithm can find the two low-rank matrices, but they may ignore potentially helpful information about the data space (Li et al., 2022). Based on the existing foundation of the NIC algorithm, we add graph regularization constraints to extract data feature information. By leveraging the connections and similarity between samples, high-dimensional geometrical structure is captured in the matrix, and noise is reduced. We propose a comprehensive single-cell analysis based on multi-graph regularization and network-based integrative clustering algorithm (MGR-NIC) to identify the cell types of the data, which better preserves the structure and relationships of the data.
Experiments on six multi-omics datasets demonstrate that MGR-NIC achieves more consistent accuracy compared to other state-of-the-art multi-omics clustering algorithms.
METHODS AND MATERIALS
Workflow of this study
This study consists of two parts and the workflow is shown in Figure 1. The first part is our proposed MGR-NIC algorithm, which consists of three main steps: the first step of the algorithm is adaptive graph learning, followed by integrative analysis, and cell clustering finally (Fig. 1A). The integration analysis section of the NIC algorithm relies on NMF. However, NMF lacks proper regularization of the basis matrix, resulting in features that are not easy to retain (Salahian et al., 2023). When the dataset is very sparse or if there are few co-occurrence relations for certain features, the NMF algorithm may not be able to capture the pattern and structure of the dataset well. This may result in missing important feature information in the decomposition results. To address these issues, as shown by the red marking GR in Figure 1A, we add two constraints γtr(
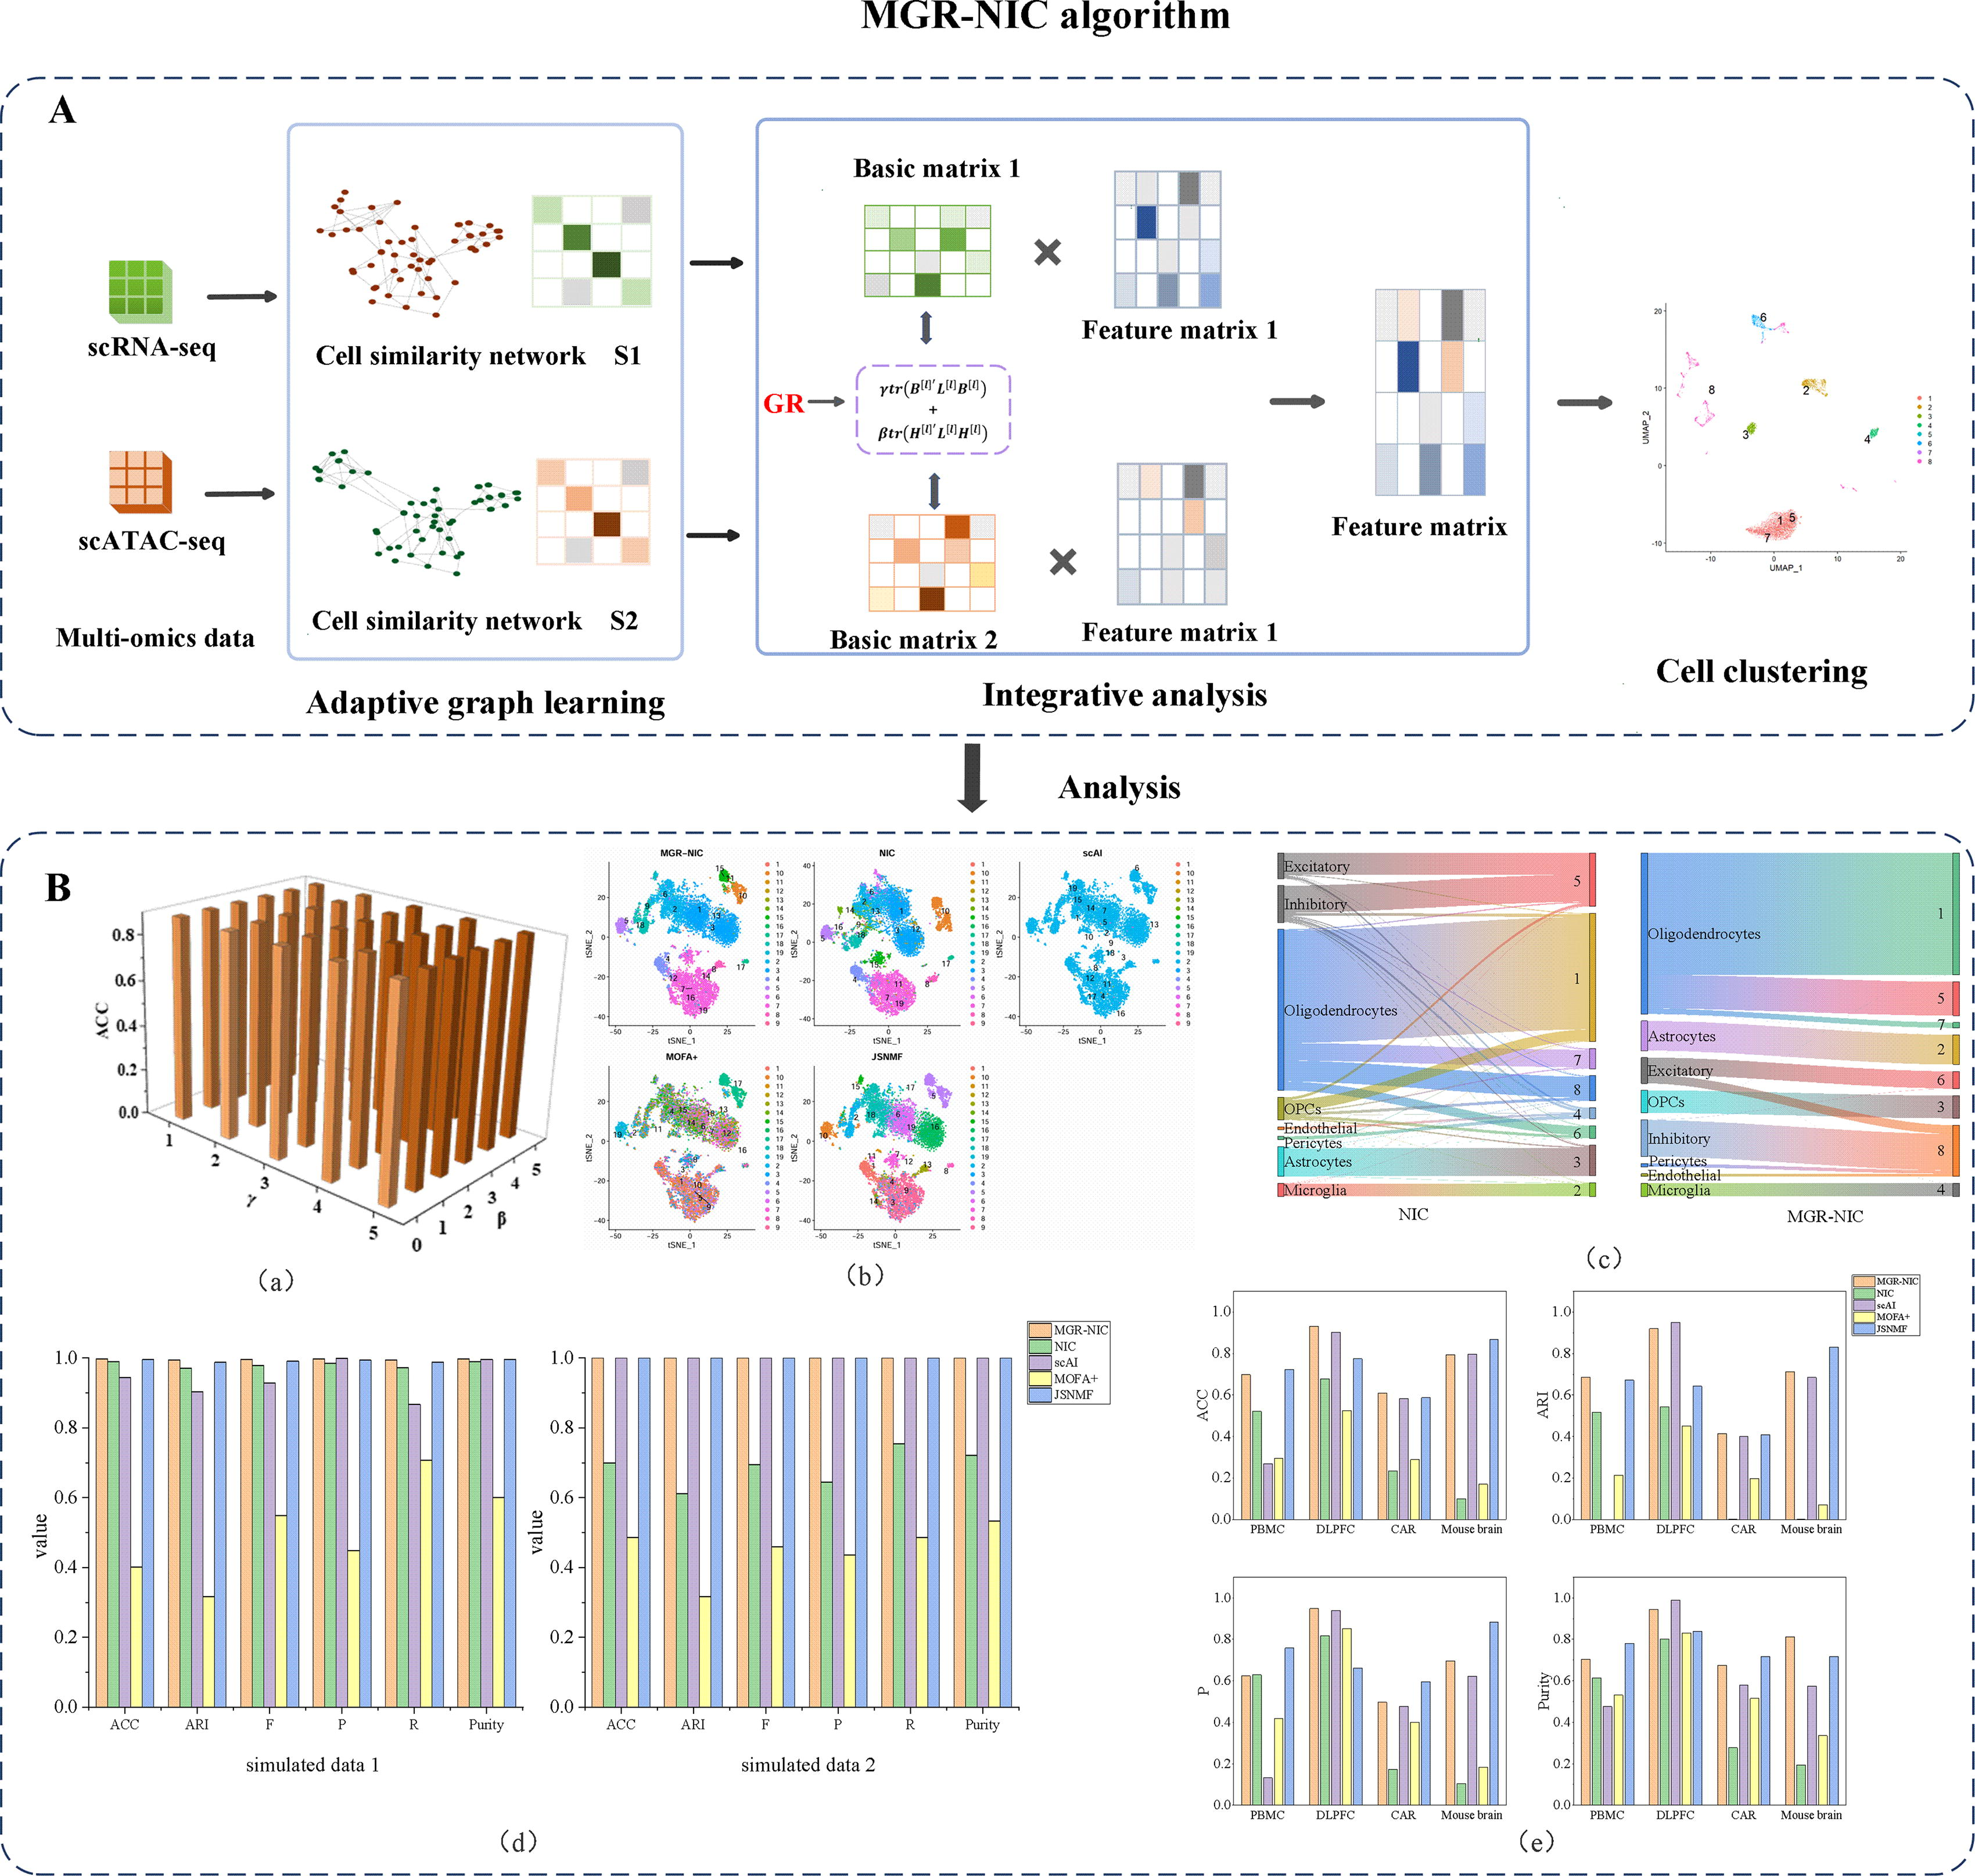
MGR-NIC algorithm overview.
The second part uses diverse comparative experiments on the performance of the proposed MGR-NIC algorithm (Fig. 1B). Parameter sensitivity analyses were conducted to validate the stability of the algorithms using datasets of AD and control samples [Figure 1B (a)]. In this paper, the visualization capabilities of the five algorithms are analyzed through data visualization performance comparisons [Figure 1B (b)]. Sankey diagrams are used to track the data transfer between clusters. They are used in this paper to validate and compare the differences before and after the algorithm improvement [Figure 1B (c)]. Also considering the comprehensive clustering performance of the algorithms, six clustering evaluation metrics, accuracy (ACC), adjusted Rand Index (ARI), F1-score (F), recall (R), precision (P), and Purity were used to verify the performance of MGR-NIC on different histologies and algorithms [Figure 1B (d) and (e)].
The algorithms proposed in this paper are useful for integrating various types of data, such as genomics, transcriptomics, proteomics, and epigenetics, including scRNA-seq, CITE-seq, scATAC-seq, and others. Researchers can integrate gene expression data and protein expression data for tumor sample classification and the discovery of associations between genes and proteins. On the other hand, integrating genomic data and metabolomic data can help reveal the associations between metabolic abnormalities and gene mutations, expanding our understanding of disease mechanisms. This multi-omics integration approach contributes to a deeper understanding of the complexity of biological systems and advances biomedical research.
After the completion of multi-omics data clustering, subsequent analyses can be performed on different clusters for cell type identification, gene regulatory network analysis, and pathway analysis, which lays a good foundation for exploring cellular interactions and pathogenic mechanisms.
Given the normalized RNA-seq matrix
The integration analysis section uses NMF. NMF belongs to unsupervised learning techniques and is commonly used for recognizing biological modular networks and cell clustering (Lee and Seung, 1999). In short, a NMF is the decomposition of a large nonnegative matrix into two small nonnegative matrices.
Given a dataset in matrix form
The projection of a multilayered network into a common subspace is a data representation method that integrates multiple layers, allowing for the synthesis of information from different levels to find consistent data table evidence (Ma et al., 2019). The NIC algorithm considers the association between two data and uses this type of approach to find the cellular shared features of the two data.
The NIC utilizes the matrices of the higher order topological index PMI (Li et al., 2018). 0 ≤
However, NMF may be sensitive to different data quality or different algorithms. (Kim and Park, 2007). To solve these problems, in this study, the enforces graph regularization (GR) on the basis matrix is introduced in each modality.
Graph Regularizer. Under certain assumptions, if two sample points are close in high-dimensional space, they will also remain close in low-dimensional space (Shu et al., 2022). The distance measure is as in Equation (4)
If two sample points are connected, then an edge connecting the two is generated. The calculation of the weight of this edge. The equation is as follows
σ represents the trade-off parameter. If a pair of cells has similar expression profiles, then they are well connected in the network and vice versa. Thus, the objective is
This paper further extends the application of adaptive learning. We are concerned that some of the attributes or features of the shared feature matrix are obtained based on transformations or combinations of the underlying matrix. Potential structural information is underutilized in the data (Li et al., 2022). For the MGR-NIC algorithm to retain valid information about the data space and to fully utilize the potential local structural information in the data, we did not focus on the shared feature matrix, but instead constructed regular similarity map matrices for both basic matrices in the data space as shown in Equations (7) and (8)
Equation (3) can be reformulated as
Equation (9) is non-convex, we use multivariate alternating update rules to optimize individual variables. The algorithm reaches convergence faster through an iterative strategy. Let Ψ[
By fixing
By fixing
By fixing
The γtr(
The update rule for
Same for other variables, by fixing
The AD dataset was downloaded from the National Center for Biological Information Technology Information (NCBI) database. The downloaded dataset number is GSE274979. Gene expression and chromatin accessibility were in 105,332 cell samples. This article (Anderson et al., 2023) normalized and dimensionality reduced both data using Seurat (Hao et al., 2021) and Signac (Stuart et al., 2021), respectively. Similarly, this paper performs a similar operation on data from the source database. Cells with <300 genes, >3,000 genes, or >5% mitochondrial genes were filtered out. ATAC data is processed similarly and takes the intersection of the cells of both data. A total of 5,331 filtered cell samples were selected for analysis. After data normalization, 6,000 highly variable genes with the variance stabilizing transformation method for gene expression data, and 12,000 chromosome location information were selected for chromatin accessibility data. This leads to the creation of the DFPLC dataset for this paper.
Evaluation metrics
We used six clustering evaluation metrics to validate the performance of our MGR-NIC algorithm: ACC, ARI, F, R, P, and Purity as shown in Figures 6 and 7. For the evaluation of the two simulated datasets, we employed multiple metrics including ACC, ARI, F, R, P, and Purity (Fig. 6). In the case of the four real datasets, we utilized ACC, ARI, P, and Purity as evaluation metrics (Fig. 7). The six indicators and the mathematical meaning of each indicator are shown below.
ACC calculates the percentage of correctly predicted cell type labels in cell clustering results
Purity is the degree of purity of sample categorization in the clustering results. Where
The other three metrics for evaluating clustering performance are defined below:
Our proposed MGR-NIC method incorporates four parameters: k, α, γ, and β. Parameter α controls the regularization term, k represents the number of features, γ and β are the graph regularization parameters. In particular, we varied the values of the two graph regularization parameters, while keeping the other parameters fixed for the datasets. Based on previous studies (Wu et al., 2022), it was observed that when α ≥ 2, NIC realizes favorable trade-offs. The algorithm performs best when the number of features is close to the number of cell types. To determine the optimal values for γ and β, we employed a grid search method and tested them within the range of [0, 1, 2, 3, 4, 5].
Cell clustering
To intuitively demonstrate the clustering performance of the algorithm, we employed t-distributed stochastic neighbor embedding (t-SNE) to cluster and visualize the dataset. The cell type labels provided in the dataset were used in the analysis.
RESULTS AND DISCUSSION
Data source
Simulated data 1 and simulated data 2 were generated using the MOSim package (Carlos et al., 2018) based on the same samples, simulating two single-cell datasets.
We demonstrate these methods using publicly available 12,000 human peripheral blood cells (PBMC) multi-omics data from the website (https://satijalab.org/seurat/articles/atacseq_integration_vignette). In real multi-omics datasets, two input data were simultaneously collected in the same cells. Mouse brain data and mouse kidney data are provided in the literature (Ma et al., 2022). CAR is a mouse kidney dataset from the same cells. For evaluation datasets on real datasets, including the sci-CAR (Cao et al., 2018) mouse kidney dataset, the mouse brain dataset (Zhu et al., 2019), in which gene expression and one of five histone modifications in the same cell were analyzed, we selected one histone modification, H3K4me3 to evaluate. The statistical information of the dataset used for the algorithm is shown in Table 1.
Statistical Information of Six Datasets
Statistical Information of Six Datasets
PBMC, peripheral blood cells.
The DLPFC dataset includes AD cell samples and Ctrl cell samples. In this paper, 5,531 cell samples were divided into AD and Ctrl groups. Parameterization experiments were performed separately, and the MGR-NIC algorithm was used for multigroup joint clustering and parameter sensitivity analysis. Parameter stability can be evaluated by analyzing the algorithm’s performance across various parameter settings. For instance, in this study, the algorithm was executed with a diverse set of parameter combinations to monitor the fluctuations in its clustering accuracy. If the algorithm consistently delivers stable clustering accuracy results across different parameter configurations, characterized by a consistent trend, it can be concluded that the algorithm exhibits robust parameter stability.
From Figure 2, The darker the color of the bar graph, the more accurate the clustering. It is evident that regardless of the variations in parameters γ or β, the clustering accuracy values of the algorithm remain nearly constant across both the AD group (Fig. 2A) and the Ctrl group (Fig. 2B). Therefore, the clustering performance of the MGR-NIC algorithm demonstrates stability.
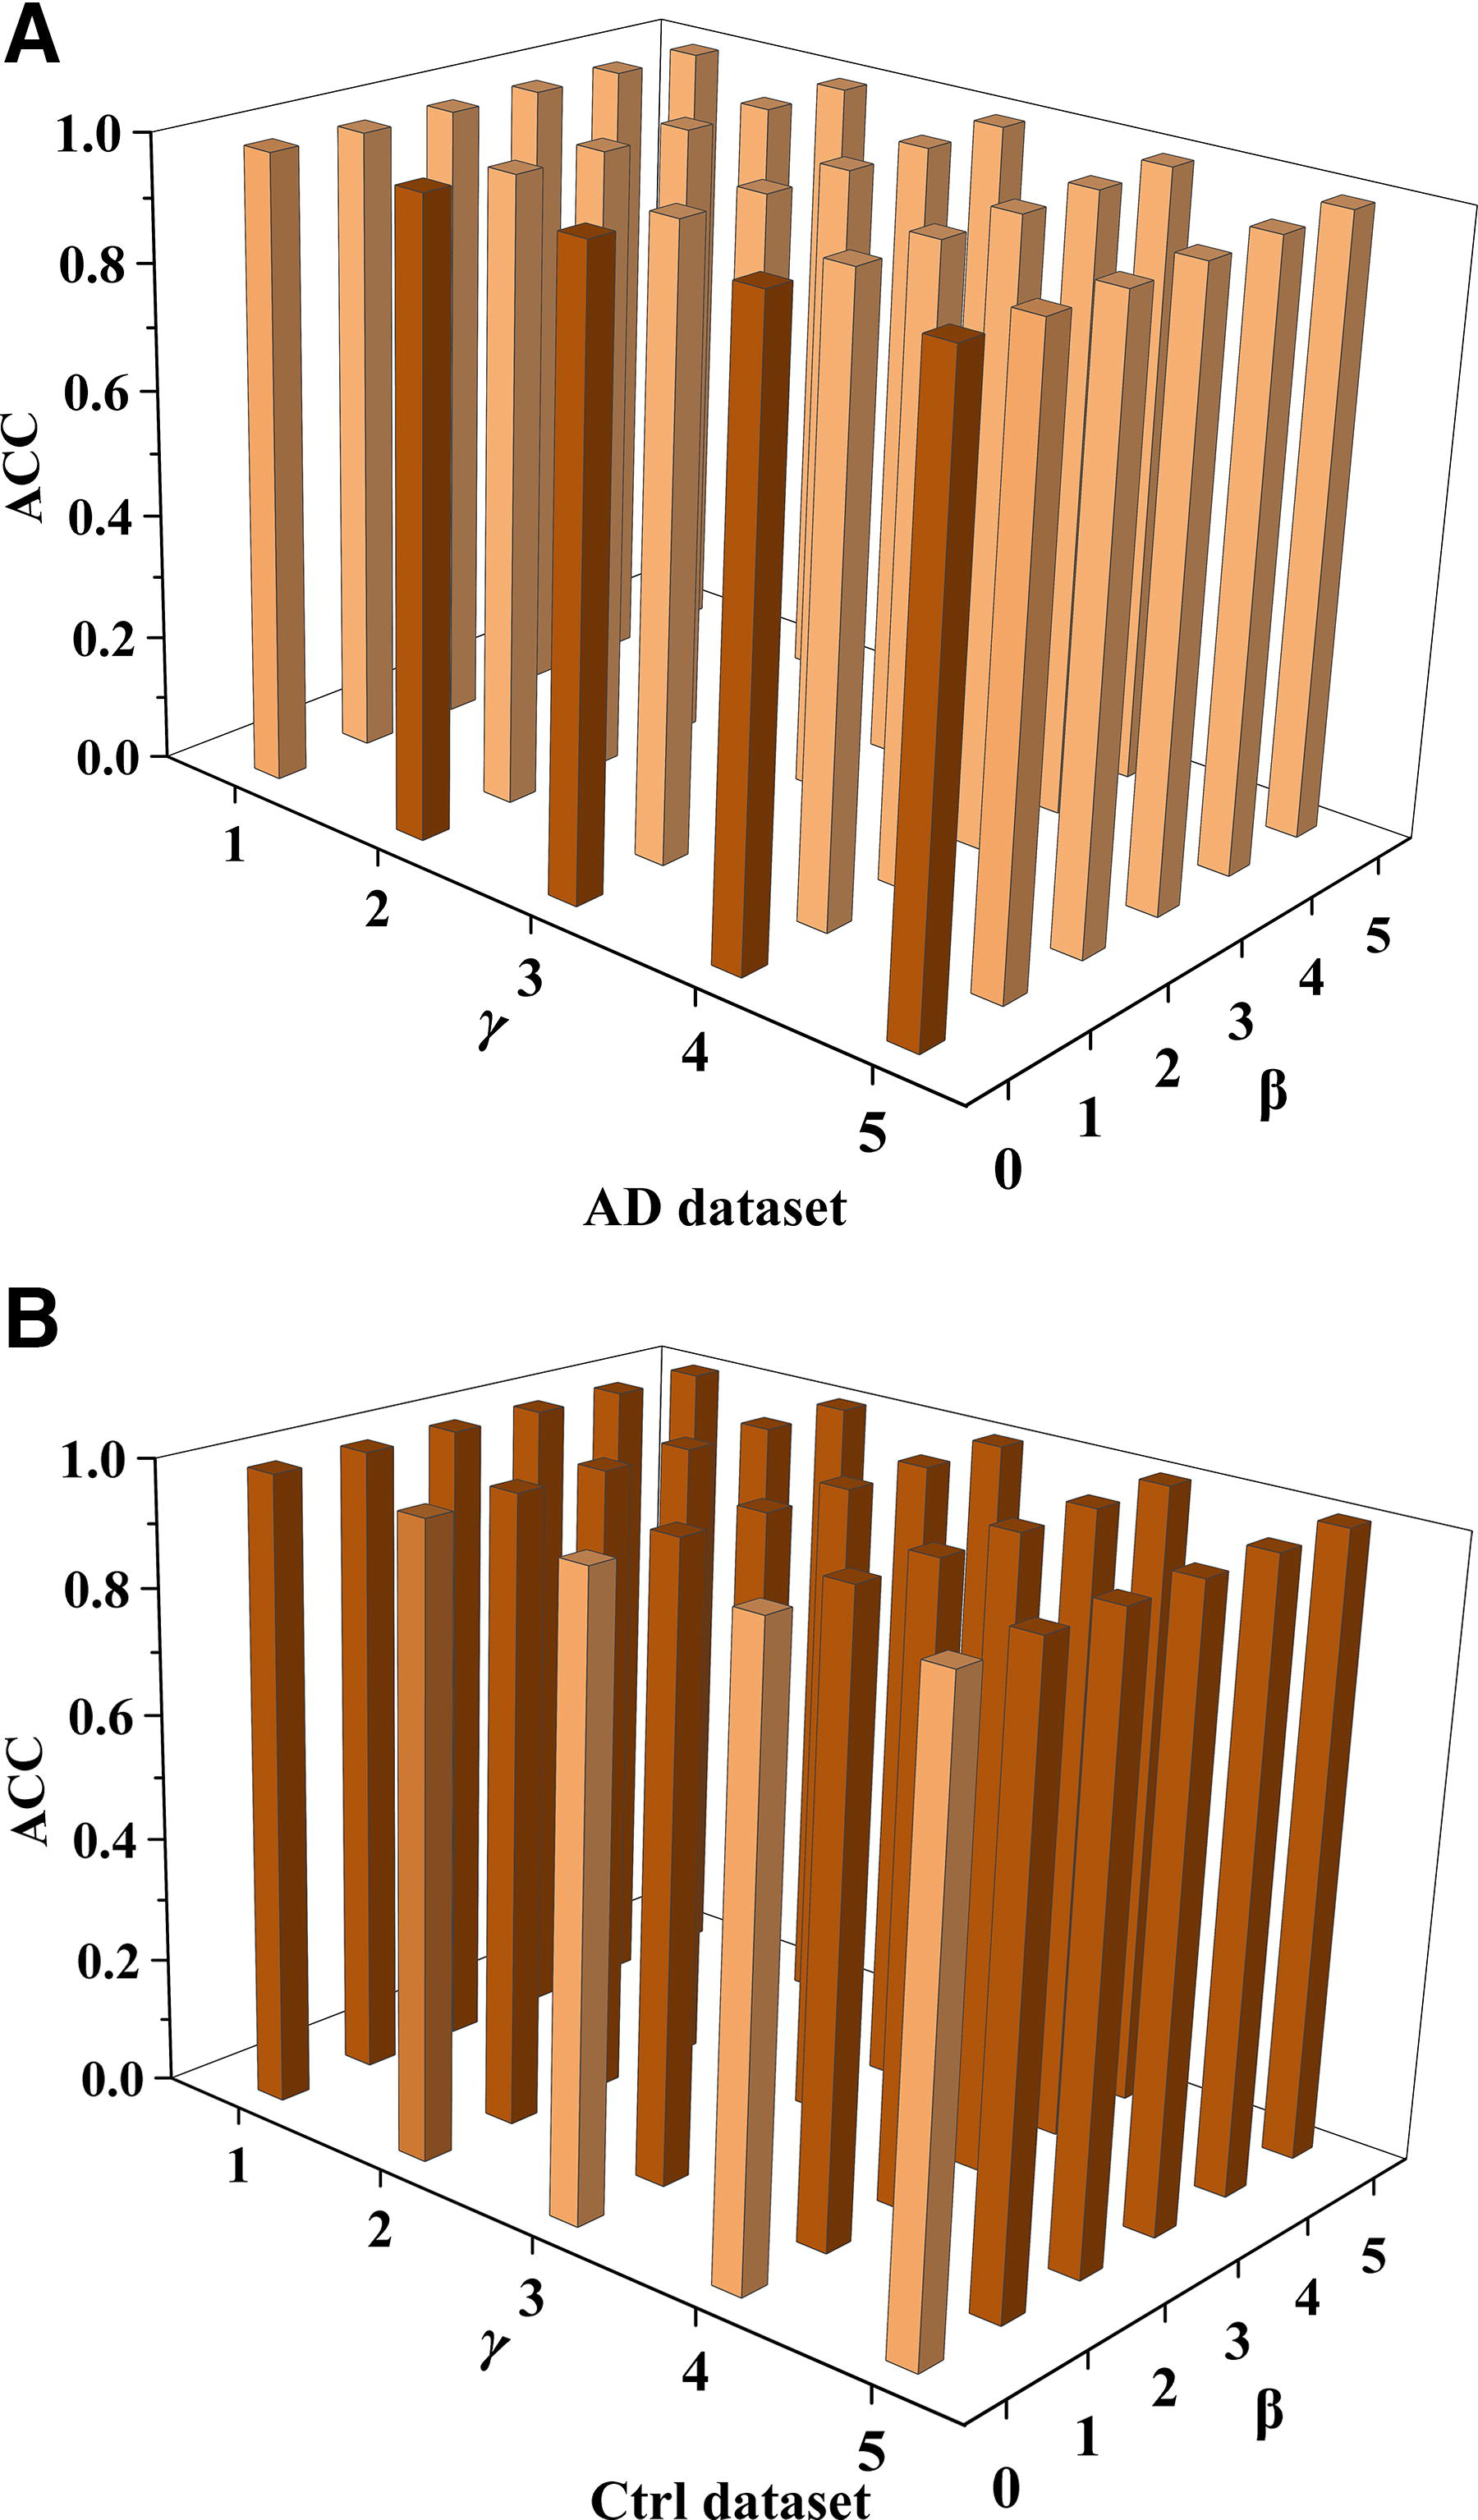
Experimental results of parameter sensitivity.
To demonstrate the robustness of the MGR-NIC algorithm, this paper selects multiple datasets for validation. Specifically, considering that simulated datasets are synthetically generated based on predefined models or rules, while real datasets exhibit more complex characteristics, we conduct parameter sensitivity analysis experiments on two simulated datasets and five real datasets. By adjusting algorithm parameters across six distinct datasets, the relationship between parameter configurations and algorithmic accuracy can be effectively determined. When γ ≥ 4 and β ≥ 4, the MGR-NIC algorithm exhibits stable and superior clustering performance on most multi-omics datasets, as shown in Table 2.
The Parameters of All Datasets
GSE214979 is a multi-omics dataset related to AD. The dataset has eight different clustering labels to represent various cell types. To compare the clustering results of the other four algorithms with the improved MGR-NIC algorithm in this paper more intuitively, we used t-SNE to visualize the DLPFC and PBMC datasets. scAI and MGR-NIC keep the same number of iterations (100) and other parameters by default. Both JSNMF and MGR-NIC algorithms use adaptive graph learning, and for the sake of comparison, keep the number of iterations the same (100), the number of neighbors the same (5), and other parameters by default.
As shown in Figure 3, for the DLPFC dataset, the ability of scAI and JSNMF to distinguish cell populations is more prominent, while MGR-NIC performs equally well. The NIC algorithm faces difficulties distinguishing similar cell types due to numerous different cell types within a single cell cluster. In contrast, the MGR-NIC algorithm efficiently subdivides cell clusters into 6 and 8, while the NIC algorithm mixes them. Compared to the NIC algorithm, MGR-NIC enhances the ability to differentiate cell clusters, particularly by significantly reducing the mixing of cell clusters (1, 6, 7, 8).
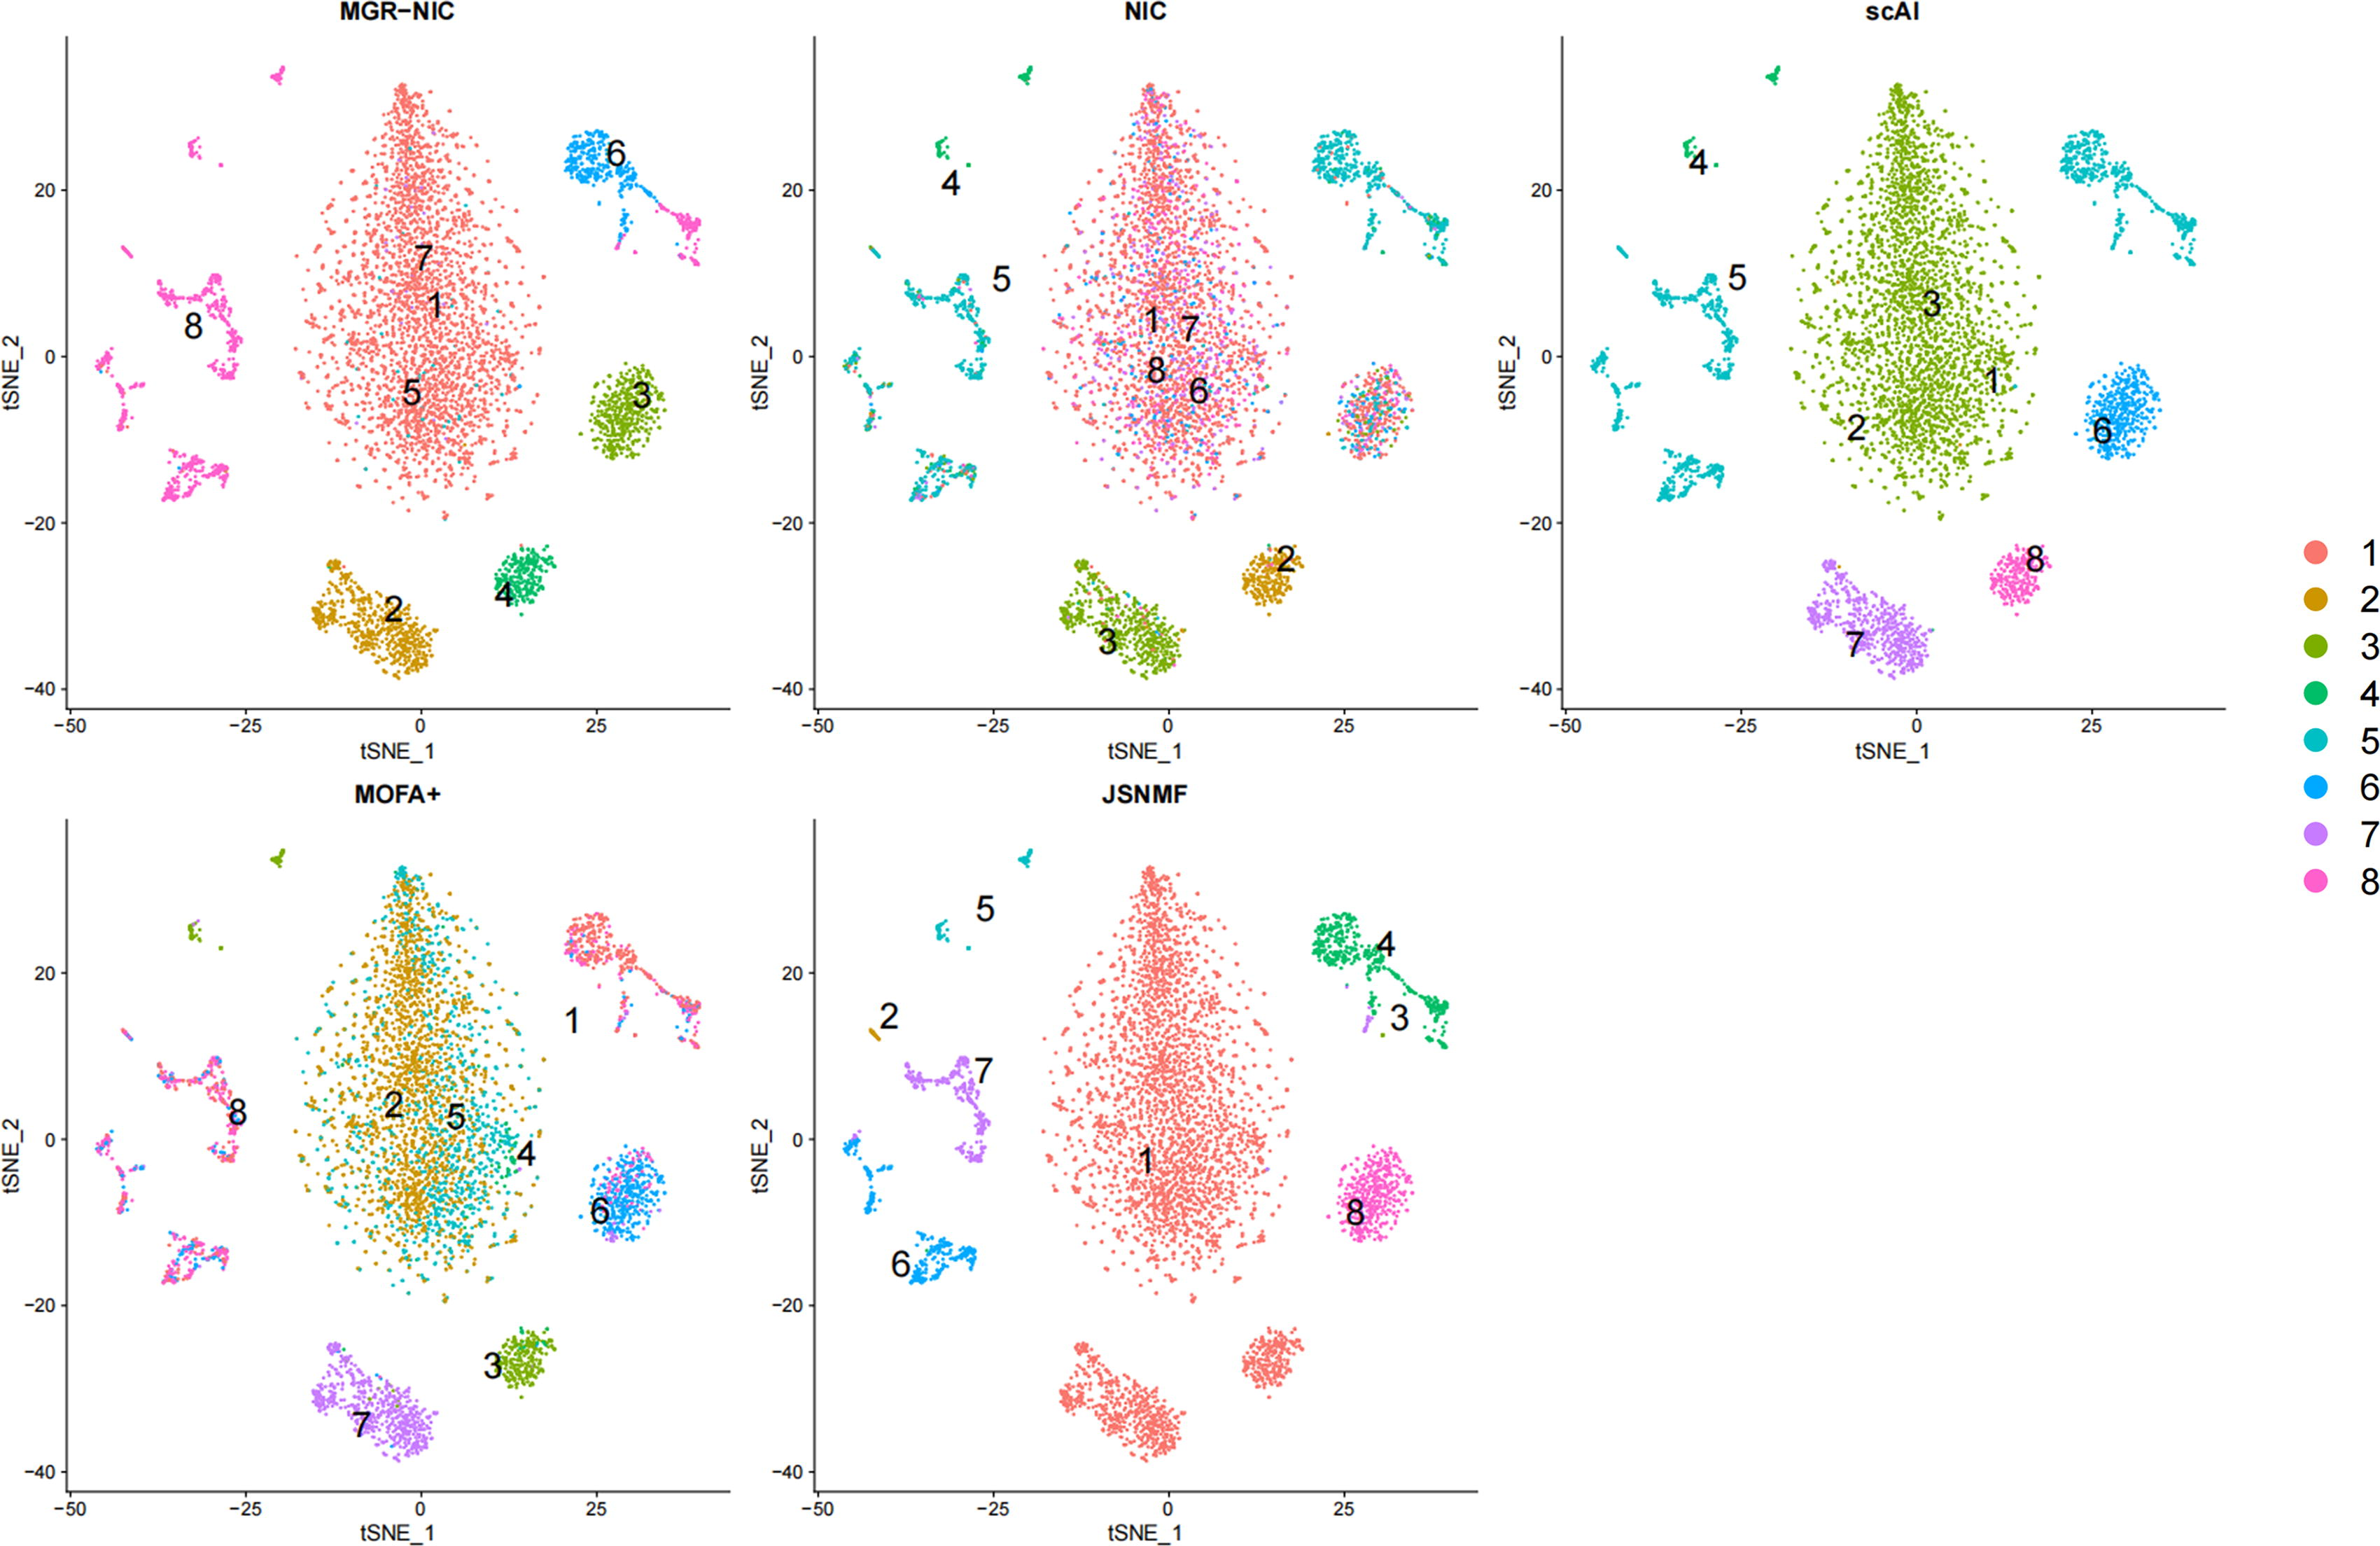
The t-SNE visualization of cells from DLPFC data (RNA+ATAC). t-SNE, t-distributed stochastic neighbor embedding.
NIC algorithm heavily mixes four cell types (1, 6, 7, 8), whereas MGR-NIC only mixes a minimal amount of other cells but can differentiate between different cell types. As depicted in Figure 3, the clustering performance of the MGR-NIC algorithm surpasses that of NIC, indicating that it captures useful feature information overlooked by the previous algorithm, thereby providing a more accurate description of cell types.
From Figure 4, it can be observed that for the PBMC dataset, scAI struggles to differentiate the data into distinct clusters under the same number of iterations. While MOFA+ performs clustering on the data, it fails to adhere to the principle where similar cell types should be closer and dissimilar ones should be distant. In comparison to the previous two algorithms, JSNMF exhibits significant differences in cell clustering, especially in clusters 2, 5, 10, and 16. However, in the clustering of clusters 1, 3, 4, 9, 11, and 14, MGR-NIC and NIC demonstrate clear advantages, with MGR-NIC particularly excelling in distinguishing cell types. Therefore, it can be inferred that MGR-NIC exhibits the strongest ability to differentiate cell populations in the PBMC dataset.

The t-SNE visualization of cells from PBMC data (RNA+ATAC). PBMC, peripheral blood cells.
To observe the difference in clustering performance between MGR-NIC and NIC on the DLPFC dataset, this study employs Sankey diagrams for a visual comparison. The left side of Figure 5A and 5B shows the true cell type labels provided by the original data, which are used to validate the algorithm performance. Both result diagrams indicate that the clustering results of the MGR-NIC algorithm closely match the true clustering assignments, with only a few cells being clustered into a single class. Figure 5A illustrates the shortcomings of NIC in clustering DLPFC multi-omics data, with many instances of significant crossover and mixing in most classification outcomes.
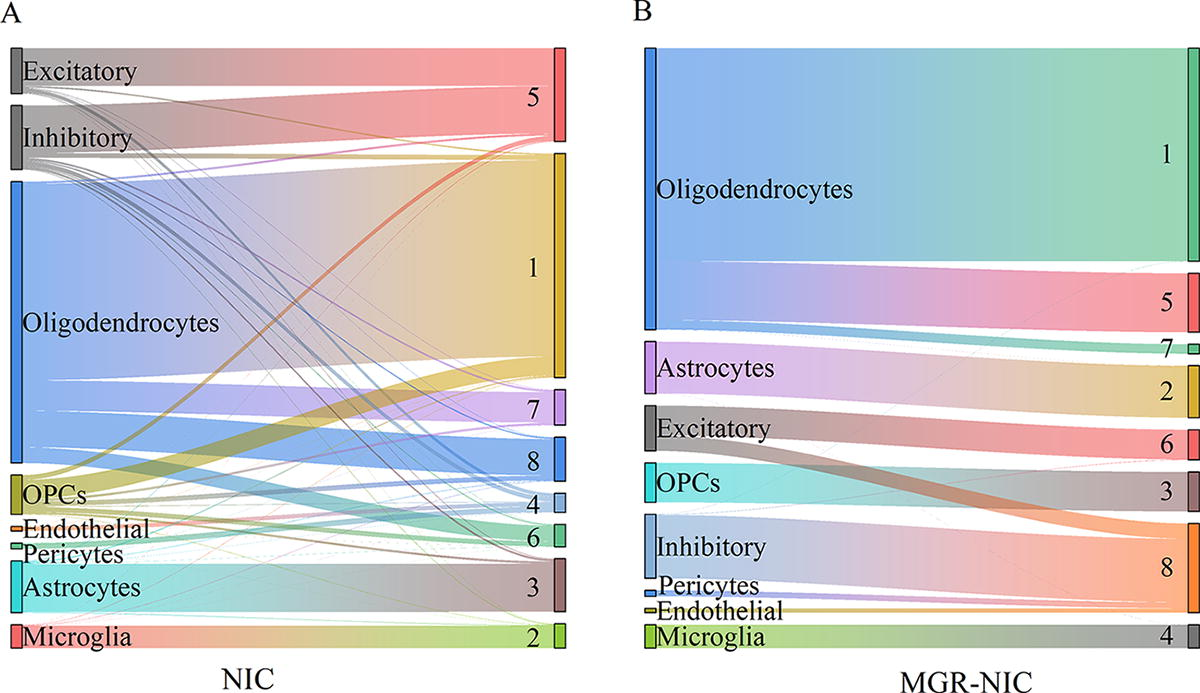
The Sankey diagram compares the clustering results of the NIC and the MGR-NIC. MGR-NIC, multi-graph regularization and network-based integrative clustering algorithm.
In contrast, Figure 5B demonstrates that the clustering results of MGR-NIC align well with the cell samples provided in the original study, with only a small number of cells classified into other types.
We evaluated the clustering performance of MGR-NIC on a total of six multi-omics datasets, which included two simulated datasets and four real multi-omics datasets. For a comprehensive comparison, we compared three excellent single-cell multi-omics data integration methods with our algorithm, namely NIC, scAI, MOFA+, and JSNMF.
scAI is a method for MOFA, which is specifically designed for parallel single-cell integrated analysis. The MOFA+ algorithm provides a low-dimensional representation of cells but does not include a built-in clustering method. Therefore, we clustered the samples based on the values of the latent factors obtained from the MOFA+ analysis. JSNMF is a robust algorithm designed to efficiently reduce dimensionality and uncover synergistic relationships in multi-omics data. In both scAI and MOFA+, we used the default parameters of the above algorithm.
By including these established methods in our evaluation, we aimed to provide a comprehensive and fair comparison of MGR-NIC clustering performance against the state-of-the-art approaches across these diverse datasets.
As depicted in Figure 6, it is evident that our proposed MGR-NIC algorithm exhibits excellent performance on two simulated datasets. It indicates that even when the NIC clustering is already proficient, MGR-NIC can further enhance the results. For instance, in the case of simulated data 1, the ACC value increases from 0.99 to 0.998, while the ARI value improves from 0.970 to 0.994. These achievements are equivalent to the state-of-the-art multi-omics clustering algorithm.

Evaluating clustering performance on two simulated multi-omics datasets.
While simulated datasets can be used to validate the performance of the algorithm, we expect MGR-NIC to be equally good on real multi-omics data and validate it using four multi-omics datasets from different organizations.
The clustering effectiveness of MGR-NIC exhibited substantial improvement compared to the original NIC algorithm. In Figure 7A, the ACC of MGR-NIC on the DLPFC dataset is found to be 0.933, while the NIC is 0.678, which exerts a definite advantage over the scAI, MOFA+, JSNMF. MGR-NIC outperformed other methods on CAR datasets, with 0.615 for CAR. In comparison, the JSNMF algorithm, which is next to the MGR-NIC method, has an ACC value of 0.587 for CAR datasets. The ARI, purity, and P scores similarly inform the performance of the algorithm.
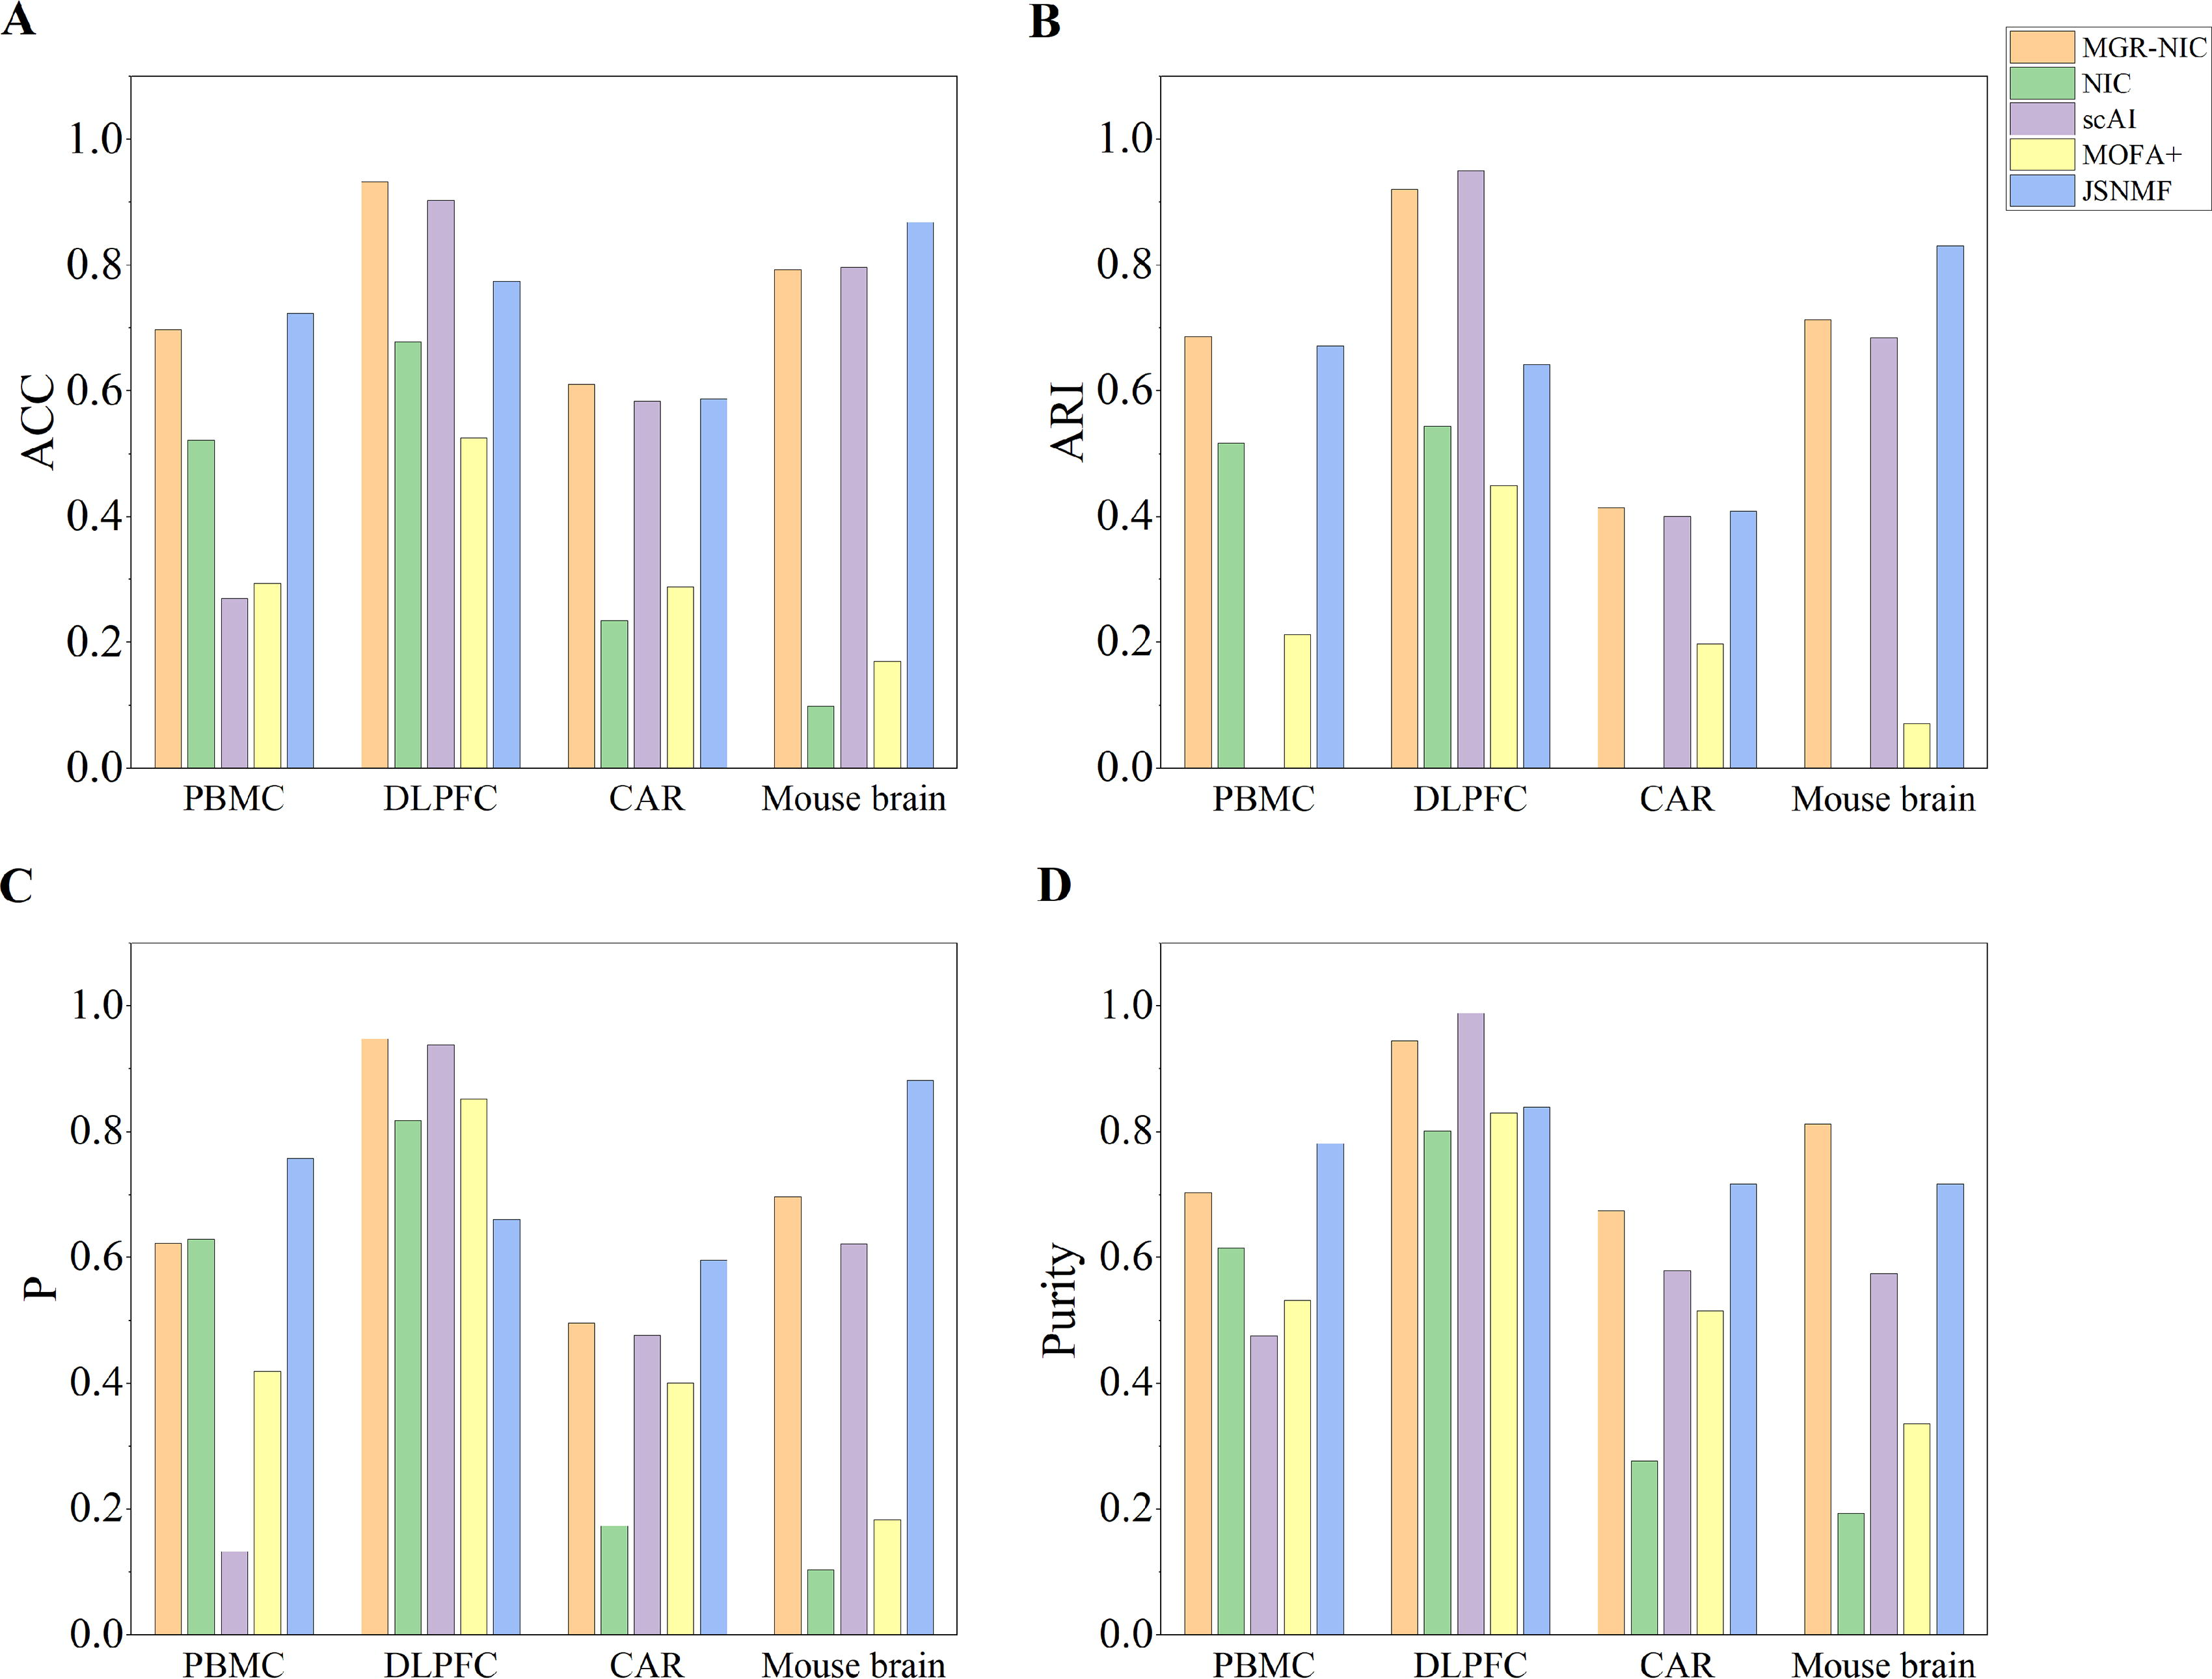
Clustering performance was evaluated on four real multi-omics datasets.
The NMI, ARI, P, and Purity scores of various algorithms for cell clustering on real multi-omics datasets are presented in Figure 7. As illustrated in Figure 7, MGR-NIC demonstrates superior performance in comparison with the four other methods. Across diverse datasets, MGR-NIC consistently ranks within the top two in terms of accuracy. The clustering effectiveness of MGR-NIC exhibited substantial improvement compared to the original NIC algorithm. Moreover, these results demonstrate that MGR-NIC accurately identifies cell clusters even in large-scale datasets, indicating that the constrained optimization strategy is robust to varying dataset sizes.
The joint analysis of multi-omics data is transforming our understanding of neurodegenerative diseases such as AD. However, the computational methods used to comprehensively analyze single-cell transcriptome and epigenome profiles are limited and ignore information about the geometric structure of the data space. To address this limitation, a comprehensive multi-omics analysis based on multi-graph regularization and network-based integrative clustering methods (MGR-NIC) is proposed in this study.
Firstly, MGR-NIC learns the respective cell similarity maps from the two histological data obtained from the same samples. Secondly, regularization constraints imposed on both the basis matrix of the similarity matrix and the basis matrix of the PMI matrix can improve the performance of the algorithm when extracting data features. This improves the ability of similar cell samples to aggregate under graph structure constraints. Third, the two visualization methods demonstrate useful information about the data learned by the MGR-NIC algorithm. To further validate the performance of MGR-NIC, six multi-omics datasets, we compared MGR-NIC with superior algorithms for multi-omics data integration, including NIC, scAI, MOFA+, and JSNMF. Multiple experimental results consistently demonstrate that the MGR-NIC is superior to NIC and MOFA+ in analyzing the same multi-omics data. MGR-NIC clustering accuracy was higher than NIC on both the multi-omics simulation dataset and the multi-omics real dataset. On both the mouse brain and peripheral blood datasets, MGR-NIC demonstrated superior performance over NIC, scAI, and MOFA+ across multiple clustering evaluation metrics. Additionally, on the DLPFC dataset, it outperformed JSNMF. The experimental results highlight the exceptional performance of the proposed algorithm, demonstrating its superior distinguishing ability.
A major advantage of the MGR-NIC is its flexibility in handling multiple types of input data. There is still a lot of room for improvement in MGR-NIC to fuse more different modal data and improve the accuracy of clustering.
Footnotes
AUTHORS’ CONTRIBUTIONS
S.Q.Z. and W.K.: Data curation, software, methodology, writing—original draft and writing—review and editing. W.K.: Formal analysis, funding acquisition. S.Q.W. and K.L.: Resources, supervision, and project administration. K.W.: Investigation, methodology. G.W. and Y.L.Y.: Supervision, validation.
DATA AVAILABILITY STATEMENT
AUTHOR DISCLOSURE STATEMENT
The authors declare no competing interests.
FUNDING INFORMATION
This work was supported by the Natural Science Foundation of Shanghai (