




Abstract
The identification of intrinsically disordered proteins and their functional roles is largely dependent on the performance of computational predictors, necessitating a high standard of accuracy in these tools. In this context, we introduce a novel series of computational predictors, termed PDFll (Predictors of Disorder and Function of proteins from the Language of Life), which are designed to offer precise predictions of protein disorder and associated functional roles based on protein sequences. PDFll is developed through a two-step process. Initially, it leverages large-scale protein language models (pLMs), trained on an extensive dataset comprising billions of protein sequences. Subsequently, the embeddings derived from pLMs are integrated into streamlined, yet sophisticated, deep-learning models to generate predictions. These predictions notably surpass the performance of existing state-of-the-art predictors, particularly those that forecast disorder and function without utilizing evolutionary information.
INTRODUCTION
Intrinsically disordered proteins (IDPs) and intrinsically disordered regions (IDRs) within proteins are characterized by an absence of stable tertiary structure, existing instead as dynamic ensembles of conformations. This structural feature, devoid of a fixed three-dimensional form, has been documented in various proteomes and is manifested in either partial or complete lack of structure under physiological conditions. (Dunker et al., 2001; Dyson and Wright, 1998; Oldfield and Dunker, 2014) Understanding the structural states of IDPs/IDRs is pivotal for elucidating their molecular functions, which are integral to a myriad of biological processes such as molecular recognition, cellular regulation, and signaling (Tripathi and Dubey, 2022). The lack of a rigid structure in IDPs confers several functional advantages, including an increased surface area for interaction with multiple proteins, conformational flexibility, and the ability to engage in interactions characterized by high specificity and low affinity (Fuxreiter et al., 2007; Gunasekaran et al., 2003). The identification and functional understanding of IDPs/IDRs are of paramount importance due to their association with a spectrum of human diseases, influenced by variations in their expression. These diseases encompass cancer, cardiovascular disorders, amyloidoses, neurodegenerative diseases, and diabetes (Babu et al., 2011; Uversky et al., 2008).
However, the dynamic and diverse conformational states of IDPs pose significant challenges for experimental structural analysis, marking a central issue in structural biology (Kodera et al., 2021). Current methodologies for investigating IDPs include X-ray crystallography, nuclear magnetic resonance (NMR) spectroscopy, circular dichroism spectroscopy, small-angle X-ray scattering, and Förster resonance energy transfer (Holmstrom et al., 2018; Plitzko et al., 2017; Tompa, 2011; WILLIAMS, 1978). The heterogeneous conformations of IDPs often result in incomplete characterization, as these experimental techniques typically yield ensemble-averaged structural parameters, which may not fully capture the range of conformational variability exhibited by IDPs (Chen and Kriwacki, 2018).
To circumvent the limitations in experimentally inferring IDRs from sequence features, a variety of computational methods (WILLIAMS, 1978) have been developed. These methods are broadly categorized into four distinct groups: physicochemical based predictors, template based predictors, machine learning based predictors, and meta predictors (Liu et al., 2019). Physicochemical based predictors typically rely on a single feature, which can be a limiting factor in their performance. Template based predictors, exemplified by tools such as PrDOS and GSmetaDisorder3D, primarily depend on homologous sequences previously identified as disordered (Ishida and Kinoshita, 2007; Kozlowski and Bujnicki, 2012). Machine learning based methods were introduced to address the limitations of physicochemical-based predictors (Liu et al., 2019). Machine learning based methods were introduced to overcome the limitations of physicochemical based predictors. Unlike the latter, which depend on a singular feature, machine learning approaches integrate multiple features. These include sequence properties (Peng et al., 2006), evolutionary information (Cheng et al., 2005) and structural information (Receveur-Bréchot et al., 2006), thereby enhancing predictive accuracy. In addition to traditional machine learning methods, due to the rise and explosive development of large language models, some disorder protein predictors based on large language models have also gradually emerged, such as IDP-LM (Pang and Liu, 2023), LMDisorder (Pang and Liu, 2022), and DMFpred (Song et al., 2023).
METHODS
Datasets
CheZod datasets for disorder prediction
In this study, the CheZod1325 and CheZod117 datasets, sourced from ODiNPred (Dass et al., 2020), were employed. The CheZod1325 dataset, specifically designed to offer a balanced representation of structured and unstructured residues, is an extension of the CheZod117 dataset and was derived using NMR chemical shifts (Nielsen and Mulder, 2016). These two datasets assign a continuous value to each residue, facilitating a nuanced interpretation of protein disorder. A threshold value of 8.0 is utilized to categorize residues as either disordered (CheZOD score ≤8) or ordered (CheZOD score ≥8), allowing for a clear distinction between these states. We used the MMseqs software’s mmseqs search function to ensure that the sequence similarity between the training and testing sets was below 25%. After alignment, 1236 sequences from the CheZod1325 dataset were retained as the training set. For the purposes of training and validation, the CheZod1236 dataset was randomly divided, adhering to a split ratio of 0.2. This partitioning ensured a robust and comprehensive training process, while also providing a representative validation subset. Conversely, the CheZod117 dataset was utilized as a benchmark dataset.
DisProt Database for Disorder Function Prediction
The DisProt database (https://disprot.org), recognized for its meticulously curated annotations of binding residues based on extensive literature reviews, was a critical resource in our study for extracting protein sequences with specific binding annotations (Hatos et al., 2020). Utilizing a comprehensive set of search terms including ‘protein binding’, ‘DNA binding’, ‘RNA binding’, ‘nucleic acid binding’, and ‘lipid binding’ in conjunction with ‘disorder’, we were able to identify a significant number of proteins associated with both intrinsically disordered structures and various types of binding. Specifically, our search yielded 896 proteins for protein binding, 170 proteins for nucleic acid binding, and 58 for lipid binding.
This extensive search culminated in the identification of a total of 1116 IDRs that exhibit binding to a diverse range of molecules. The compilation of such a comprehensive dataset is pivotal for understanding the multifaceted roles of IDRs in various binding interactions. By focusing on proteins that demonstrate binding to different types of molecules, we were able to capture a wide spectrum of IDR functionalities. This approach not only enriches the dataset with a variety of binding interactions but also provides a robust foundation for further predictive modeling and analysis, aimed at unraveling the complex relationships between protein disorder and binding functions.
CAID test dataset
In our study, we integrated the Critical Assessment of protein Intrinsic Disorder prediction (CAID) experiment, a community-based blind test, to evaluate the most recent developments in predicting IDRs and residues involved in protein binding (Necci et al., 2021). The CAID experiment featured 646 novel proteins, which were sourced from the DisProt database and collectively referred to as the reference set. In the context of our research, this reference set was utilized as a crucial test dataset, serving as a benchmark for assessing the performance of function predictors.
The use of the CAID experiment’s reference set in our study allowed for a rigorous and unbiased evaluation of our predictive models. By testing our models against novel proteins not previously encountered during training or validation, we were able to effectively gauge their predictive accuracy and generalizability. This approach not only provided a comprehensive assessment of our tool’s capabilities but also positioned our findings within the larger landscape of advancements in the field of protein disorder prediction. The inclusion of the CAID reference set thus played a pivotal role in validating the efficacy of our computational tool in accurately predicting protein binding functions in IDRs.
Protein Representation and Transfer Learning
In our study, we employed three protein language models (pLMs) to generate fixed-length vector representations for each residue in a protein sequence. These models were chosen for their ability to encapsulate the complex characteristics of proteins effectively.
1. ProtT5-XL-U50 (ProtT5) (Elnaggar et al., 2021): This model is an adaptation of the Natural Language Processing (NLP) sequence-to-sequence model T5 (Raffel et al., 2020), specifically designed for protein sequences. ProtT5 was trained on the expansive Big Fantastic Database (BFD), which contains 2.5 billion protein sequences. Subsequent to this extensive training, it was fine-tuned on the UniRef50 database, ensuring a broad and comprehensive understanding of protein sequences.
2. ProtBERT (Elnaggar et al., 2021): Built on the NLP algorithm Bidirectional Encoder Representations from Transformers (BERT) (Devlin et al., 2018), ProtBERT was also trained on the BFD. This training endowed it with a robust capability to process and understand protein sequences, leveraging the advanced architecture of BERT.
3. Evolutionary Scale Modeling 2 (ESM2) (Lin et al., 2022): Unlike the previous two models, ESM2 was trained on UniRef90, employing an even weighting sampling approach. This model provides a different perspective in understanding protein sequences due to its unique training regime and dataset.
For each of these models, we extracted vectors from the final hidden layer to determine the disorder status of individual residues and to infer the molecular functionality of these disordered residues. ProtT5 and ProtBERT yield 1024-dimensional vectors, while ESM2 produces 1280-dimensional vectors. It’s important to note that we adhered to the recommendations outlined in the original publications, opting not to fine-tune these models on our two supervised tasks. Consequently, no gradient was backpropagated to the pLMs during this process. This approach ensured that the integrity and generalizability of the pLMs’ learned representations were maintained, allowing for a more accurate and unbiased analysis of protein sequences.
Architecture of Models
Feed-forward neural network (FNN)
Our FNN model is designed with a single hidden layer comprising 128 units, succeeded by sequential layers containing 64, 32, and 112 units, respectively. The input data, initially in a 2D format (112, 1024), undergoes a transformation into a 1D array via a Flatten layer. The training of the model is conducted using the mean squared error as the loss function. Optimization is achieved through the Adam optimizer, a choice motivated by its efficiency in handling large datasets and complex neural network architectures.
Long Short-Term memory model (LSTM)
The LSTM model implemented in our study features two LSTM layers, each equipped with 128 units. To mitigate overfitting, a dropout layer with a rate of 0.2 follows the first LSTM layer. The model is compiled using the Adam optimizer, selected for its adaptability and effectiveness in recurrent neural networks. The optimizer is set with a learning rate of 0.001, and the mean squared error loss function is employed to guide the training process.
Convolutional neural network (CNN)
The CNN model consists of three Conv2D layers, each with distinct kernel sizes and strides, and each layer is followed by a dropout layer to prevent overfitting. The input data is reshaped to incorporate a channel dimension, accommodating the requirements of convolutional layers. A Flatten layer is incorporated to transform the multi-dimensional output into a 1D vector. The final component of the model is a dense layer with a linear activation function, formulated to generate the final output. For compilation, the model utilizes the Adam optimizer with a learning rate of 0.001, and the mean squared error loss function is applied. The choice of this optimizer and loss function is based on their proven efficacy in CNNs, particularly in tasks involving image or pattern recognition, which bear similarities to protein sequence analysis.
Evaluation
Disorder and function predictors are designed to produce two types of outputs: first, continuous scores that determine the degree to which amino acids are either disordered or ordered and second, a propensity score indicating the likelihood of a given amino acid binding to another protein. To evaluate the accuracy of disorder predictors, we employed the Pearson correlation coefficient (ρ). This statistical measure was used to compare the observed CheZod scores with the predicted scores, providing a quantitative assessment of the linear relationship between these two sets of values. Additionally, we utilized the Spearman rank correlation coefficient to assess the monotonic relationship between the disorder probabilities generated by various disorder predictors and the CheZod scores. This approach is particularly useful for understanding the consistency and predictive reliability of the models in relation to the observed disorder patterns.
For evaluating the propensities of amino acid binding predicted by each model, we adopted the Area Under the Curve (AUC) score, as used in the SETH framework (Ilzhöfer et al., 2022). The AUC score is a widely recognized metric for assessing the performance of binary classifiers. However, given that the AUC score necessitates binary ground truth labels, we converted the continuous CheZOD scores into binary form using a threshold of 8. This binarization enabled us to compute the AUC score for each predictor effectively.
In the context of our analysis, Equation 1 plays a crucial role. In this equation, I[.] represents the indicator function. The terms, m+∕− refer to the number of ordered/disordered residues in the CheZod117 dataset, classified according to their ground truth labels. Finally,
For the task of predicting protein function, we employed a classification approach that involves the computation of various metrics based on a confusion matrix for each residue. The confusion matrix helps in calculating the following key performance indicators: recall, precision, F1-score, Matthews Correlation Coefficient (MCC), and the Area Under the Receiver Operating Characteristics Curve (AUC-ROC).
Recall (Eq. 2): This metric is calculated to determine the proportion of actual protein-binding residues that are correctly identified by the predictor. It is crucial for assessing the model’s sensitivity to identifying true positive cases. Precision (Eq. 3): Precision measures the accuracy of the predicted protein-binding residues, indicating the proportion of predicted positives that are actually true positives. F1-score (Eq. 4): The F1-score is the harmonic mean of precision and recall, providing a balance between these two metrics. It ranges from 0 to 1, where a higher value indicates superior performance of the predictor. MCC (Eq. 5): MCC is a more comprehensive metric as it takes into account true and false positives and negatives. It ranges between –1 and 1, where –1 denotes an inverse prediction, 0 denotes a random prediction, and 1 denotes a perfect prediction. AUC-ROC: This metric plots sensitivity (true positive rate) against the False Positive Rate [FPR = FP/(FP + TN)]. The ROC-AUC ranges between 0.5 (equivalent to a random guess) and 1 (indicating a perfect classifier). In these equations, TP (True Positives) refers to correctly predicted protein-binding residues, TN (True Negatives) to correctly identified non-protein-binding residues, FN (False Negatives) to protein-binding residues incorrectly predicted as non-protein-binding, and FP (False Positives) to non-protein-binding residues incorrectly predicted as protein-binding.
These metrics collectively offer a comprehensive assessment of the predictive performance of our model in the classification of protein function, allowing us to evaluate its accuracy, reliability, and overall effectiveness.
Architecture of PDFll
PDFll’s architecture is designed around a two-step prediction process, which integrates the strengths of both pLMs and machine-learning (ML) models.
Processing by pLMs: In the first step, the input protein sequence is processed by several pLMs. These models, which have been trained on vast datasets of protein sequences, are adept at capturing the complex patterns and features inherent in these sequences. By processing the input sequence through multiple pLMs, PDFll is able to generate a comprehensive set of numerical features. These features encapsulate various aspects of the protein sequence, such as structural properties, evolutionary information, and biochemical characteristics.
Prediction by ML or deep learning (DL) Models: The second step involves feeding the numerical features obtained from the pLMs into a ML model. This model is responsible for generating the final predictions. The choice of ML or DL models allows for a flexible and powerful approach to prediction, leveraging advanced algorithms to interpret the nuanced features extracted by the pLMs. The integration of these features into a sophisticated predictive model ensures high accuracy and reliability in forecasting protein disorder and function.
Through this two-step process, as shown in Figure 1, PDFll effectively combines the detailed feature extraction capabilities of pLMs with the predictive power of ML and DL models, resulting in a robust and efficient tool for protein sequence analysis. This architecture not only maximizes the strengths of each component but also provides a comprehensive framework for accurately predicting protein-related characteristics.
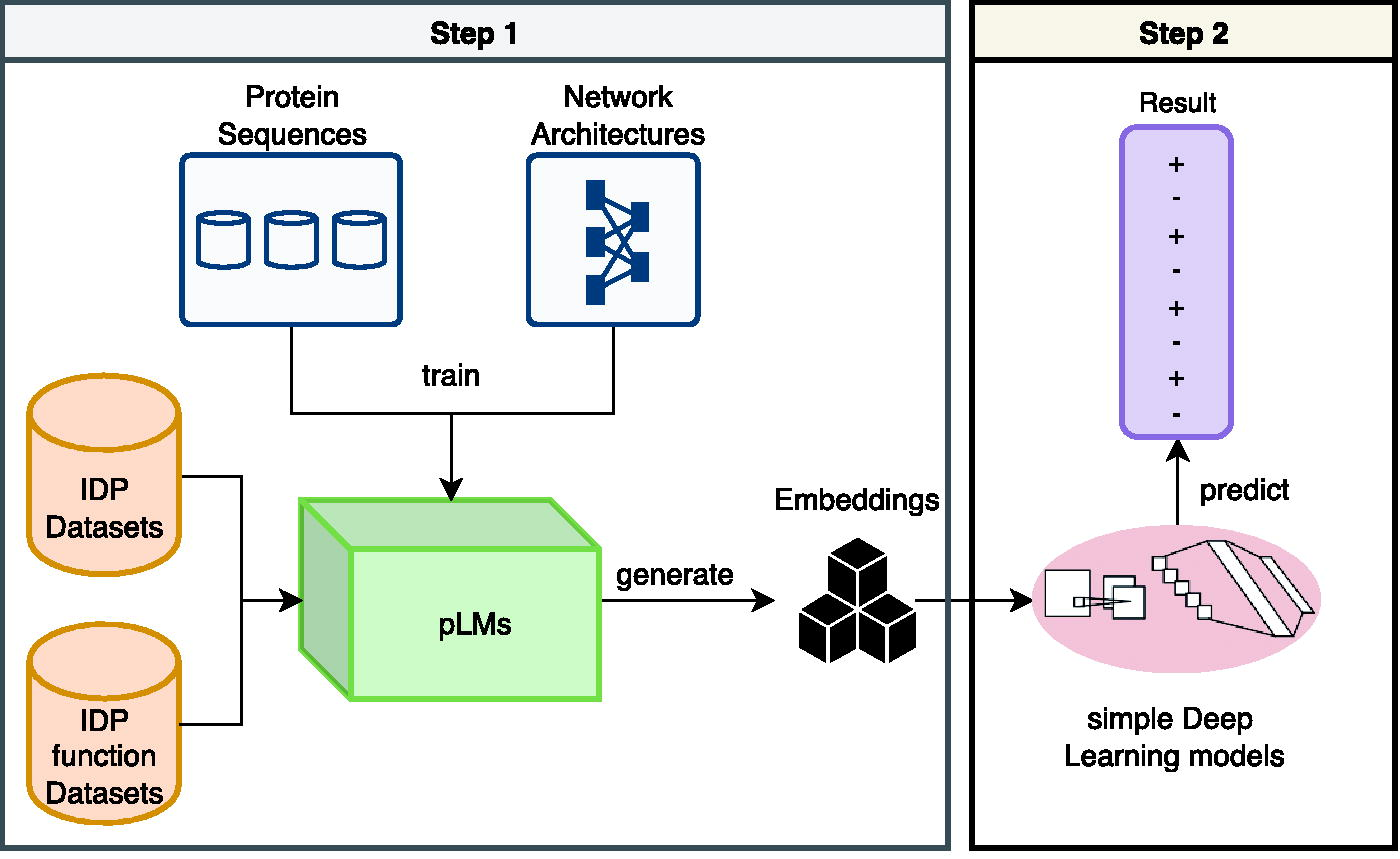
Schematic representation of the PDFll architecture for predicting protein disorder and function. Step 1 involves training pLMs using extensive IDP datasets to capture complex protein sequence features. These pLMs then generate a rich set of embeddings that encapsulate structural, evolutionary, and biochemical characteristics of proteins. In Step 2, these embeddings are fed into simple deep learning models which, based on the nuanced features provided by the pLMs, predict the likelihood of disorder and function in protein sequences. This two-step process leverages the detailed feature extraction of pLMs with the analytical strength of machine learning models, resulting in accurate predictions of protein attributes. IDP, intrinsically disordered protein; PDFll, Predictors of Disorder and Function of proteins from the Language of Life; pLMs, protein language models.
We conducted a comprehensive training and evaluation of three models using residue-level embeddings generated by different pLMs on the CheZod1236 dataset. The performance of these models was subsequently assessed on the CheZod117 dataset. This approach allowed us to juxtapose PDFll with the current state-of-the-art disorder predictor, ODiNPred (Dass et al., 2020). Figure 2 in our study illustrates the performance metrics of our disorder predictors, specifically highlighting the AUC score and the Spearman correlation coefficient(ρ). Notably, the CNN model trained on ProtT5 embeddings emerged as the top performer, achieving an impressive AUC of 0.935 and a ρ of 0.748. Interestingly, even the FNN, which adopts a simpler architectural framework, demonstrated high efficiency with an AUC of 0.896 and a ρ of 0.635. This observation underscores a critical insight: the predictive performance is largely contingent on the quality of input features. This finding reinforces the concept that the pLMs utilized in our study effectively decipher the intricate ‘grammar’ of the language of life.

Performance comparison of disorder predictors using the CheZod117 dataset, measured by AUC score and Spearman correlation coefficient. The bar graphs represent the evaluation of three different machine learning architectures: FNN, LSTM, and CNN, across three feature sets: ProtT5, ProtBERT, and ESM2. Error bars indicate the variability in performance, highlighting the robustness of the predictive models. AUC, Area Under the Curve; CNN, Convolutional Neural Network; ESM2, Evolutionary Scale Modeling 2; FNN, Feed-forward Neural Network; LSTM, Long Short-Term Memory Model.
In addition to these findings, we further extended our analysis by employing the best-performing model, ProtT5_CNN, to compare against recent fast disorder predictors on the CheZod117 dataset, as delineated in Figure 3. ProtT5_CNN uses CNN in combination with the ProtT5 pre-trained model to predict disordered regions in proteins. This comparative analysis included several prominent predictors such as SETH (Ilzhöfer et al., 2022), a disorder predictor based on pLMs that uses transfer learning techniques; ADOPT (Redl et al., 2023), another pLM-based predictor employing advanced machine learning techniques; ODiNPred (Dass et al., 2020), which uses a combination of sequence-based features and machine learning models; flDPnn (Hu et al., 2021), which employs deep neural networks to predict disordered regions; DISOPRED3 (Jones and Cozzetto, 2015), which integrates multiple sources of information including sequence-based features and evolutionary information; AUCpreD (Wang et al., 2016), which focuses on achieving high AUC metrics; and two versions of IUPred (Dosztányi et al., 2005), with IUPred1 based on estimating the energy content of sequences and IUPred2 incorporating additional sequence-based features and improved algorithms. The ProtT5_CNN model exhibited superior prediction quality, surpassing the second-best model, SETH, which had an AUC of 0.91 and a ρ of 0.72.
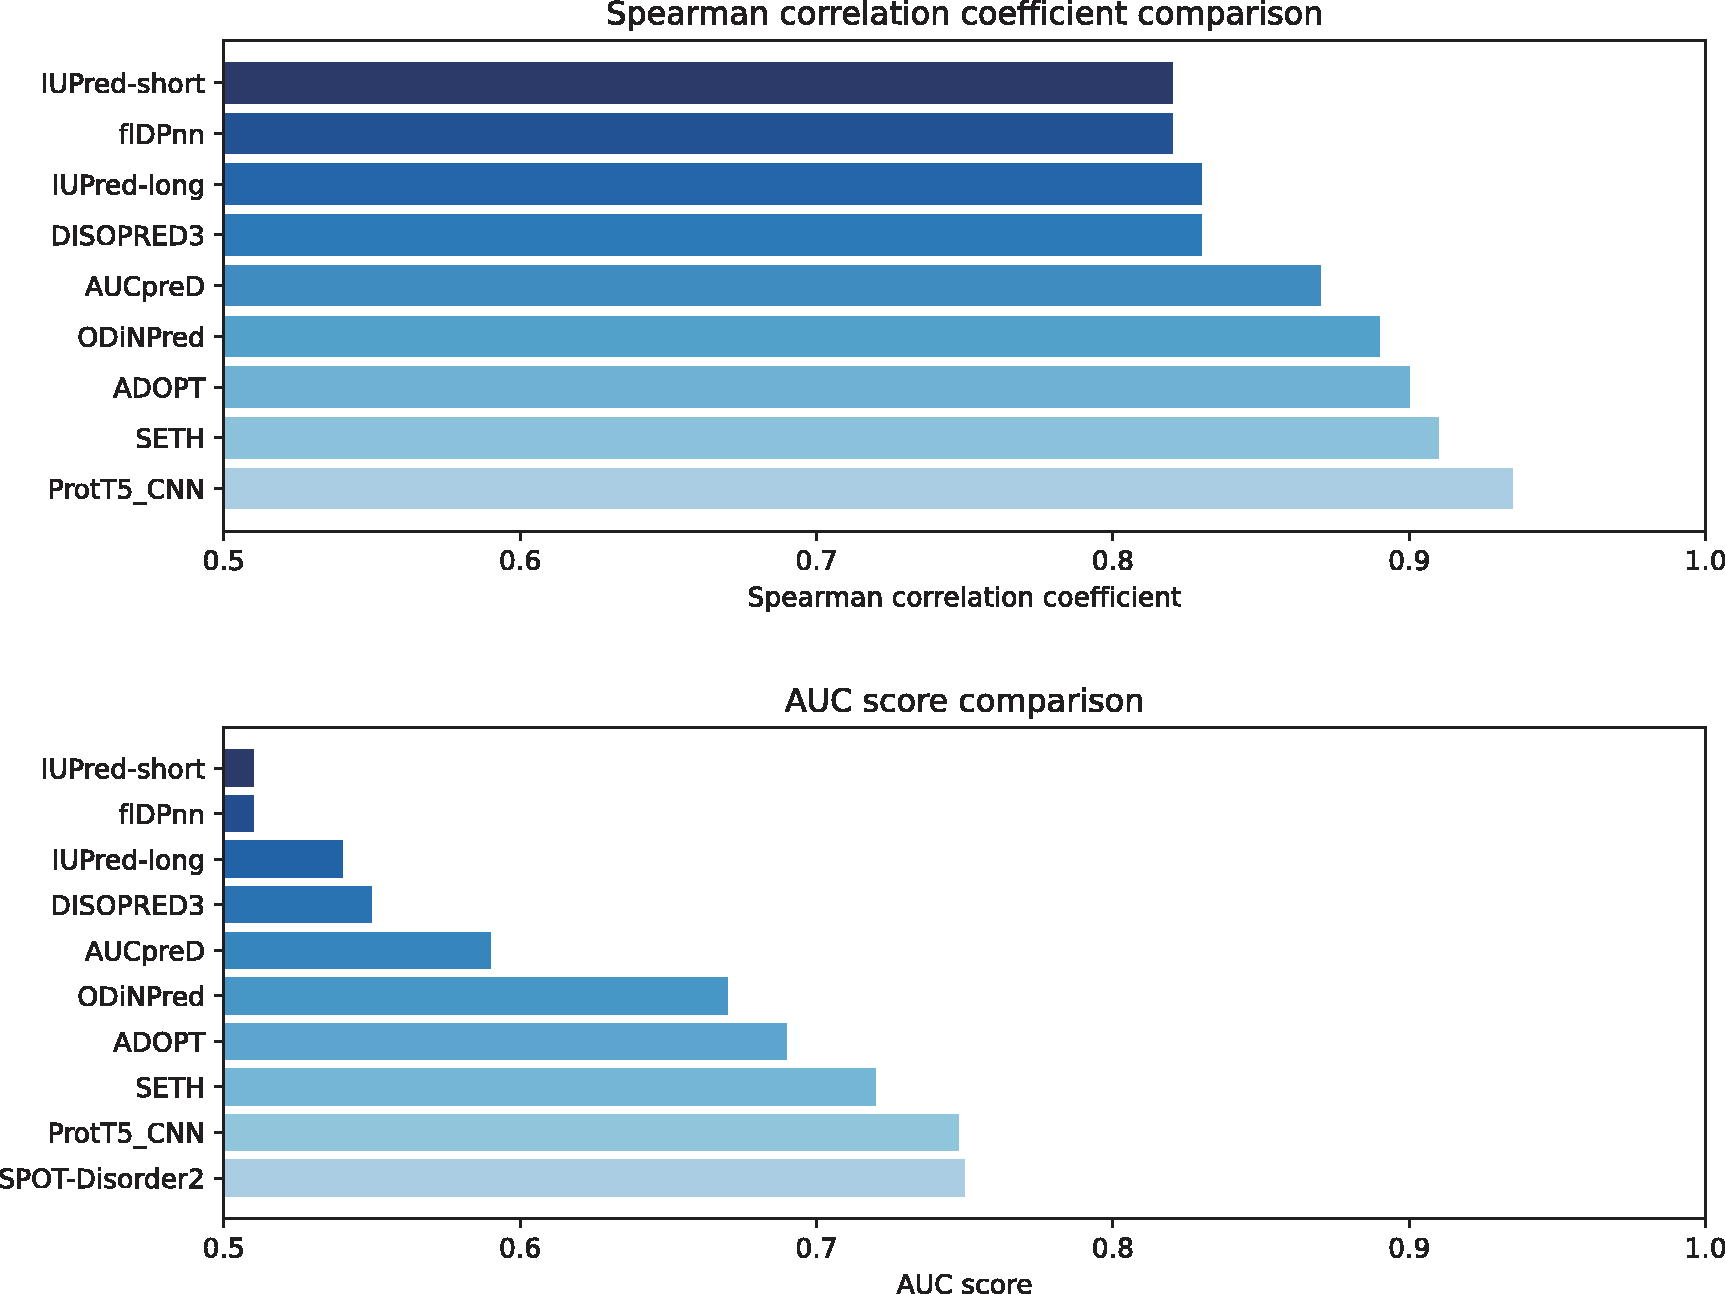
Comparative AUC score assessment of various disorder predictors against PDFll on the CheZod117 dataset. The horizontal bar chart ranks the predictors based on their AUC scores, providing a clear visual of each predictor’s performance, with PDFll serving as a baseline for comparison. This graph offers insights into the relative predictive strengths of the evaluated predictors in the context of disorder prediction. AUC, Area Under the Curve; PDFll, Predictors of Disorder and Function of proteins from the Language of Life.
These results collectively affirm the efficacy of PDFll, particularly when leveraging advanced pLMs like ProtT5 in conjunction with CNN architectures, in accurately predicting protein disorder. This performance benchmark not only establishes PDFll as a leading tool in the field but also highlights the potential of integrating pLMs into protein disorder prediction models.
We also employed P53 as a case study to illustrate the performance of our model. As depicted in Figure 6, P53 comprises 393 amino acids, with residues 1–92 being disordered, 93–290 ordered, 291–312 disordered, 313–360 ordered, and 361–393 disordered. The model achieved the following results: TP: 194, FP: 21, TN: 127, and FN: 51. These results indicate that the model can rapidly and accurately identify disordered regions.
PDFll, leveraging pLMs, uniquely offers functional predictions for IDRs. During the development phase, we meticulously trained the models using only annotated IDRs. This strategy was deliberately employed to reduce the likelihood of inaccuracies, thereby ensuring the reliability and precision of PDFll’s functionality assessments.
In Figure 4A, the ROC curves for nucleotide binding predictions are presented. Here, the CNN model employing ProtT5 features exhibits a strong AUC of 0.84, indicating its effectiveness in predicting nucleotide binding sites. The Multilayer Perceptron (MLP) model with ProtT5 features also shows notable performance with an AUC of 0.85. However, the Long Short-Term Memory (LSTM) network with ProtT5 features has a comparatively lower AUC of 0.62. These findings suggest that specific architectures, like CNNs, may be better suited for capturing the complexities involved in nucleotide binding function prediction.
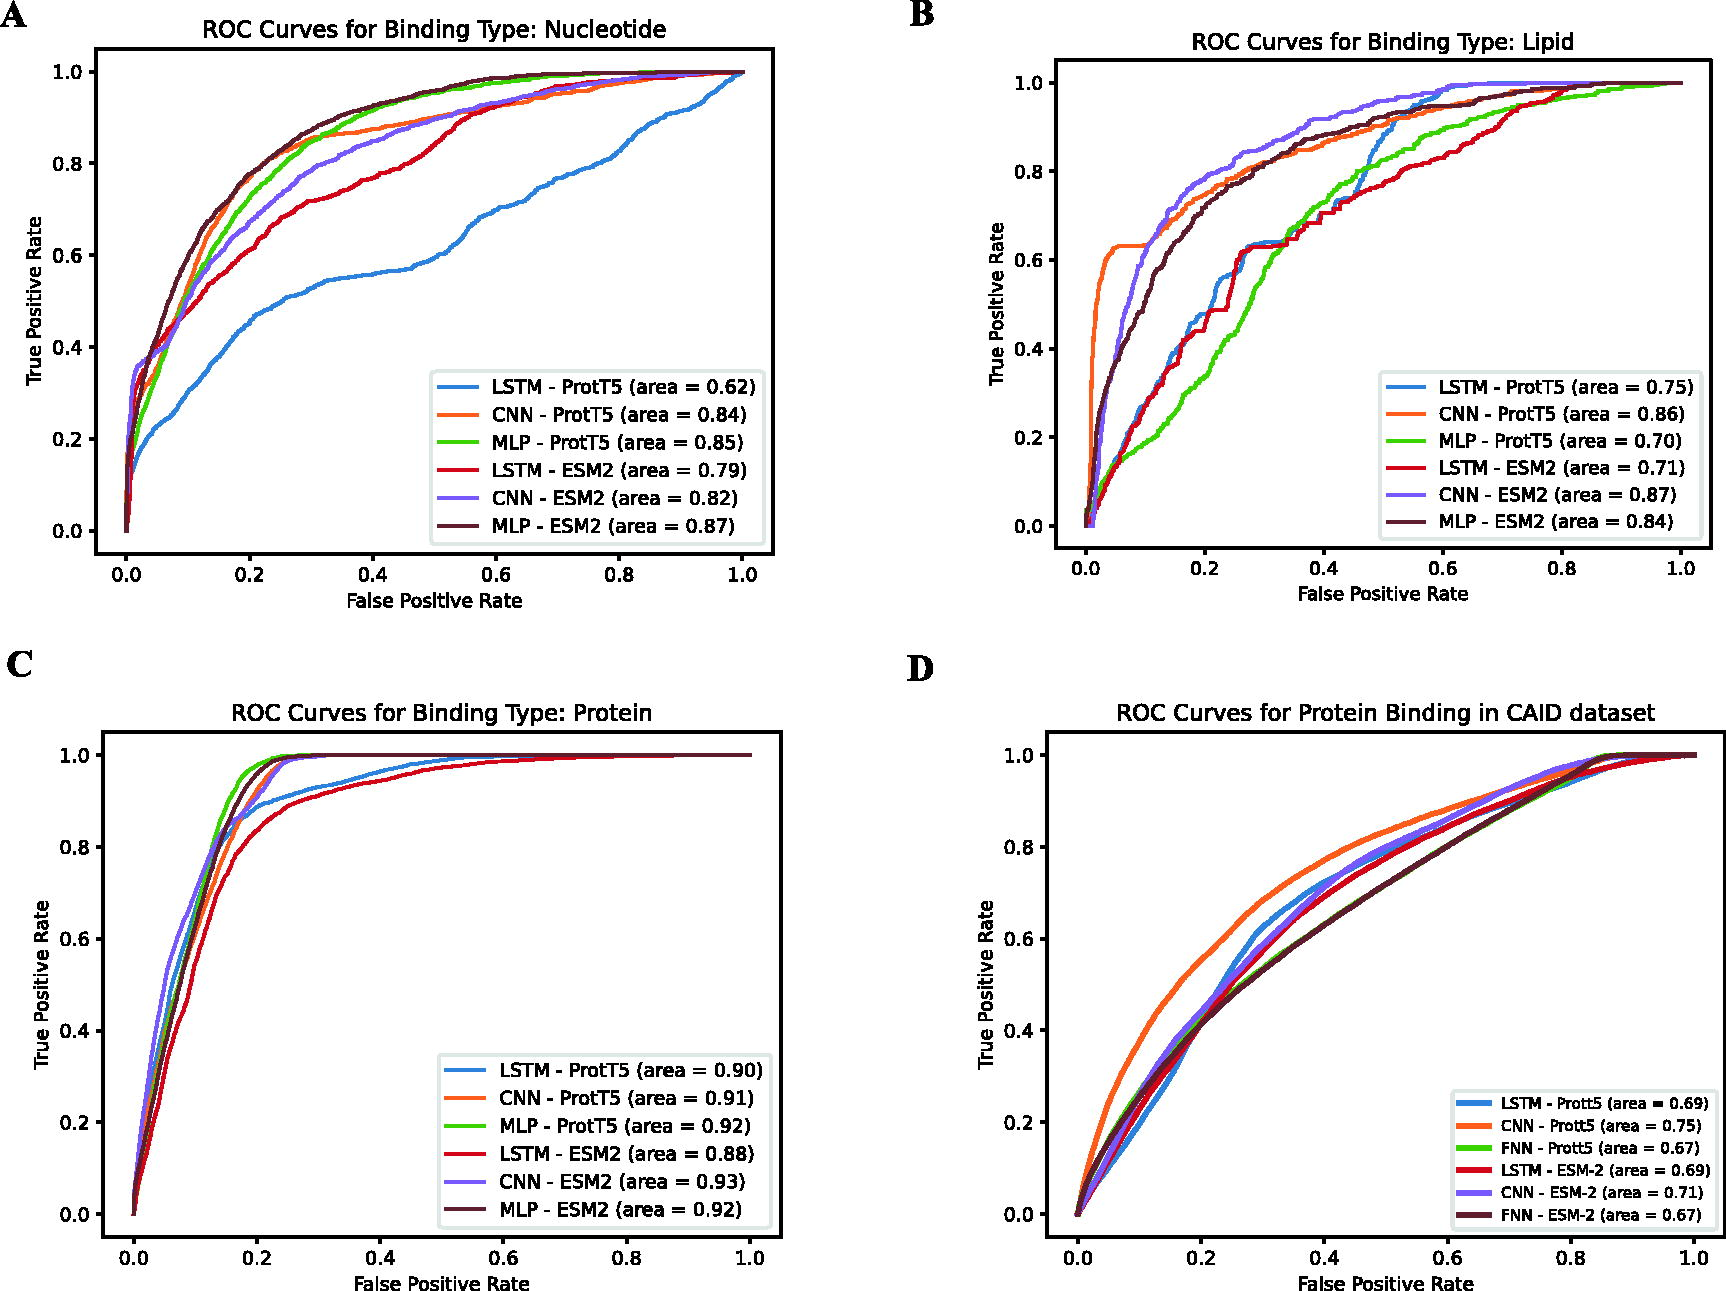
ROC curves illustrating the performance of various machine learning models on the CAID dataset for predicting the functional attributes of IDRs. Subfigure A, B, C detail the predictive performances specifically for nucleotide, lipid and protein binding functions using the Disprot test set, respectively. D dipicts the protein binding functions using the CAID set. Each curve represents a different model and feature set combination, with the AUC metric indicating the accuracy of each model in distinguishing between the binding and non-binding states of IDRs for each function type. AUC, Area Under the Curve; IDRs, intrinsically disordered regions; ROC, Receiver Operating Characteristics.
Regarding lipid binding predictions, illustrated in Figure 4B, the MLP model with ProtT5 features attains an AUC of 0.70, while its performance with ESM2 features significantly improves to an AUC of 0.84. The CNN model with ProtT5 features outperforms the LSTM model, with AUCs of 0.86 and 0.75, respectively. These results emphasize the impact of feature selection on predictive accuracy, with ESM2 features facilitating a more precise identification of lipid binding functions.
The ROC curves, as shown in Figure 4C, reveal the performance of various models in predicting protein binding functions. The MLP utilizing features from ESM2 achieved the highest AUC at 0.93. This result indicates its superior capability in predicting protein binding functions. Similarly, the CNN model, using features from ProtT5, also demonstrated commendable performance, with an AUC of 0.91. These outcomes highlight the significance of advanced feature representations, such as those from ESM2, in enhancing the accuracy of function prediction.
Finally, in Figure 4D, our study includes a comprehensive evaluation of the predictive performance of PDFll’s function predictors using the CAID reference dataset. This assessment was crucial for establishing the efficacy of PDFll in accurately predicting the functions of IDRs. The results from these varied tests underscore PDFll’s robustness and versatility in predicting the functional aspects of IDRs across different binding types, cementing its position as a valuable tool in protein function prediction.
Furthermore, as shown in Figure 5, we undertook a comparative analysis of PDFll’s performance against several state-of-the-art disorder function predictors. This comparison included notable tools such as ANCHOR-2 (Mészáros et al., 2018), DisoRDPbind (Peng et al., 2006), AUCpreD (Wang et al., 2016), MoRFChib (light and web) (Malhis et al., 2016), and OPAL (Sharma et al., 2018). Our aim was to contextualize PDFll’s capabilities in relation to these established predictors. Remarkably, the function predictions generated by PDFll, which do not incorporate evolutionary information, exhibited a level of quality on par with that of the current leading predictors, as quantified by key metrics such as the AUC, F1-score, and MCC. This finding is significant as it underscores PDFll’s proficiency in function prediction, a domain often challenging due to the complex nature of IDRs and their diverse roles in biological processes.
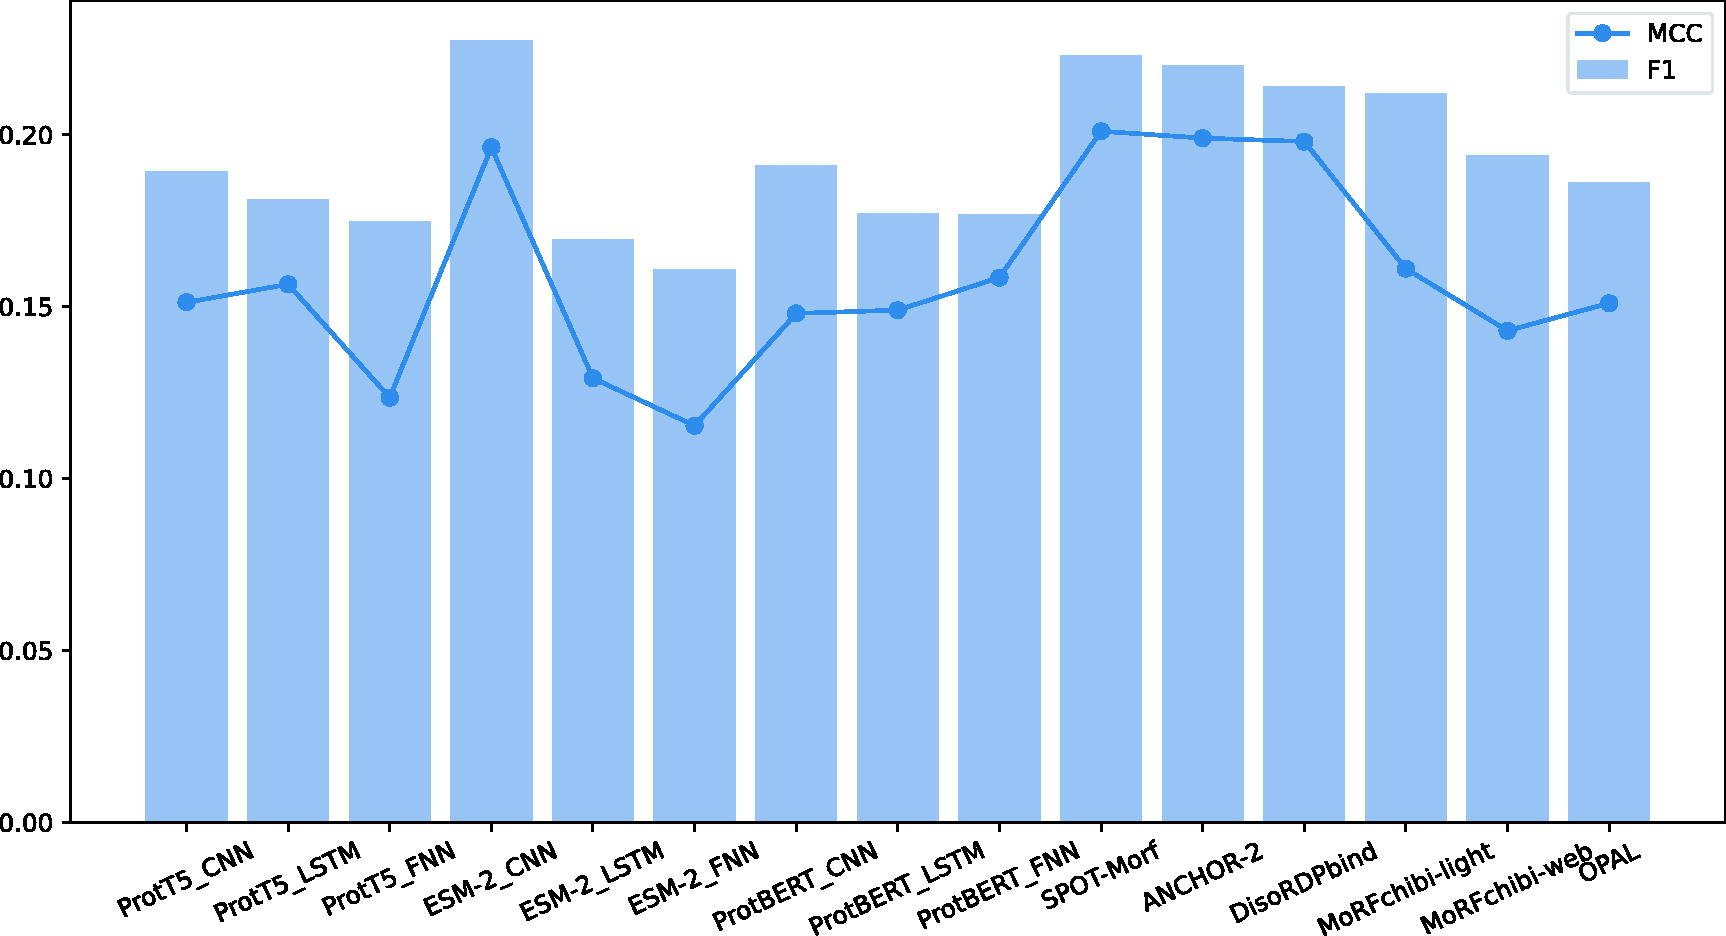
Comparative analysis of predictive performance between PDFll function part and other disorder predictors across various models and feature representations. The bar chart and line graph display the MCC and F1 score metrics, respectively, for each model. This comparison highlights the efficacy of PDFll in the context of different machine learning approaches and the potential advantages of specific feature sets in disorder prediction. The diversity of models includes CNN, LSTM, and others, with features such as ProtT5 and ESM2, as well as comparisons to established disorder predictors like Anchor2, Disopred, and MobiDB-lite. CNN, Convolutional Neural Network; MCC, Matthews Correlation Coefficient; ESM2, Evolutionary Scale Modeling 2; LSTM, Long Short-Term Memory Model; PDFll, Predictors of Disorder and Function of proteins from the Language of Life.

Predicted z-score for P53 with state background. The orange line represents the predicted z-scores for each residue index of the P53 protein. The dashed black line indicates the cut-off value (z-score of 8.0) used to differentiate between ordered and disordered states. Regions shaded in blue correspond to ordered residues, while regions shaded in gray represent disordered residues.
The performance comparison of different methods based on large language models is summarized in Table 1. The table shows the AUC-ROC and MCC for three models: ProtT5_CNN, LMDisorder, and IDP-LM. ProtT5_CNN demonstrated the highest performance with an AUC-ROC of 0.935 and an MCC of 0.721, followed by LMDisorder with an AUC-ROC of 0.912 and an MCC of 0.678, and IDP-LM with an AUC-ROC of 0.845 and an MCC of 0.512. These results highlight the superior performance of ProtT5_CNN in predicting disordered regions.
The Comparison of Performance of Different Methods Based on Large Language Models
The ability of PDFll to achieve comparable accuracy with existing tools, despite not utilizing evolutionary information, highlights the effectiveness of the underlying pLMs and the robustness of the prediction algorithms used. This result not only validates the approach adopted in PDFll but also contributes to the ongoing efforts in enhancing the predictive accuracy of IDR functions in the field of bioinformatics.
PDFll, our newly developed series of sequence-based predictors, marks a significant advancement in the field of protein research, particularly in assessing protein disorder and associated functions. At the heart of PDFll’s effectiveness are the pLMs, which excel in generating detailed residue-level representations of protein sequences. These representations serve as the foundation for our predictive models, offering a novel approach to protein sequence analysis.
During our evaluation process, we rigorously tested PDFll using the CheZod117 dataset, known for its independence and low sequence similarity. This evaluation revealed that PDFll not only competes with but also surpasses previous state-of-the-art predictors in the realm of protein disorder identification. Furthermore, PDFll’s function predictors demonstrated strong performance on the CAID reference dataset. It’s particularly noteworthy that this high level of predictive accuracy is achieved without incorporating evolutionary information, which is typically a critical element in similar predictive models.
A key advantage of PDFll is its reliance on the sophisticated learning capabilities of pLMs. This approach effectively obviates the need for additional feature engineering or the selection of specific biophysical inputs, streamlining the predictive process. The advanced capabilities of pLMs ensure that PDFll maintains, and often enhances, the accuracy of predictions without the complexities of traditional feature selection.
However, it is important to note a crucial aspect of our study, particularly in the context of function prediction: the scarcity of data. Data for functional predictions, especially those pertaining to nucleic acid and lipid binding, are notably limited. This scarcity poses significant challenges, as the breadth and diversity of the available data directly impact the robustness and generalizability of our predictive models. The limited data for nucleic acid and lipid binding functions mean that our predictions in these areas are based on a narrower dataset compared to protein binding functions. This limitation underscores the need for more comprehensive data collection in these specific areas of protein function.
In summary, while PDFll sets a new benchmark in protein sequence analysis and opens avenues for future research, the scarcity of data, particularly in nucleic acid and lipid binding function predictions, remains a challenge that needs addressing. This gap highlights an area for future data collection and research efforts, which could further enhance the capabilities and applicability of predictive models like PDFll in the ever-evolving landscape of protein research.
Footnotes
ACKNOWLEDGMENT
The authors gratefully acknowledge the contributions of our colleagues, collaborators, and participants, whose insights and efforts have significantly enriched this research.
AUTHORS’ CONTRIBUTIONS
W.Y.: Conceptualization, writing—original draft, review and editing. Q.D. and X.Z.: Project administration, resources (supporting role). C.W. and J.B.: Review the draft.
AUTHOR DISCLOSURE STATEMENT
The authors declare that they have no competing interests.
FUNDING INFORMATION
This research did not receive any grant.