
Abstract
Clonal lineage inference (“tumor phylogenetics”) has become a crucial tool for making sense of somatic evolution processes that underlie cancer development and are increasingly recognized as part of normal tissue growth and aging. The inference of clonal lineage trees from single-cell sequence data offers particular promise for revealing processes of somatic evolution in unprecedented detail. However, most such tools are based on fairly restrictive models of the types of mutation events observed in somatic evolution and of the processes by which they develop. The present work seeks to enhance the power and versatility of tools for single-cell lineage reconstruction by making more comprehensive use of the range of molecular variant types by which tumors evolve. We introduce Sc-TUSV-ext, an integer linear programming-based tumor phylogeny reconstruction method that, for the first time, integrates single nucleotide variants, copy number alterations, and structural variations into clonal lineage reconstruction from single-cell DNA sequencing data. We show on synthetic data that accounting for these variant types collectively leads to improved accuracy in clonal lineage reconstruction relative to prior methods that consider only subsets of the variant types. We further demonstrate the effectiveness of real data in resolving clonal evolution in the presence of multiple variant types, providing a path toward more comprehensive insight into how various forms of somatic mutability collectively shape tissue development.
INTRODUCTION
Somatic evolution, in which cell populations in a tissue accumulate mutations over time, is increasingly recognized as both widespread and important to health and disease (Martincorena and Campbell, 2015). This process has traditionally been most intensively studied due to its role in cancer. Cancer develops through an evolutionary process in which an initially healthy somatic cell population accumulates mutations over a series of generations, creating genetic diversity from which fitter, more aggressive cell subpopulations (subclonal populations) expand, leading to tumorigenesis and tumor progression (Nowell, 1976). Cancers are typically characterized by high rates of mutability and acquisition of diverse forms of mutations, including single nucleotide variants (SNVs), copy number alterations (CNAs), and structural variations (SVs) (Song et al., 2014). More recent studies show that somatic mutability is a constant process in healthy tissues, of which cancer is just one possible endpoint (Martincorena and Campbell, 2015), and that similar mutation landscapes play roles in other common diseases, such as neurodegenerative illnesses (Miller et al., 2021).
Recognition of the importance of somatic evolution in cancers led to the widespread interest in characterizing the evolutionary histories of subclonal populations as a way of understanding mechanisms of disease progression as well as providing guidance toward patient-specific treatment plans (Burrell et al., 2013). This has commonly taken the form of computational inference of clonal lineage trees—generally known as tumor phylogenies (Beerenwinkel et al., 2015; Schwartz and Schäffer, 2017). In these approaches, the evolutionary history of the subclonal populations is modeled as a phylogenetic tree, whose nodes represent the major genetically similar subpopulations in a tumor (subclones) and whose edges represent the accumulation of somatic mutations that occur along the way from the parent to the child. The root of the tree usually represents a putatively healthy common ancestor of all subclones, which has no mutations. Many of the current tumor phylogeny reconstruction methods use bulk DNA sequencing (DNA-seq) data collected from short reads of mixtures of cells (Deshwar et al., 2015; Eaton et al., 2018; Fu et al., 2022), which are deconvolved to infer the distinct clonal subpopulations and their frequencies (Schwartz and Shackney, 2010). While methods for bulk data remain important, the relatively low precision of this deconvolution process has led the attention of the field to shift in large part to phylogeny inference from single-cell DNA sequencing (scDNA-seq) data (Navin et al., 2011), which allows one to develop tumor phylogeny methods bypassing the deconvolution step (Zafar et al., 2018). scDNA-seq brings its own challenges, however, including typically high rates of allelic dropout, false positives, and false negatives due to the lower resolution of the technology (Gawad et al., 2016). While single-cell phylogenetics is, in principle, a simpler problem than deconvolutional phylogenetics, it is challenging in practice to develop methods robust to scDNA-seq data artifacts.
In part because of this, single-cell tumor phylogeny methods have lagged behind bulk methods in the sophistication of the evolutionary models they apply. While the earliest methods for single-cell tumor phylogenetics focused primarily or exclusively on CNAs, which could be inferred more robustly from lossy data (Davis and Navin, 2016; Navin et al., 2011; Subramanian and Schwartz, 2015), much subsequent work exclusively relied on SNVs and often with restrictive models of their production. The most commonly used such model for SNVs is the infinite sites model (or perfect phylogeny model), where a mutation can only be gained once and never lost along all the edges of the tree. This model is known to be frequently violated in practice (Kuipers et al., 2017) but is also algorithmically convenient (Gusfield, 1991). SCITE (Jahn et al., 2016) and BSCITE (Malikic et al., 2019a) use this model for the phylogeny inference with SNVs. The perfect phylogeny assumption is relaxed in the Dollo or k-Dollo parsimony model, where a mutation can be gained once as before but lost multiple or at most k times, respectively, on which SPhyR (El-Kebir, 2018), SASC (Ali et al., 2021), ConDoR (Sashittal et al., 2023) are built. SCARLET (Satas et al., 2020) improves on the previous methods using a loss-supported model with the combination of Dollo and infinite sites assumptions, incorporating both CNAs and SNVs and requires the copy number (CN) profiles and the CN phylogeny as input or traverses over all possible trees. Recent methods such as BiTSC2 (Chen et al., 2022), SCsnvcna (Zhang et al., 2022), and COMPASS (Sollier et al., 2023) jointly infer tumor phylogenies from SNV and CNA from high-coverage single-cell sequencing data. BiTSC2 is the first method to jointly infer SNV and CNA phylogenies; however, it assumes in the absence of CN events, the coverage is uniform across the genome, which may not be a fair assumption for current high-coverage single-cell sequencing technologies. COMPASS uses a maximum likelihood model with Markov Chain Monte Carlo sampling and is designed for high-coverage targeted sequencing data. Additionally, it abstracts CN evolution in terms of discrete events of CN gain, loss, and loss of heterozygosity events, instead of directly modeling copy-numbers. In the aforementioned models, a mutation can be gained only once. However, in cancer, parallel evolution is a common event where a mutation can be gained independently in different branches of the tree. SiFit (Zafar et al., 2017) further relaxes the assumptions of the Dollo model and allows a mutation to be gained multiple times using the finite sites model. A handful of methods exist to combine bulk and single-cell data, including SNV-centric methods like BSCITE and PhiSCS (Malikic et al., 2019b) and the CNA-centric methods such as Lei et al. (2020) and MEDICC2 (Kaufmann et al., 2022). While these single-cell tumor phylogeny methods account for CNAs and SNVs, there is no such model for single cells to our knowledge that uses SVs arising from chromosomal instability (CIN), which are often a primary driving force in cancer progression (Li et al., 2020). This is a particularly troublesome gap in methods, because scDNA-seq provides a unique window into these SV processes at the single-cell level that is unavailable to other more easily accessible sequencing methods.
Here, we introduce the first single-cell tumor phylogeny method, Sc-TUSV-ext, which was developed to provide more accurate and comprehensive single-cell clonal lineage models by performing tree inference using SNVs, CNAs, and SVs simultaneously. The work makes use of ideas previously developed for the bulk sequence methods TUSV (Eaton et al., 2018), which first brought SVs to deconvolutional tree inference; and TUSV-ext (Fu et al., 2022), which first brought SNVs, CNAs, and SVs together to infer tumor phylogenies from bulk sequencing data. Sc-TUSV-ext uses two-stage approach: (1) perform clustering of the single cells using L1 distances of the variants and K-means clustering and (2) extend the integer linear programming (ILP) frameworks of TUSV (Eaton et al., 2018) and TUSV-ext (Fu et al., 2022) to infer lineage trees constrained to Dollo parsimony models of SNVs and SVs while approximately minimizing CNA evolution. We show through application to synthetic data and comparison to alternative tools that the more comprehensive Sc-TUSV-ext variant model yields improved accuracy across a variety of mutation parameters and performance measures. We further show it to work effectively on real data and reveal novel insights unavailable to any alternative methods.
METHODS
The goal of our method is to identify single-cell lineage trees from a collection of single-cell genetic variant calls while accounting for SVs, SNVs, and CNAs. Figure 1 gives an overview of the analysis pipeline of Sc-TUSV-ext. At a high level, the method works by first clustering single cells into putative clones, using the variants to cluster by their L1 distances, and subsequently inferring clonal lineage trees (“tumor phylogenies”) for the clones using a model based on the bulk data method TUSV-ext (Fu et al., 2022) that seeks trees consistent with a Dollo parsimony model of SNVs and SVs so as to minimize an objective balancing minimum CN distance and consistency of CN calls across SV breakpoints. Each SNV is represented by a position in the genome and its estimated CN. We represent each SV as a pair of breakpoints that are found adjacent to each other at the cancer genome but non-adjacent in the reference genome. For example, a pair of breakpoints[9:129917912] and [20:33432705] would mean that in the cancer genome, the segment of the reference genome’s chromosome 9, position 129917912 extending to the left is found adjacent to the segment of the reference genome’s chromosome 20 position 33432705 extending to the right. CNAs are handled by treating the genome as discretized into bins (segments), each of which is assigned a CN for each single cell or cell cluster. To relate SVs with CNAs, we assume that the CN of a breakpoint will be less than or equal to that of the segmental CNA containing it (Eaton et al., 2018).
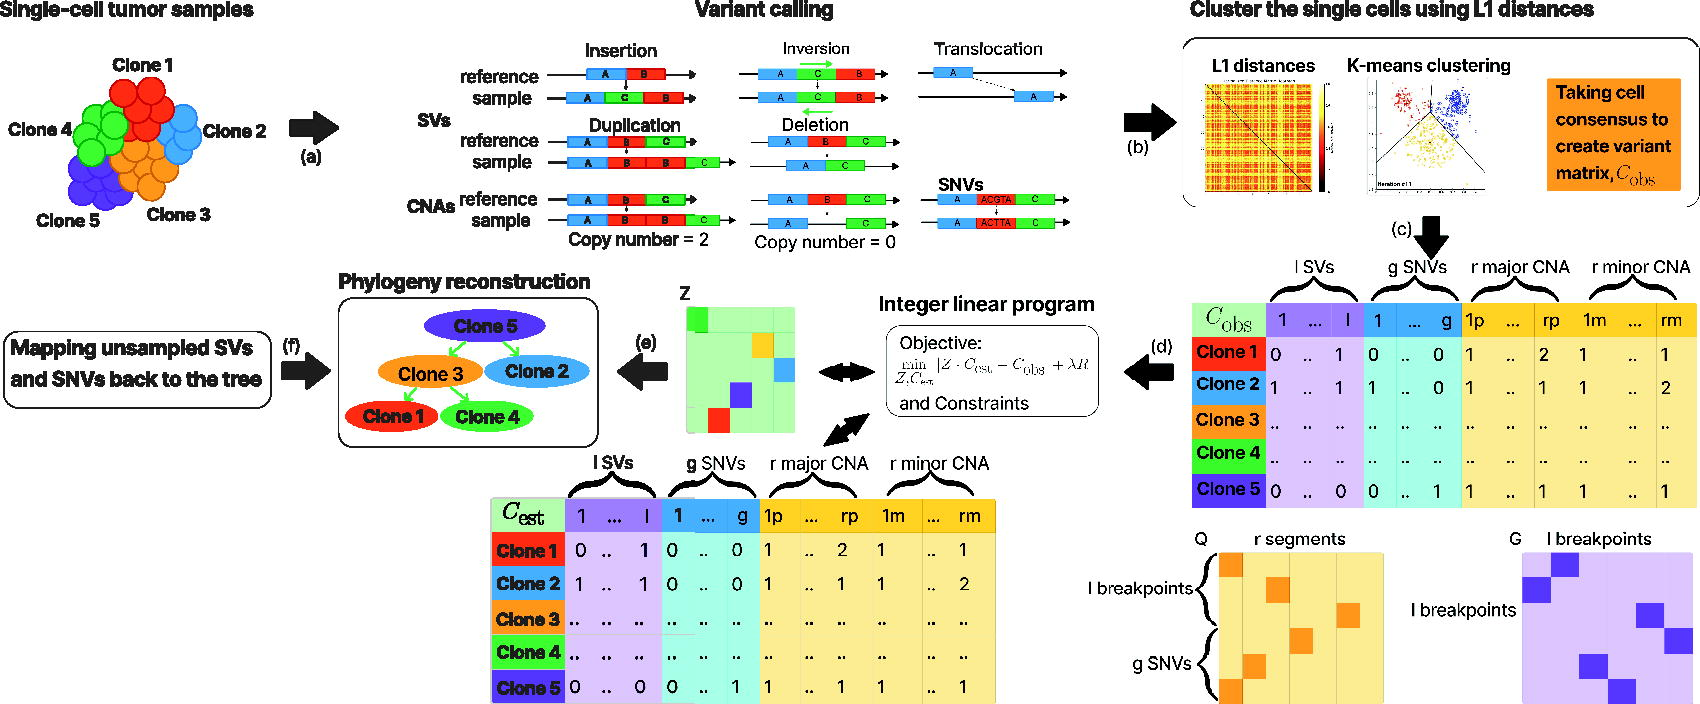
Schematic diagram of the Sc-TUSV-ext method.
The inputs to Sc-TUSV-ext are processed variant calls of the single cells where we represent SVs with segmental mean CNs of paired breakpoint ends, CNAs with allele-specific mean CN for a set of discrete genomic segments, and SNVs with estimated mean CNs. Given the processed variant calls for the single cells, we first group
The output of Sc-TUSV-ext is the best tree
We begin by calculating the L1 distances across all variants from single-cell DNA-seq data, which produces a
Coordinate descent algorithm
The bulk of the method is dedicated to solving for a constrained optimization problem, detailed in the subsequent sections. The method is adapted from the earlier TUSV-ext method for building SNV/CNA/SV phylogenies from bulk DNA-seq data (Fu et al., 2022), itself extended from the earlier CNA/SV TUSV method (Eaton et al., 2018). We describe the full program below but with an emphasis on areas in which Sc-TUSV-ext differs from bulk TUSV-ext.
Our objective function is quadratic and in practice not solvable to optimality within a reasonable time. To resolve this, we follow the earlier TUSV and TUSV-ext in optimizing using a coordinate descent algorithm that poses the problem as two mixed integer linear programs between which we iterate. We solve for
Estimating
and
est
Our aim in this step is to assign one clone to each node of the phylogenetic tree. To achieve this, we set the constraints on
We use these equations to estimate
Phylogenetic and ancestry constraints
As the CN profiles of the aggregated clones are associated with an underlying phylogenetic tree, we impose phylogenetic constraints on the rows of the
Root has no incoming edges (Equation 8) and leaves have no outgoing edges (Equation 9).
Every node that is not a root has exactly one incoming edge (Equation 10) and every internal node has two outgoing edges (Equation 11).
The root is the ancestor of all other nodes (Equation 12), and the root has no ancestor (Equation 13).
Any node’s parent is its ancestor.
Any child node carries its parent’s ancestors.
Similar to TUSV-ext (Fu et al., 2022), we first impose some constraints on allowed CNs. We assume that the root is bi-allelic and has one copy of each segment, no SNVs, and no breakpoints. We also bound the CN of each segment to a maximum,
We next model the phylogenetic tree cost as the sum of pairwise L1 distances of the CNs across all edges of the tree, which provides an approximate measure of evolutionary distance suitable for prioritizing among otherwise feasible trees. To define this measure as a linear function of the variables, we follow TUSV-ext in defining two collections of temporary variables
We add the two auxiliary variables for all segments to get the CN cost,
Similar to TUSV (Eaton et al., 2018) and TUSV-ext (Fu et al., 2022), we impose a Dollo phylogeny constraint on SNVs and SVs. For SVs, we require that each breakpoint appears exactly once across one edge of the tree and ensure that a pair of breakpoints appears on a common edge of the tree. We impose these constraints using another binary auxiliary variable,
SNVs are treated as a degenerate case of SVs, effectively two breakpoints occupying the same genomic position and also constrained to appear once in the tree. Both kinds of variants can be lost due to deletion concurrent with CN losses, however, and thus obey Dollo (one appearance but potentially multiple loss) rather than perfect phylogeny (one appearance without loss) constraints. In a similar manner, we assume that a duplication of an SNV or SV is associated with the duplication of its corresponding segment. We impose additional constraints to ensure these assumptions. We constrain that the CN change due to any SNV or SV breakpoint should be at most the CN change of the segment corresponding to the SNV or SV breakpoint, following the work of TUSV-ext (Fu et al., 2022).
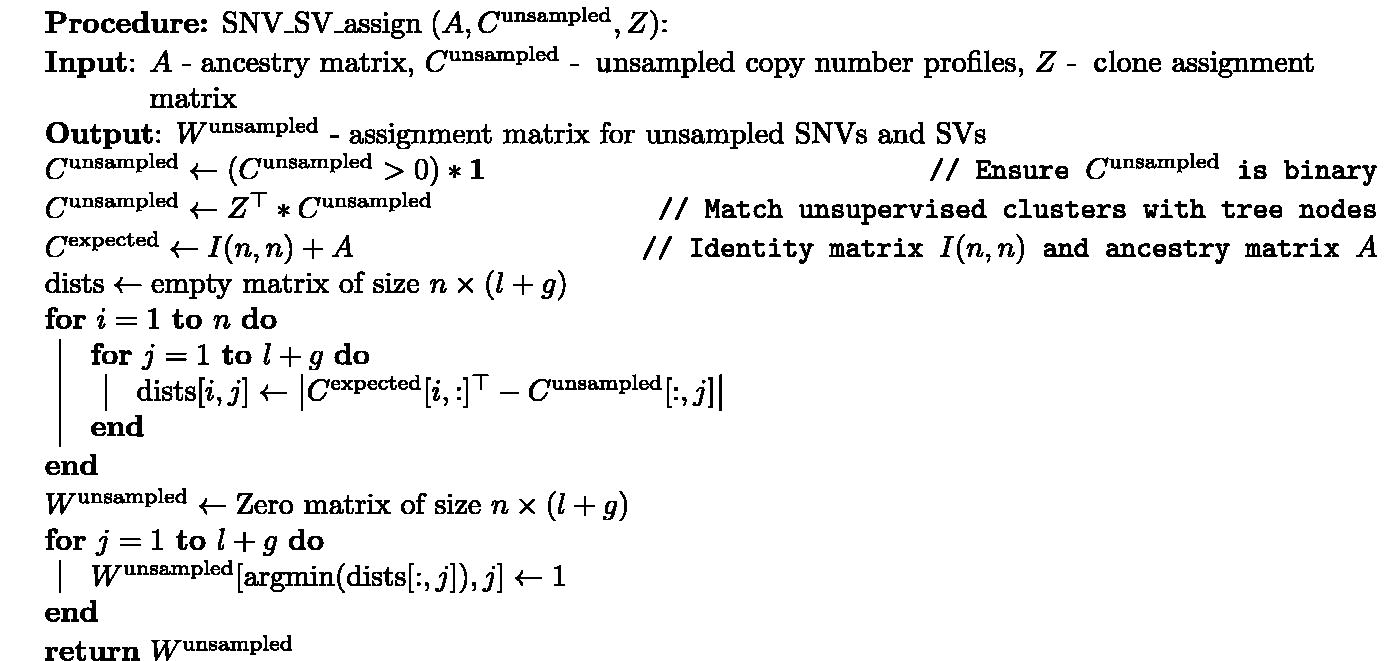
As the ILP can scale poorly for a large number of variants, we apply a heuristic solution of sampling a predefined number of SNVs and pairs of SV breakpoints while keeping all the CNAs, using these to infer the tree topology, and then mapping the unsampled SNVs and SV breakpoints back to the tree. For mapping the unsampled SNVs and SVs, we first create a n × n binary matrix
Choice of λ
We set the regularization parameter
Implementation
We implemented Sc-TUSV-ext in Python with the licensed Gurobi Optimizer for solving the integer linear program. All the codes are available at https://github.com/CMUSchwartzLab/Sc-TUSV-ext.
RESULTS
To establish the effectiveness of Sc-TUSV-ext, we validate it on both simulated and real data and compare it with four other leading methods: SCARLET (Satas et al., 2020), MEDICC2 (Kaufmann et al., 2022), COMPASS (Sollier et al., 2023), and SiFit (Zafar et al., 2017). We note that we cannot fully compare Sc-TUSV-ext directly with the other methods, as to our knowledge no other single-cell tumor phylogeny method can build phylogenies incorporating SNV, CNA, and SV data. Most build phylogenies solely on SNV data, potentially accounting for CNAs as a confounding factor in interpreting SNVs. We thus compare with the other methods by comparing Sc-TUSV-ext’s mapping of SNVs alone to that of SCARLET and COMPASS’s, and Sc-TUSV-ext’s phylogenies with MEDICC2 and SiFit’s. While this gives Sc-TUSV-ext an advantage over the alternatives, in that it is making use of variant types the other methods cannot use, we believe this provides a fair assessment of the value of considering these variant types collectively, which is the major contribution of Sc-TUSV-ext to this space.
Evaluation of simulated data
We validate the accuracy of our method on simulated data with randomly generated single-cell phylogenies labeled by SNV, SV, and CNA mutations. For each simulation, we generate a random binary tree with n nodes along with a CN matrix
To test the robustness of our method, we perform a series of experiments including several model conditions—varying number of clones, number of single cells, number of mutations, and error tolerance. For all the simulations, we applied Sc-TUSV-ext with a maximum computational time of 2000 seconds, 2 iterations, and 4 random restarts. We ran SCARLET with a setting where the true CN tree and true CN profiles for the cells were known—we provided SCARLET with our true simulated phylogeny—and compared the estimated SNVs of SCARLET with Sc-TUSV-ext’s. Additionally, we ran COMPASS with “nodecost” = 0.1 and SiFit with the SNVs from our dataset. We compared MEDICC2, SiFit, and Sc-TUSV-ext’s clonal phylogenies with the true phylogenies using the normalized Robinson Fould (RF) distance (Robinson and Foulds, 1981).
Experiment 1: Validation for different coverage levels
Given the low-coverage levels of typical single-cell DNA-seq, robustness to data error and loss are important criteria for evaluation. We generated read counts using a Poisson distribution with parameter
Figure 2a shows errors in SNV assignments for Sc-TUSV-ext in comparison to SCARLET and COMPASS. The performance of Sc-TUSV-ext was comparable with that of SCARLET. However, since SCARLET was provided with the true phylogenies and true CN profiles, it optimized the placement of mutations on a known tree rather than constructing the phylogeny from scratch, resulting in a lower root mean square error (RMSE). COMPASS, on the other hand, outputs a one-node phylogeny with the default parameters (“nodecost,” “lohcost,” and “cnacost”), resulting in significantly higher RMSE values. We manually tuned these parameters to “nodecost” = 0.1, “lohcost” = 10, and “cnacost” = 10, which improved the accuracy of COMPASS, but the RMSE remained high.
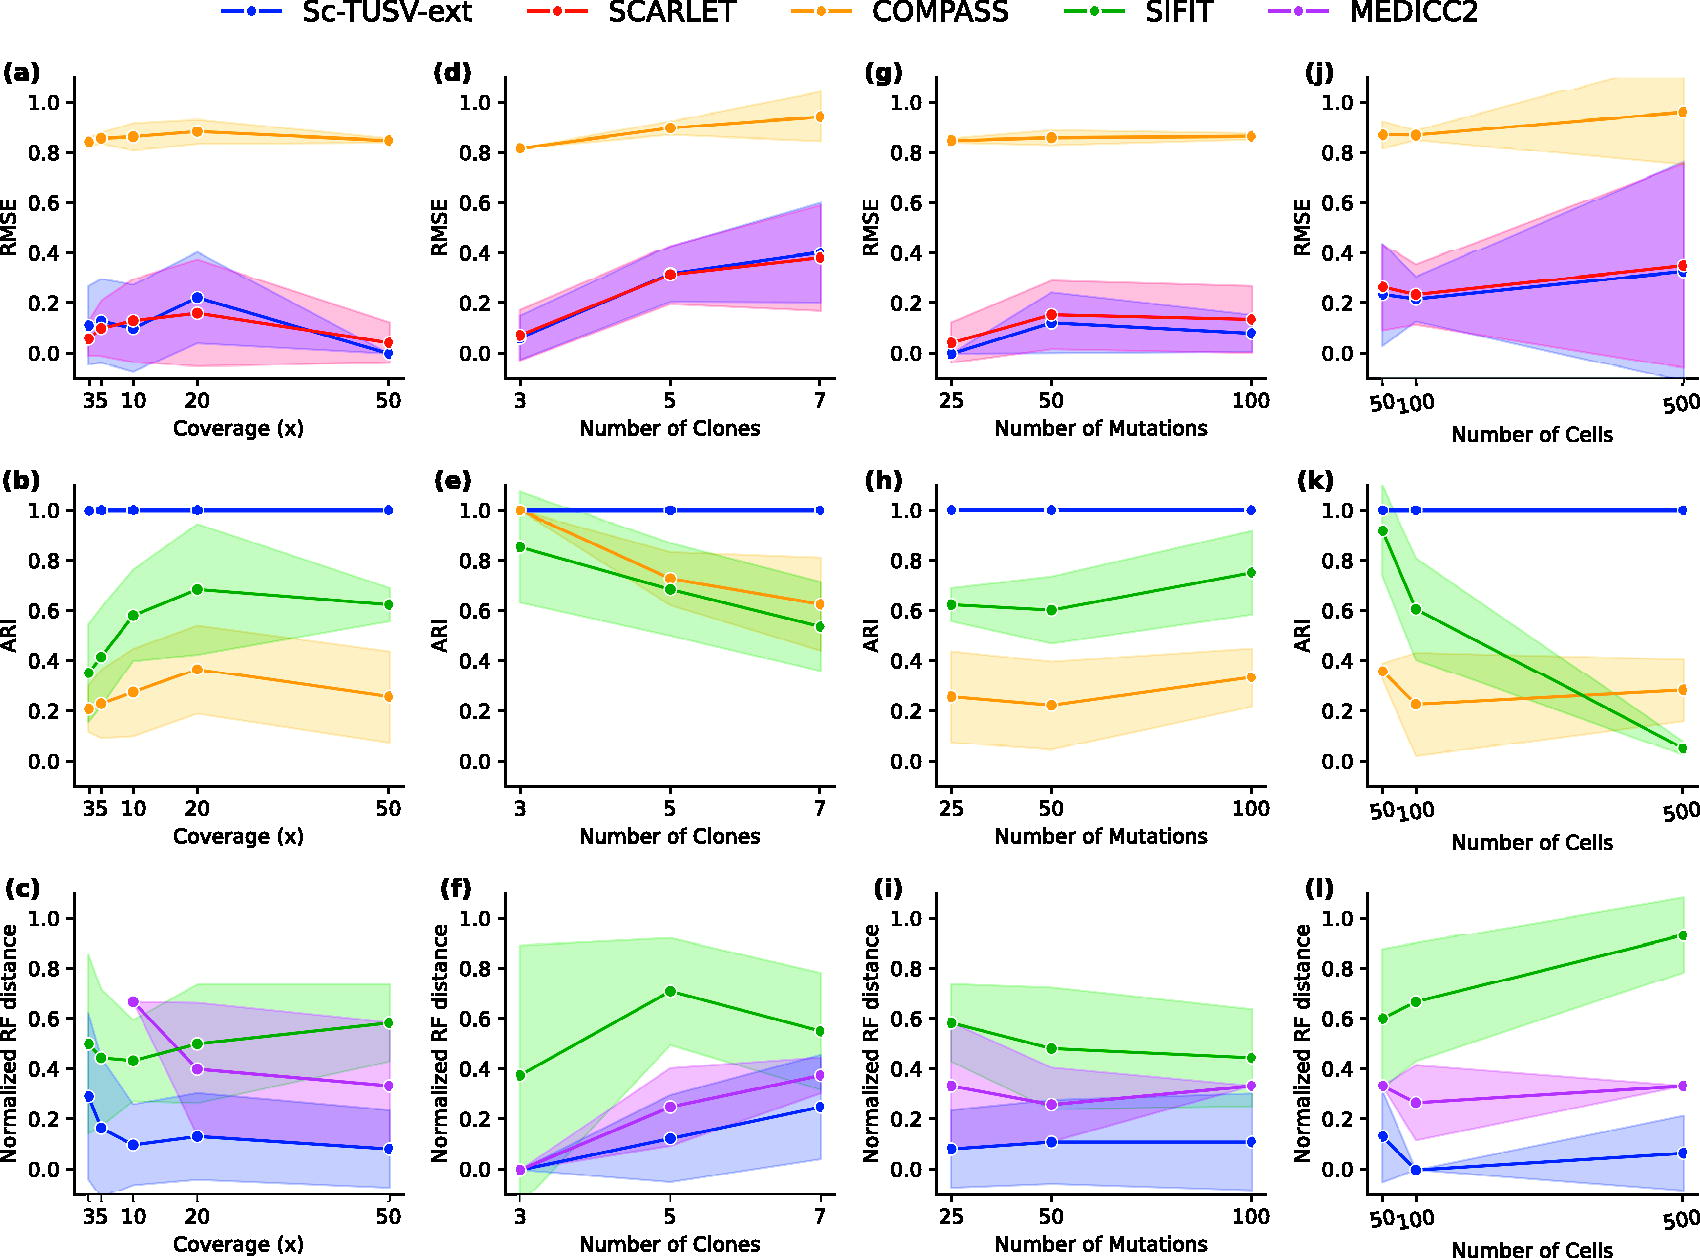
Results on experiments 1, 2, 3, and 4, with different coverages, number of clones, mutations, and single cells.
Figure 2b shows the Adjusted Rand Indexes (ARI) of cell-to-clone assignments for Sc-TUSV-ext, COMPASS, and SiFit. While Sc-TUSV-ext resulted in perfect cell-to-clone assignment (ARI = 1.0) across all coverage levels, COMPASS and SiFit’s cell assignments were highly erroneous, though their performance improved with the coverage level.
Finally, we compared the trees inferred by Sc-TUSV-ext, MEDICC2, and SiFit with the true clonal trees (Fig. 2c). To compare the output single-cell trees of MEDICC2 with the true and Sc-TUSV-ext’s clonal trees, we first substitute single cells in the leaves of MEDICC2 trees with their clone assignments. We then transform Sc-TUSV-ext’s and the true clonal phylogenies to have the clones only in the leaves. We use normalized RF distance (Robinson and Foulds, 1981) of Sc-TUSV-ext, MEDICC2, and SiFit’s phylogenies for different coverage levels. We do not show a result for SCARLET, as we used SCARLET with a setting where the true tree was known. The tree structures of SiFit and MEDICC2 largely differed from the true trees. Note that for coverages of 3× and 5×, we were unable to run MEDICC
We tested our method with 3, 5, and 7 clones. For each case, we ran five simulations with 100 single cells, 100 SNVs, and 600 SV breakpoints, and 3× (Supplementary Fig. S1), and 50× coverage (Fig. 2). We compared the RMSE of our estimated SNVs with SCARLET and COMPASS’s (Fig. 2d). For each case, we ran Sc-TUSV-ext with a subsampling that considers 80 SV breakpoints and 40 SNVs. The results demonstrate that our method can estimate the SNVs as accurately as SCARLET for different number of clonal populations, but the RMSE is slightly worse when the number of clones increases. COMPASS’s results were similar as shown in Section 3.1.1. For each case, we first used L1 distances to cluster the single cells and found the ARI values of the single-cell clusters to be 1 with respect to the true clusters (Fig. 2e). Similar to Section 3.1.1, we noticed higher RF distances with MEDICC2 and SiFit-inferred phylogenies than those of Sc-TUSV-ext (Fig. 2f), but Sc-TUSV-ext’s RF distances increase as we increase the number of clones.
Experiment 3: Validation for different number of mutations
Next, we varied the number of mutations on a 5-clone tree with 100 single cells and 3× (Supplementary Fig. S1) and 50× coverage (Fig. 2). We varied the total number of SNVs,
Experiment 4: Validation for different number of single cells
We next validated the robustness of our method by varying the number of single cells,
For the 3× coverage scenario with 1000 single cells, Sc-TUSV-ext consistently produced accurate phylogenies across all simulation instances. This substantial improvement in low-coverage simulations is attributed to the use of a larger number of cells to generate single-cell clone representatives (Supplementary Fig. S1).
Experiment 5: evaluation of robustness of the subsampling method
To validate the effect of our subsampling method on tree inference, we explored reducing the number of subsampled variants for a fixed input data set. We varied the number of subsampled SVs and SNVs to be
We further validated the robustness of the subsampling method by varying the number of total subsampled SVs and SNVs, keeping the number of subsampled SVs fixed to 80 on a 5-clone simulated datasets with 100 SNVs and 600 SV breakpoints (Fig. 3a). The plot shows that for a fixed number of SVs, adding more SNVs leads to slightly improved accuracy. We then varied the number of subsampled SVs keeping the total number of SVs and SNVs fixed to 120 (Fig. 3b). The plot shows a minor degradation in accuracy as the proportion of SVs rises. The results collectively suggest that there is a modest improvement with increasing numbers of variants sampled, although SNVs are slightly more useful than SVs in promoting accurate inference.

Root mean squared error of the estimated SVs and SNVs on 5-clone, 100 SNV, and 600 SV breakpoint datasets keeping
We applied Sc-TUSV-ext to single-cell DNA sequencing (scDNA-seq) data from a high-grade serous ovarian cancer (HGSC) cohort from Funnell et al. (2022). From the 16 HGSC cases, we chose two representative cases, DG1134 and SA1049, as a demonstration of the performance of our method on real data. For DG1134, there were 133 single cells with structural variants that included fold back inversions (FBI) and, as a result, high CNs. Funnell et al. derived single-cell CNs, SVs, and SNVs using DLP+ (Laks et al., 2019) and used BWA-MEM (Li, 2013) to align DLP+ reads to the hg19 reference genome. To detect SNVs and SVs, pseudo bulk read count libraries were formed. For SNVs, Funnell et al. used an intersection of the SNVs from MutationSeq (probability threshold = 0.9) and Strelka (score >20). For SVs, an intersection of the SVs detected by LUMPY and deStruct was used. CNAs were identified by aggregating reads into 500 kb bins, followed by running HMMCopy to generate integer CN states for each bin. Depending on the number of cells in the dataset, we found hundreds to thousands of SV breakpoints and thousands of SNVs in each patient. We clustered the cells using K-means clustering with L1 distances and hierarchical clustering with MEDICC2 distances and compared the ARI of our clones with the clones reported in the original publication (Funnell et al., 2022) and found ARI = 0.27 for 5 clones for both the clustering methods. Funnell et al. (2022) detected the clones by first using UMAP on per-cell GC-corrected read count profiles, producing a two-dimensional embedding of the cell profiles. Then, HDBSCAN was run on the two-dimensional embedding from UMAP to detect clusters of cells with similar CN profiles. On the other hand, we used MEDICC2 distances and L1 distances to infer the clusters with simple clustering algorithms. MEDICC2 has a maximum threshold for CN ≤ 8. Since both L1 distance and MEDICC2 distances with maximum CN = 8 are more restrictive than GC correction and HDBSCAN, our clustering resulted in a higher discrepancy with the given clustering. We decided to proceed with the clustering from MEDICC2 (Fig. 4). Since there were many more SNVs than CNAs and SVs, we kept all the CNAs and SVs with numbers of SNVs set to at most 120 and mapped all the remaining SNVs to the tree afterward. We ran Sc-TUSV-ext with 5 clones, 5 iterations, 5 random restarts, and 5000 seconds per iteration on the initial data with 500 Kbp bins for CNAs.
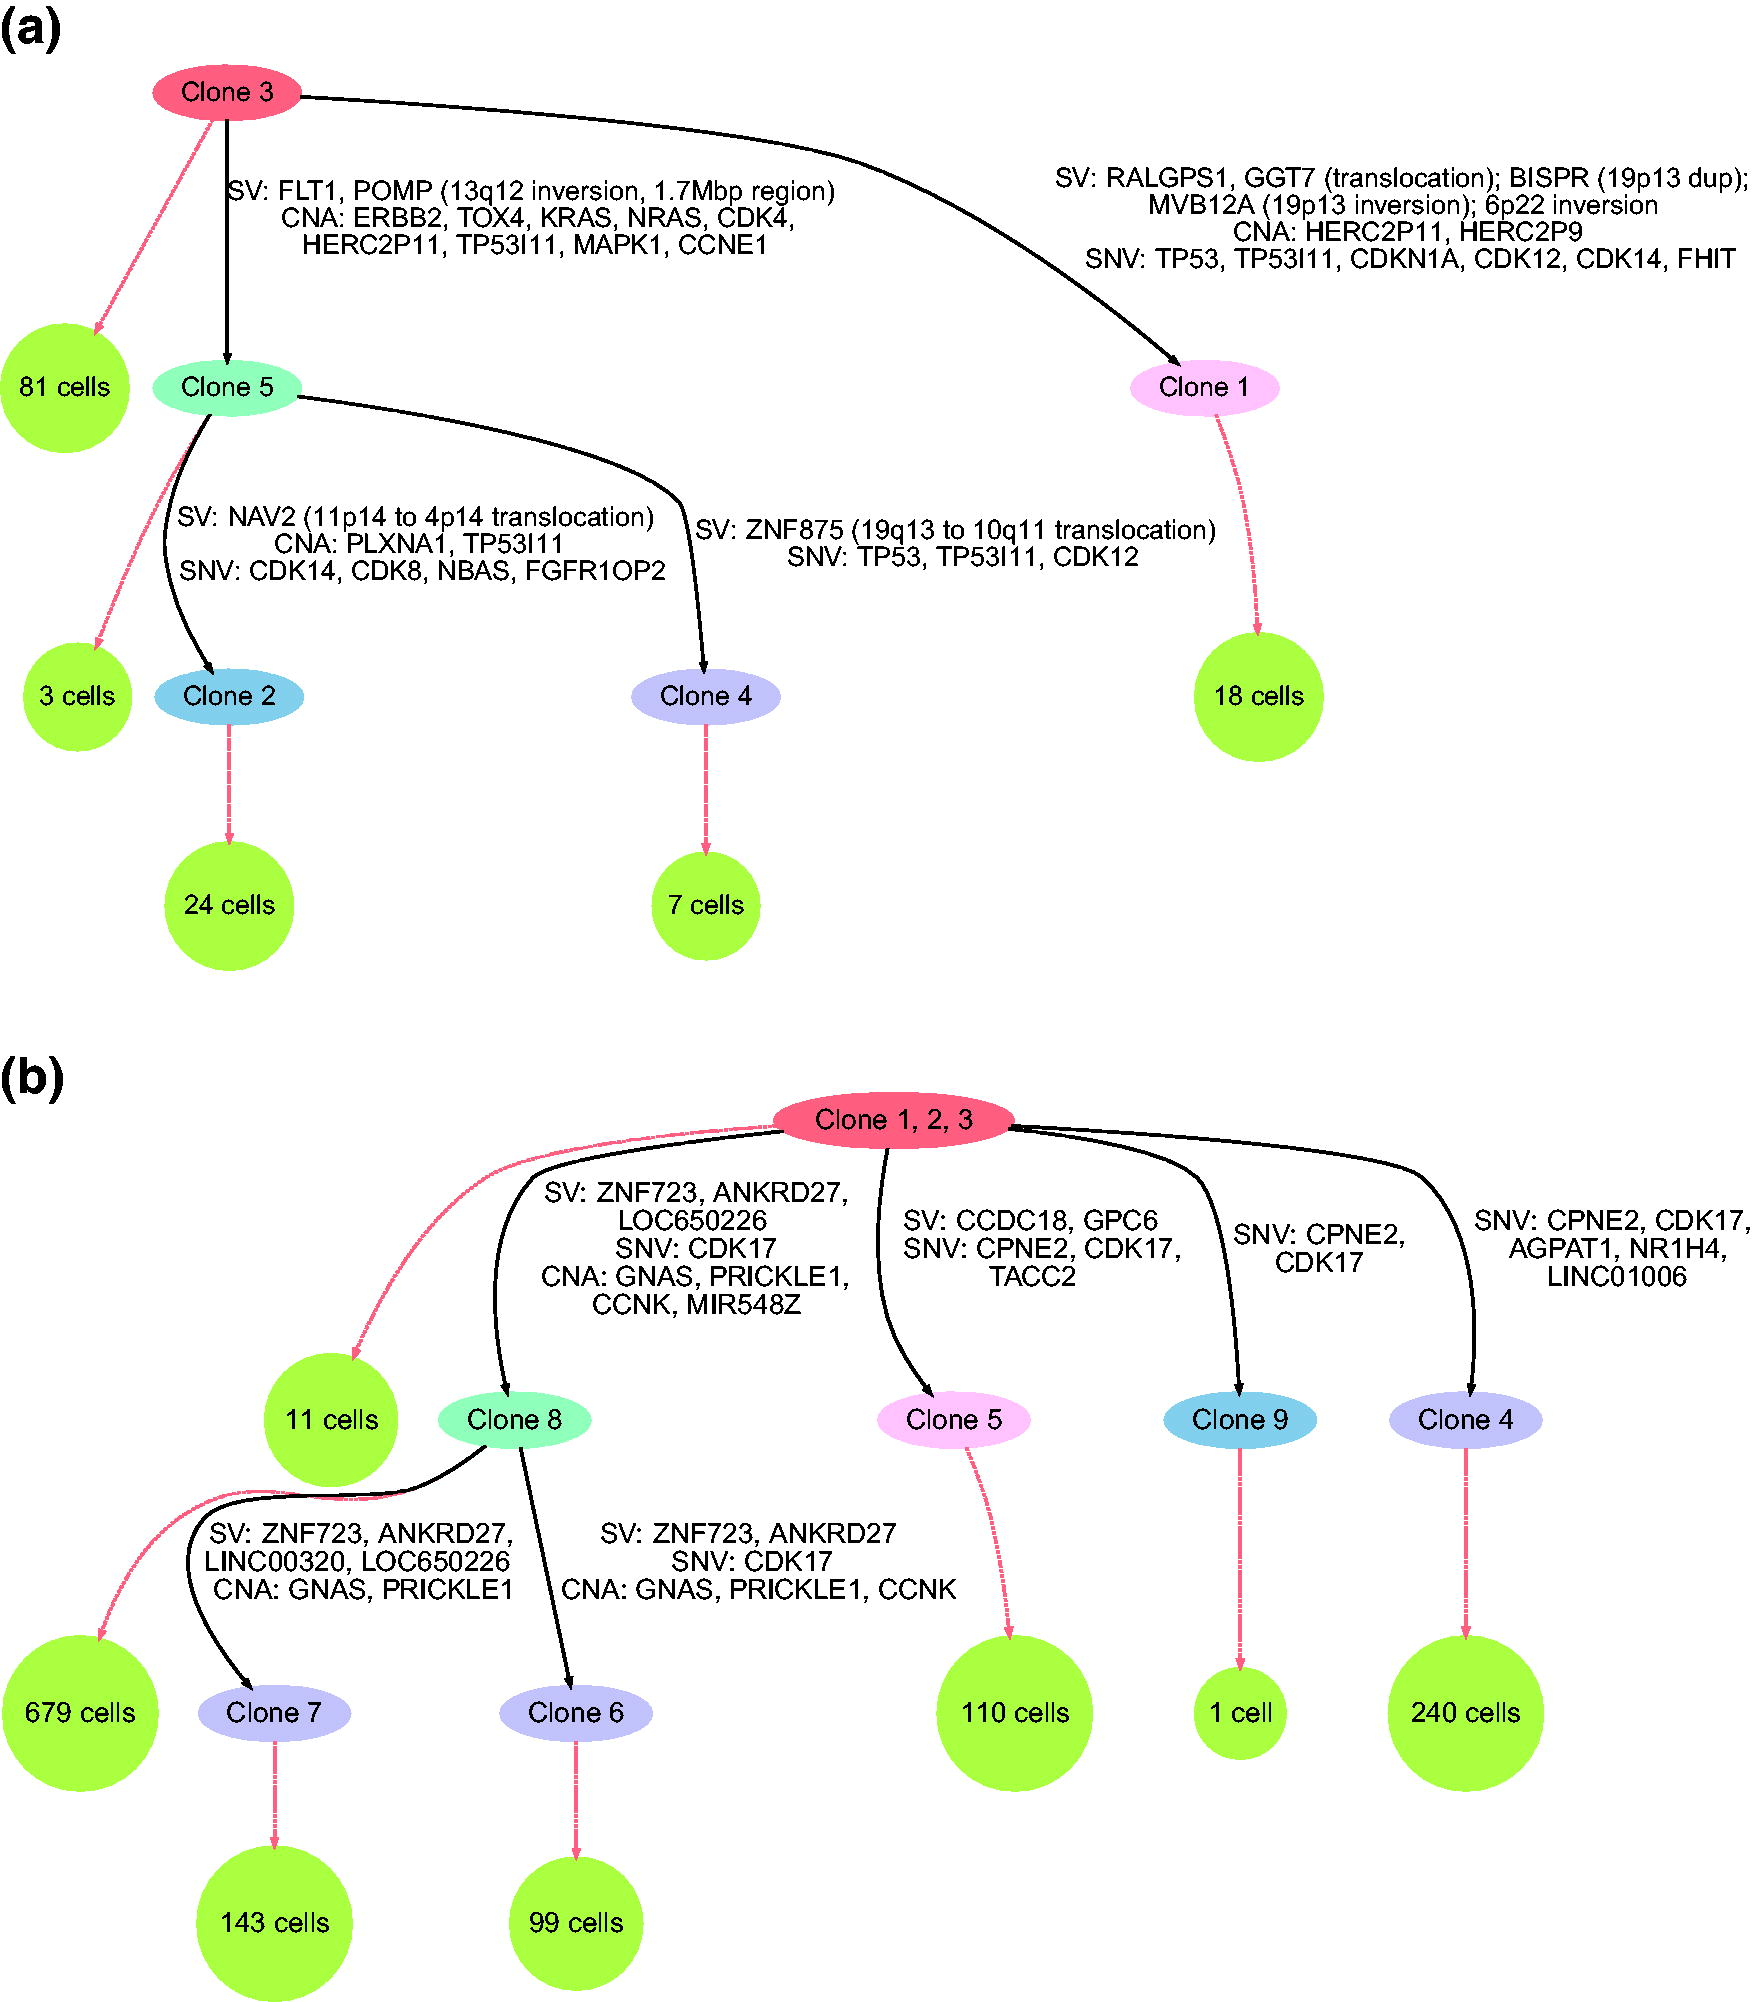
Sc-TUSV-ext trees on two real data sets.
Figure 4a shows Sc-TUSV-ext’s clonal phylogeny for DG1134, exhibiting a number of mutations in common driver genes (Cancer Genome Atlas Research Network et al., 2011). We found high amplification of CCNE1 in clones 2, 4, and 5, with CN = 2 in one allele and 9 in the other allele, consistent with the primary article’s analysis of high amplification in that gene, although it is a subclonal mutation not repeated on the branch to clone 1. Similarly, the phylogeny shows one cell lineage (beginning with clone 5) exhibiting KRAS CNA mutation and FLT1 SV mutation, while a distinct lineage (beginning with clone 1) shows TP53 SNV mutation. These observations highlight the ability of our method to draw out distinct lineages acting through different driver pathways impacted by distinct mutation types. In addition, we found both SNV- and CNA-driven mutations in the TP53I11 gene in all the branches. These observations show the ability of our method to identify recurrent driver mutation, potentially indicative of strong selection, acting through multiple variant types. All branches of the phylogeny showed SVs, indicating ongoing genomic instability shaping the tumor’s clonal evolution.
We added the second data set (SA1049) from Funnell et al. (2022) to evaluate the ability of the method to handle a substantially larger number of single cells (Fig. 4b). Sc-TUSV-ext is able to resolve the data into a clonal tree, although one qualitatively somewhat different than the DG1134 tree. For SA1049, almost all SVs and CNAs are assigned to a single subtree, while the rest of the tree is almost entirely SNV-driven. While the numbers of mutations are too small to rule out random chance in these placements, they may be suggestive of a somatic variant touching off chromosome instability in one clone after the initial tumorigenesis. The CCNK mutation observed at the top of that subtree would be a likely candidate, as CCNK knockdown has been shown to impair DNA damage response and result in spontaneous double-stranded breaks and increased sensitivity to DNA damaging agents (Blazek et al., 2011). We do observe one suspicious result that is a likely artifact of the method, in the repeated observation of CDK17 mutation in the tree. We expect this is a consequence of the model inferring insufficient numbers of clones to resolve an early CDK17 mutation, which likely occurred in an unresolved cell type between the normal root and its children. The repeated CPNE2 mutation in three children of the root likely similarly represents an unresolved event between the root and those three children.
In this work, we present Sc-TUSV-ext, a novel method for constructing clonal lineage trees (“tumor phylogenies”) from single-cell DNA sequencing data while including SNVs, CNAs, and SVs in the reconstruction. On simulated data, we showed the synergy of these distinct variant types in accurately resolving phylogenies, with Sc-TUSV-ext performing better both in estimating error-free variants and reconstructing accurate phylogenies than leading competitor methods that use only subsets of these variant types. We further demonstrated the value of integrating all of these variant types by applying Sc-TUSV-ext to two scDNA-seq data sets from HGSC subjects (Funnell et al., 2022). The first case showed how these different mechanisms of mutability can act in parallel in a single patient and how Sc-TUSV-ext’s comprehensive model can reveal important features of biology that would be missed by other methods. The second provides a demonstration of the method for larger numbers of single cells, while also demonstrating its potential to resolve a phylogeny with apparent subclonal variation in mutation mechanisms and to identify a candidate mechanism for such variation.
There are, however, several directions by which Sc-TUSV-ext could be further improved. First, Sc-TUSV-ext depends on a user-defined number of clones for the tree reconstruction. For synthetic data, we tested that the estimated mutations with Sc-TUSV-ext have the lowest error if the number of clones is accurate (see Supplementary Figures S2 and S3). We also provided a heuristic in our Supplementary Data S1 and S2 to guide the clone number estimation for directly running Sc-TUSV-ext in real data. We recommend users test with different numbers of clones until the method yields unstable results in replicate experiments. Apart from that, the current clustering step depends on L1 or MEDICC2 distances among the variants, neither of which is ideal for this task. Sc-TUSV-ext would benefit from the incorporation of a better clustering method for ultra-low-coverage single-cell sequencing data. It also currently lacks the ability to handle some classes of complex SVs, such as chromothripsis or chromoplexy (Bao et al., 2021). It would also benefit from improved scalability to allow it to make better use of large variant sets as well as further theoretical characterization of how subsampling can be employed most effectively to balance the accuracy and efficiency of inference. Although not explored in this article, the variant subsampling strategy used here offers a natural path toward estimating uncertainty in the tree inferences, although more sophisticated Bayesian treatments of the problem might offer greater versatility. Finally, we note that accommodating diverse variant types in scDNA-seq is just one step forward in a field that increasingly relies on multiomic data integration to exploit the distinct and complementary advantages of a wide variety of genomic technologies now in use for studies of clonal evolution.
Footnotes
ACKNOWLEDGMENT
We thank Benedict Monteiro for helping to identify a bug within our code.
AUTHORS’ CONTRIBUTIONS
R.S. conceived of the idea. N.A.B., X.F., and R.S. derived mathematical results. N.A.B. implemented the code and performed all the analyses. All authors contributed to the final writing.
AUTHOR DISCLOSURE STATEMENT
The content is solely the responsibility of the authors and does not necessarily represent the official views of the National Institutes of Health. The authors declare they have no conflicting financial interests.
FUNDING INFORMATION
Research reported in this publication was supported by the National Human Genome Research Institute of the National Institutes of Health under award number
References
Supplementary Material
Please find the following supplemental material available below.
For Open Access articles published under a Creative Commons License, all supplemental material carries the same license as the article it is associated with.
For non-Open Access articles published, all supplemental material carries a non-exclusive license, and permission requests for re-use of supplemental material or any part of supplemental material shall be sent directly to the copyright owner as specified in the copyright notice associated with the article.