
Abstract
Imaging genetics aims to uncover the hidden relationship between imaging quantitative traits (QTs) and genetic markers [e.g., single nucleotide polymorphism (SNP)] and brings valuable insights into the pathogenesis of complex diseases, such as cancers and cognitive disorders (e.g., Alzheimer’s disease). However, most linear models in imaging genetics did not explicitly model the inner relationship among QTs, which might miss some potential efficiency gains from information borrowing across brain regions. In this work, we developed a novel Bayesian regression framework for identifying significant associations between QTs and genetic markers while explicitly modeling spatial dependency between QTs, with the main contributions as follows. First, we developed a spatial-correlated multitask linear mixed-effects model to account for dependencies between QTs. We incorporated a population-level mixed-effects term into the model, taking full advantage of the dependent structure of brain imaging-derived QTs. Second, we implemented the model in the Bayesian framework and derived a Markov chain Monte Carlo (MCMC) algorithm to achieve the model inference. Further, we incorporated the MCMC samples with the Cauchy combination test to examine the association between SNPs and QTs, which avoided computationally intractable multitest issues. The simulation studies indicated improved power of our proposed model compared with classical models where inner dependencies of QTs were not modeled. We also applied the new spatial model to an imaging dataset obtained from the Alzheimer’s Disease Neuroimaging Initiative database (https://adni.loni.usc.edu). The implementation of our method is available at https://github.com/ZhibinPU/spatialmultitasklmm.git.
INTRODUCTION
Imaging genetics uncovers potential risk genes by analyzing their effects on organisms (e.g., brain structure and lung cancer) and further explains for the pathogenic mechanism of target disorders (Gerber et al., 2009). The past decade has witnessed discovery of numerous gene markers in this research field. The single nucleotide polymorphism (SNP) rs1344706 was shown to impact gray matter volumes in several brain regions and further contribute to schizophrenia (Lencz et al., 2010); rs2365715, rs3762515, and rs67827860 were found associated with white matter lesions causing main depressive disorders (Elliott et al., 2018); rs4348791 ranked the top in the relationship analysis, with phenotypes derived from the left caudate nucleus, which accounted for impaired neural development (Wang et al., 2022). Genome-wise association studies (GWAS) have been widely used in imaging genetics by replacing the one-hot encoding (case–control status) with quantitative traits (QTs) derived from images. Unlike univariate phenotype in classical GWAS, QTs derived from images usually are multidimensional and spatial correlated. Some studies applied voxel-wise approaches which treat imaging traits separately, such as voxel-wise GWAS (vGWAS) and its faster version—a univariate linear model (LM) for critical correlations between each SNP and voxel (Stein et al., 2010; Hibar et al., 2011; Huang et al., 2015). However, QTs in these models were considered independent, potentially overlooking interactive connections among them. Besides, QTs in most imaging genetic studies were summarized from a voxel-wise level into a coarse level, for example, region of interest (Wang et al., 2012; Greenlaw et al., 2017; Zhu et al., 2014). This “trick” reduces the computational burden by sacrificing partial spatial information in the whole-brain images to some extent.
Besides the massive univariate analysis, the multivariate analysis has also been widely used in genetic studies to explore the joint effect of correlated SNPs on a single phenotype. These models usually require a significant reduction in the dimensionality of data; thus, sparse regression technologies are introduced. One line of research is adding regularization to select variables of interest: only a relatively small subset of massive genetic variants has significant effects on the phenotype of interest. This is usually achieved by posing
Another line of research performs decomposition techniques and then iterates in a greedy way to obtain the coefficient matrix, such as the low-rank linear regression model (L2RM) (Kong et al., 2020). To be precise, sparse constraints are imposed on the coefficient matrix, where sparsity is implicitly determined by singular values instead of regularization. These multivariate methods for GWAS offers new benefits over univariate framework: they have not only brought enhanced predictive performance due to correlated genotypes but also alleviated the multiple testing problem to avoid the loss of efficiency in handling high-throughput datasets.
Despite these advantages, a limitation of most association studies in imaging genetics is only furnishing a point estimate of the coefficient matrix but dismissing the uncertainty. Little and Rubin (1987) proposed a Bayesian multivariate normal model that obtained high efficiency by fitting covariance between QTs. However, the performance suffers in datasets with high relatedness due to the ignorance of correlations between samples. Dahl et al. (2016) proposed a Bayesian multiple-phenotype mixed model, which uses matrix normal distributions with the Kronecker products of row and column covariance matrices. Though this approach considered the correlations between both samples and traits and achieved better performance over other approaches on five simulated datasets, it mainly focused on the imputation of missing phenotypes rather than on the efficiency of computing effect sizes. Besides, Song et al. (2022) proposed a Bayesian spatial model to accommodate the correlation structures in brain images by a proper bivariate conditional autoregressive (CAR) process. The model was designed for assessing the association between a moderate number of QTs and SNPs (a few hundred to a few thousand), and it may lose its efficiency in handling large-scale input data. Nevertheless, these models are valuable attempts to perform Bayesian inference in imaging genetic studies.
Association tests often identify significant loci associated with given phenotypes from a statistical perspective. The test statistics usually vary from model to model and depend on the model assumptions. Univariate approaches obtain a standard p value concerning effect size for each SNP–QT pair, where the effect size is 0 under the null hypothesis (Stein et al., 2010; Hibar et al., 2011). Test statistics are carefully designed to avoid computationally intractable multitest issues in a multivariate background. For example, the sequence kernel association test (SKAT) only fits the null model where phenotypes are regressed on the covariates alone (Wu et al., 2011). Furthermore, Cao et al. (2022) proposed a test named “overall” to boost its power by aggregating the information from three types of traditional association tests including SKAT. In the Bayesian framework, each effect size is considered as a random variable rather than a fixed scalar, and the association tests are quite different. One feasible choice is to use the credible interval of each effect size approximated from the posterior distribution, and significance is determined by whether “0” is within the confidence interval (Hespanhol et al., 2019; Lu et al., 2012; Eberly and Casella, 2003). The difficulty in dealing with the p values in the Bayesian framework is that the samples obtained from the posterior distribution of each effect size are usually dependent, not satisfying the independent assumptions commonly used in the frequentist hypothesis tests. Recently, Liu et al. (2020) and Liu et al. (2024) used the Cauchy combination test (CCT) to aggregate a set of individual p values into a single test statistic via Cauchy transformations, and these p values are not necessarily independent. Inspired by this, we adopted the CCT into our model and used the credible interval approach as a benchmark.
In this work, we developed a novel Bayesian regression framework for identifying significant associations between QTs and genetic markers while modeling the spatial dependency among QTs explicitly. Our work has three-fold primary contributions as follows. First, we incorporated a population-level mixed-effects term into the LM, taking full advantage of the dependent structure of brain imaging QTs. This fits the fact that an SNP is interlinked to multiple QTs by pleiotropy—a common biological phenomenon. The population-level mixed-effects term avoids the unidentifiable issue triggered by the individual-level mixed-effects term. Second, we implemented the model in the Bayesian framework and derived a Markov chain Monte Carlo (MCMC) algorithm to do the model inference. Further, we incorporated the MCMC samples with the CCT in an ensemble framework to explore the significant association between SNPs and QTs, which avoided computationally intractable multitest issues. With this model, we can perform the association analysis between a set of QTs and a given SNP simultaneously instead of testing one QT at a time. The spatial model can effectively utilize spatial information and boost its power in association studies. Our simulation studies indicated improved power of our method concerning the metric area under the receiver operating characteristics (ROC) curve (AUC; Ling et al., 2003; Huang and Ling, 2005) compared with the traditional LM. In addition, though we validated our method in a simulation study containing moderate QTs and SNPs, our method can be easily extended to a large-scale of SNP dataset by parallelly allocating disjoint SNP subdatasets to multiple compute servers.
METHODS
A Bayesian spatial-correlated multitask regression model
A LM explains how the outcome variable varies over predictors by a linear function. Let


However, grouping factors, such as populations, species, and regions, exist widely in biological data, which cause the data points not to be truly independent. Thus, a linear mixed model (LMM) is developed to deal with structured data by modeling the relationship of outcomes within groups:

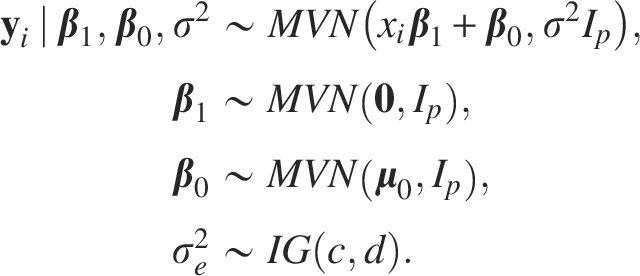
In this work, we extended the traditional univariate LMM by proposing a multitask univariate spatial regression model in the Bayesian framework to accommodate the dependency among phenotypes. To ensure the completeness, we used the LM as a comparison. To be specific, let


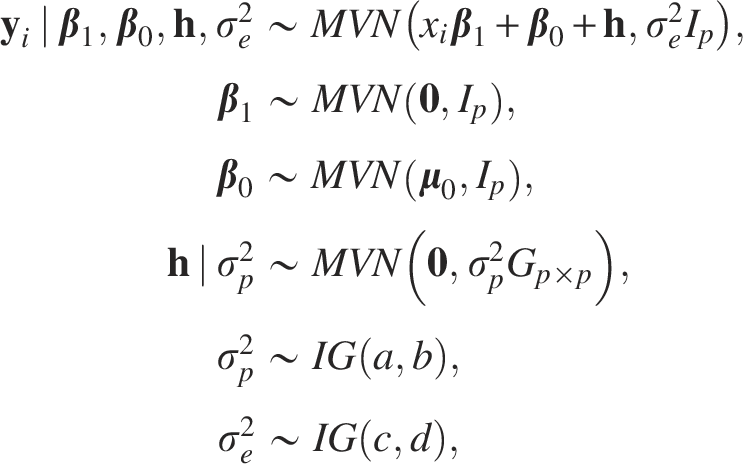
To accommodate the dependency among phenotypes, we incorporated a mixed-effects term


In the Bayesian framework, for the LMM described in Eq. (7), we used multivariate normal distributions as prior distributions for parameters
We implemented an MCMC algorithm, i.e., Gibbs sampling in our content, to approximate the posterior of parameters. The basic idea of MCMC is to generate a Markov chain with equilibrium distribution to be the target. Precisely, with the data denoted as y and parameters to be represented by
Denote the remaining samples after the burn-in stage as
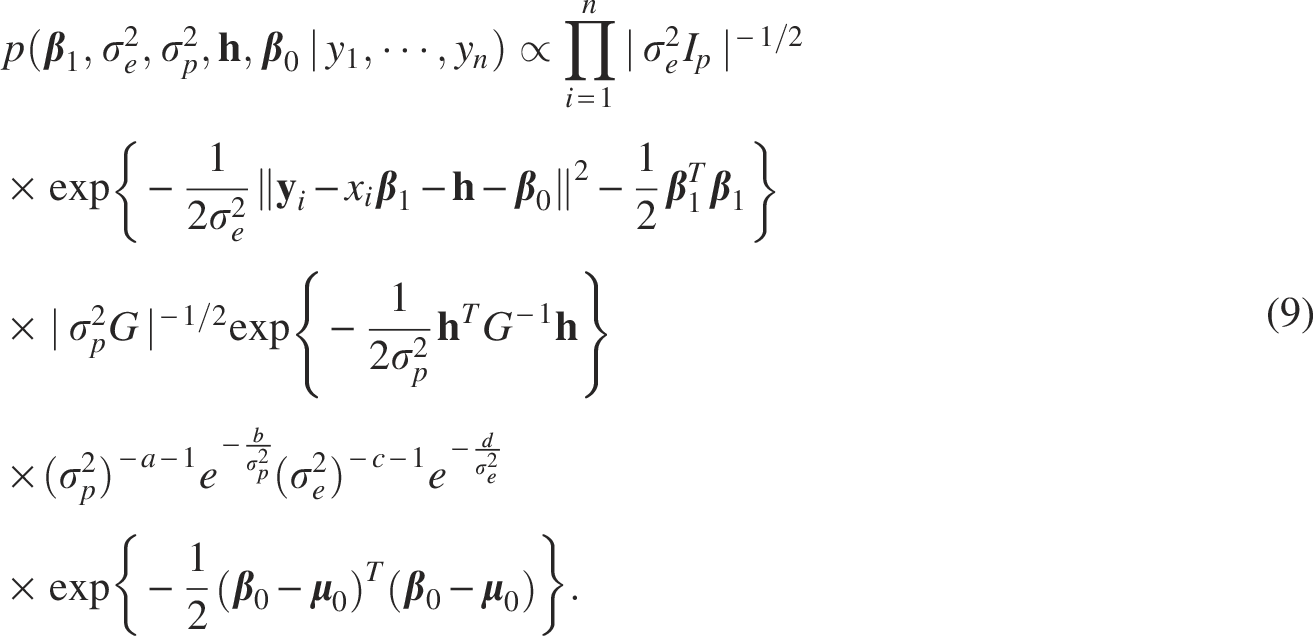
The joint posterior distribution for all unknown parameters of our proposed LMM is given by:

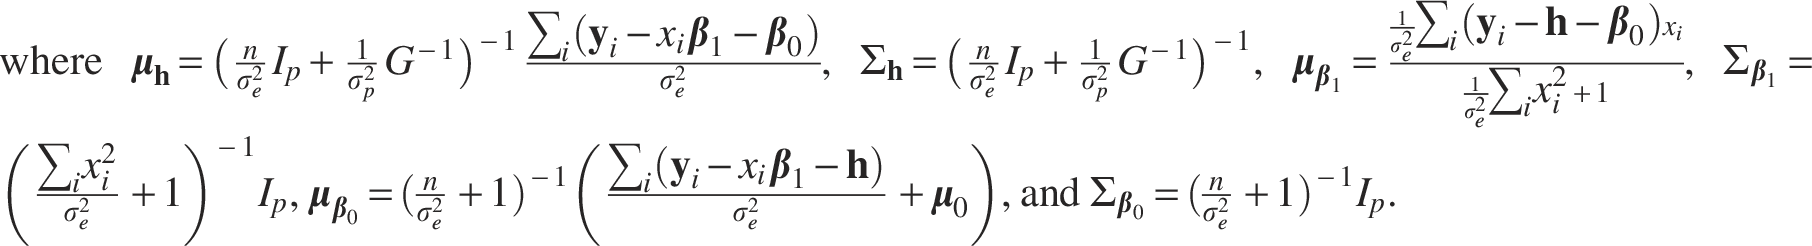
The full conditional distribution of each parameter is derived as follows:


Algorithm 1 depicts the Gibbs sampling algorithm of the LMM. We refer readers to Supplementary Appendix A1 for the derivation details. The Gibbs sampling algorithm for the full Bayesian LM and the derivation details are also given in Supplementary Appendix A1. The implementation of our method is available at https://github.com/ZhibinPU/spatialmultitasklmm.git.
Recall that n was the sample size, m was the total number of SNPs, and p was the total number of phenotypes. The computational complexity of a single-step iteration of MCMC was

In this section, we simulated data in different scenarios to evaluate the performance of our method. We generated d independent SNPs of sample size n with software gG2P, a GWAS simulation tool (Tang and Liu, 2019). Equation (15) was used to generate p-dimensional phenotypes with an underlying trait covariance as well as the random noisy, which were controlled by parameters

We considered an SNP size of
We set the sample size to
In

Case 1. ROC curves of LMM and LM based on credible intervals

Case 2. ROC curves of LMM and LM based on credible intervals
In

Case 3. ROC curves of both the LMM and the LM based on credible intervals
In
The AUC results were shown in violin plots in Figure 4, indicating that the LMM performed better than LM with respect to metric AUC. Tables 1 and 2 summarized the mean and standard deviation of the AUCs. We also performed the Wilcoxon Rank Sum and Signed Rank tests to identify if there existed a significant difference concerning metric AUC between the LMM and LM, and the result was reported in Tables 3 and 4. As Tables 3 and 4 have shown, the LMM performed significantly better than the LM with respect to metric AUC based on both the CCT and credible intervals. The computation time for each setting of the simulations was reported in Supplementary Table S1 in Supplementary Appendix A2.

Cases 4 and 5. Violin plots of averaged AUCs over QTs when correlations among phenotypes were weak
Mean and Standard Deviation of Area Under the Curve Values of the 100 Repeated Experiments for Both the Linear Model and Linear Mixed Model Based on the Credible Interval

Values of
AUC, area under the curve; LM, linear model; LMM, linear mixed model; QT, quantitative traits.
Mean and Standard Deviation of Area Under the Curve Values of the 100 Repeated Experiments for Both the Linear Model and Linear Mixed Model Based on Based on the Cauchy Combination Test

Values of
P Values of the Wilcoxon Rank Sum and Signed Rank Test of Area Under the Curve of the Linear Model Versus Linear Mixed Model Across the 100 Repeated Experiments Based on the Credible Interval

The alternative hypothesis was that the AUC of LMM was larger than that of the LM. P values of
P Values of the Wilcoxon Rank Sum and Signed Rank Test of Area Under the Curve of the Linear Model Versus Linear Mixed Model Across the 100 Repeated Experiments Based on the Cauchy Combination Test

The alternative hypothesis was that the AUC of LMM was larger than that of the LM. P values of
In addition, we explored the performance of the LMM and LM when the true underlying distributions of the mixed-effects term and error term were not normally distributed but heavy tailed, i.e., followed a multivariate t-distribution. We repeated the data simulating process for 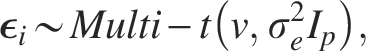
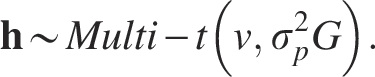
Here, we set the degree parameter
Moreover, in

Case 6. ROC curves of the LMM and LM based on credible intervals
In summary, the above simulation studies showed that LMM performed better than the LM concerning metric AUC when there was a dependency structure among the phenotypes, and their performance was similar when there was no spatial correlation among QTs. In addition, Figures 1–5 and Tables 1–4 indicated that the association test results based on CCT and the credible intervals were consistent.
We applied our proposed method to an imaging genetics dataset collected from the ADNI-1 database. 1 The imaging genetic data contained 632 individuals. After quality control and imputation, we included 486 SNPs from 33 of the top 40 Alzheimer’s disease candidate genes listed on the AlzGene database as of June 10, 2010 (Song et al., 2022). The imaging-derived QTs included in this application study are thickness of the supramarginal gyrus (Supramarg) and the superior temporal gyrus (SupTemporal) on both the left and right hemispheres. The average correlation between Supramarg and SupTemporal was used to describe the relationship between pairs, and the average correlation between the left and right Supramarg and SupTemporal was used to represent the correlation within each pair. Their Kronecker product was used to describe the dependency among these two QT pairs. To mimic the scenario where the number of SNPs was greater than the sample size, we randomly selected 100 individuals from the 632 individuals. The total computational time for the real data application was 1.08 hours with 5000 MCMC iterations, running with a single core (3.20-GHz AMD Ryzen 7 7735H) on a computing cluster with 16 GB of RAM.
Table 5 listed the 19 SNPs selected from the proposed Bayesian spatial LMM based on the CCT at
Alzheimer's Disease Neuroimaging Initiative Study: Selected Single Nucleotide Polymorphisms and the Corresponding Regions of Interest

Alzheimer's Disease Neuroimaging Initiative Study: Selected Single Nucleotide Polymorphisms and the Corresponding Regions of Interest
SNP, single nucleotide polymorphisms.
We proposed a spatial-correlated multitask LMM to uncover potential gene markers associated with multiple correlated imaging QTs simultaneously in the Bayesian framework. The mixed-effects term accounted for the population-level dependency among QTs and enabled the model to make use of the spatial information among QTs and further boost its statistical power in association studies. In this work, we introduced the population-level dependency among QTs to avoid the unidentifiable issue usually triggered by the individual-level mixed-effects term. This might sacrifice some spatial information at the individual level, and how to model the individual-level dependency properly would be one of the directions of our future work. We considered three forms of covariance to depict the population-level dependency, a vanilla form represented by a positive definite matrix, a Kronecker product form accounting for both correlations between phenotypes between pairs and cross pairs, and an adjacency matrix that only uses elements 0 and 1 to represent if there exist correlations between one pair of phenotypes. The Gaussian kernel has been also popular in covariance construction, and it can be considered in the future work. Besides the Gaussian assumption for random errors, we also simulated phenotypes based on a multivariate t-distribution to represent the scenarios where the distribution of phenotypes was mis-assumed. The results indicated that even when the model was mis-specified, the LMM performance was comparable with the cases when the model was not mis-specified concerning the metric AUC, and the LMM outperformed the LM. In addition, applying a transformation to the phenotypes, for example, a log transformation maps the positive-valued QTs to
In addition to the standard LM, we also compared the LMM with the Bayesian group sparse multi-task regression (BGSMTR, Song et al., 2022). The BGSMTR was an innovative approach that explicitly modeled phenotypic correlations both within and across cerebral hemispheres using a bivariate conditional autoregressive (CAR) process. This allowed for considering spatial dependencies of imaging QTs. In addition, the BGSMTR tested grouped SNPs, by encouraging sparsity between and within SNP groupings. While this simultaneous estimation could enhance statistical power when SNPs are strongly correlated (e.g., exhibit strong linkage disequilibrium within groups; Greenlaw et al., 2017), it could also incur significant computational overhead. We conducted a direct comparison with the BGSMTR in Case 3, and the results are given in Supplementary Appendix A4. The results (Supplementary Fig. S6 in Supplementary Appendix A4) indicated that the LMM outperformed the BGSMTR concerning the metric AUC when the SNPs were independently simulated. Meanwhile, compared with the LM, significant performance improvements were observed for both the LMM and BGSMTR, as the LM ignores the intertrait dependencies. The computational complexity shows (see Supplementary Table S2 in Supplementary Appendix A4), when
Besides, Variational Bayes (VB) is also a widely acknowledged technique in Bayesian inference, which often serves as an alternative to MCMC sampling methods (Tran et al., 2021). In the future work, we will consider incorporating the VB results into the model inference to improve the computational efficiency.
AUTHORS’ CONTRIBUTIONS
Z.P.: Conceptualization, data curation, formal analysis, methodology, software, writing—original draft. S.G.: Conceptualization, data curation, formal analysis, methodology, software, project administration, supervision, writing—review and editing. All authors read and approved the final article.
Footnotes
ACKNOWLEDGMENTS
Data used in preparation of this article were obtained from the Alzheimer’s Disease Neuroimaging Initiative (ADNI) database (adni.loni.usc.edu). As such, the investigators within the ADNI contributed to the design and implementation of ADNI and/or provided data but did not participate in analysis or writing of this report. A complete listing of ADNI investigators can be found at ![]() .
.
Data collection and sharing for the ADNI is funded by the National Institute on Aging (National Institutes of Health Grant U19 AG024904). The grantee organization is the Northern California Institute for Research and Education. In the past, ADNI has also received funding from the National Institute of Biomedical Imaging and Bioengineering, the Canadian Institutes of Health Research, and private sector contributions through the Foundation for the National Institutes of Health (FNIH) including generous contributions from the following: AbbVie, Alzheimer’s Association; Alzheimer’s Drug Discovery Foundation; Araclon Biotech; BioClinica, Inc.; Biogen; Bristol-Myers Squibb Company; CereSpir, Inc.; Cogstate; Eisai Inc.; Elan Pharmaceuticals, Inc.; Eli Lilly and Company; EuroImmun; F. Hoffmann-La Roche Ltd. and its affiliated company Genentech, Inc.; Fujirebio; GE Healthcare; IXICO Ltd.; Janssen Alzheimer Immunotherapy Research & Development, LLC.; Johnson & Johnson Pharmaceutical Research &Development LLC.; Lumosity; Lundbeck; Merck & Co., Inc.; Meso Scale Diagnostics, LLC.; NeuroRx Research; Neurotrack Technologies; Novartis Pharmaceuticals Corporation; Pfizer Inc.; Piramal Imaging; Servier; Takeda Pharmaceutical Company; and Transition Therapeutics.
The authors thank ShanghaiTech University for supporting this work through the startup fund and the HPC Platform.
AUTHOR DISCLOSURE STATEMENT
No competing financial interests exist.
FUNDING INFORMATION
This project was supported by the