
Abstract
Accurately predicting drug response depending on a patient’s genomic profile is critical for advancing personalized medicine. Deep learning approaches rise and especially the rise of graph neural networks leveraging large-scale omics datasets have been a key driver of research in this area. However, these biological datasets, which are typically high dimensional but have small sample sizes, present challenges such as overfitting and poor generalization in predictive models. As a complicating matter, gene expression (GE) data must capture complex inter-gene relationships, exacerbating these issues. In this article, we tackle these challenges by introducing a drug response prediction method, called drug response graph attention network (DRGAT), which combines a denoising diffusion implicit model for data augmentation with a recently introduced graph attention network (GAT) with high-order neighbor propagation (HO-GATs) prediction module. Our proposed approach achieved almost 5% improvement in the area under receiver operating characteristic curve compared with state-of-the-art models for the many studied drugs, indicating our method’s reasonable generalization capabilities. Moreover, our experiments confirm the potential of diffusion-based generative models, a core component of our method, to mitigate the inherent limitations of omics datasets by effectively augmenting GE data.
INTRODUCTION
Precision oncology or personalized oncology, which focuses on delivering oncological treatments to each individual separately depending on their tumor type, has emerged as a promising strategy to improve patient outcomes while reducing health care costs by avoiding ineffective therapies (Al-Mekhlafi et al., 2022). This approach could be further enhanced through the growing availability of individual medical data, paving the way for advancements in web-based precision medicine (Kurzlechner et al., 2023; Robson and Boray, 2016; Zarei et al., 2020). Recently, large-scale omics datasets have become publicly available, such as the Genomics of Drug Sensitivity in Cancer (GDSC) (Yang et al., 2013), Cancer Cell Line Encyclopedia (CCLE) (Barretina et al., 2012), Cancer Therapeutics Response Portal (CTRP) (Seashore-Ludlow et al., 2015), Patient-Derived Tumor Xenografts (Gao et al., 2015) (PDX) encyclopedia, and The Cancer Genome Atlas (TCGA) (Weinstein et al., 2013). These resources offer multi-omics data, including gene expression (GE), somatic mutations, copy number aberrations, and drug response information.
Accurately predicting how a specific drug will respond in treating a patient is increasingly critical in the field of precision oncology. However, genetic variations among patients lead to differences in drug responses, making accurate predictions a complex challenge (Arik and Pfister, 2020; Gezici and Sefer, 2024; Patro et al., 2011, 2012; Sefer, 2021, 2022a, 2022b; Sefer and Kingsford, 2011). Numerous studies (Battaglia et al., 2018; Chadebec and Allassonnière, 2021; Chaudhari et al., 2020; Chiu et al., 2019) have explored deep learning (DL) models to predict drug responses by analyzing patients’ genetic data, with many previous works demonstrating that GE data has the highest effectiveness for those types of predictions, where it takes the measurements of genes activities (Chiu et al., 2019; Ding et al., 2018; Li et al., 2021; Park et al., 2021; Sharifi-Noghabi et al., 2019; Sharma et al., 2023; Xu et al., 2019b). In bioinformatics studies, such as those focused on predicting cancer subtypes or drug responses using omics data like GE, one of the key challenges is the high dimensionality of the data combined with a limited number of samples. A large number of features relative to the small dataset increases the risk of overfitting during model training, which reduces the model’s ability to generalize effectively Amani (Al-Mekhlafi et al., 2022; Liu et al., 2017; Lv, 2013). Moreover, the presence of outliers in small datasets further compromises the robustness of these models. Thus, achieving a balance between the number of features and available samples is crucial, especially when dealing with omics data characterized by vast dimensions and limited sample sizes. This study aims to address and mitigate these challenges.
To tackle this problem of high dimensionality of the data with a limited number of samples, three main strategies from different perspectives have been proposed: 1- Incorporating Inductive Bias, 2- Feature Selection, and 3- Data Augmentation. First of all, to enhance predictive power with limited training data, an effective strategy involves taking the inter-relationships among genes into account. Predictive models take these relationships into account as an inductive bias (Battaglia et al., 2018; Hamilton et al., 2017). One way to achieve such inductive bias consideration is to use graph neural networks (GNNs), where GNNs might infer knowledge over the existing biological pathways (Kim et al., 2021). However, improving the quality of predictive power requires methods that focus on a distinct set of pathways integration as well as methods, which can capture the significance of the relationship between genes in drug response prediction. Another standpoint is feature selection, where one approach selects only genes that are highly relevant to the disease/drug via utilizing biological pathways (Fernández-Torras et al., 2019; Guney et al., 2016). Studies have shown that using biological pathways for feature selection helps reduce high dimensionality effectively. Lastly, another approach is to augment training data through the use of generative models, such as generative adversarial networks (GANs) (Karras et al., 2020) and variational autoencoders (VAEs) (Chadebec and Allassonnière, 2021), which have been widely explored in image processing. For instance, some studies have demonstrated improved cancer classification performance via augmentation of GE dataset (Chaudhari et al., 2020; Xu et al., 2019a) with GANs and proposed universal tabular generative models applicable to GE data. Another set of studies (Lacan et al., 2023; Lee et al., 2020) also focus on deep generative models such as GANs to generate additional samples. However, these generative models often overlook the relationships between genes, limiting their ability to capture underlying biological mechanisms. Recent advancements in generative modeling, such as denoising diffusion probabilistic models (DDPMs) (Ho et al., 2020; Song and Ermon, 2019) and denoising diffusion implicit models (DDIMs) (Song et al., 2020), which surpass GANs and VAEs in performance, offer new opportunities for data augmentation to mitigate data sparsity.
To address the limitations of prior studies, we propose DRGAT, a method designed to overcome the challenges of overfitting due to the high dimensionality and limited sample sizes in omics datasets for drug response prediction. DRGAT consists of three key components: (1) Selecting features by using biological pathway analysis to tackle high dimensionality, (2) GE data augmentation via diffusion-based generative models such as DDIMs to mitigate the issue of small sample sizes, and (3) drug response prediction through recently introduced graph attention networks (GATs) with high-order neighbor propagation (HO-GATs). The initial feature selection module focuses on reducing dimensionality by identifying biological pathways most relevant to the target protein of each drug and selecting the genes involved in these pathways. The second module augments GE data using a recently popular probabilistic generative model (DDIM) paired with a graph autoencoder (AE) to capture biological mechanisms. Lastly, the drug response prediction module employs a GAT with high-order neighbor propagation, which leverages prior knowledge of biological pathways, enhancing the model’s generalization ability when trained on limited data.
Overall, our main contributions are summarized as follows:
Novel and accurate drug response prediction approach DRGAT is proposed. Our method utilizes a specialized type of GAT with high-order neighbor propagation. Integration of information from distinct biological pathways can be done by such attention network, which can also consider these pathways genes’ closeness to target proteins/genes. We integrate the recently introduced diffusion-based model DDIM for augmenting GE data into our method. This DDIM-based augmentation is key for addressing the challenges of small expression datasets. Our method DRGAT achieved better drug response prediction than the competing approaches across many drugs where some of them are previously unseen. Additionally, the quality of the data generated via our diffusion-based generative model is higher than the data generated via other competing generative models.
Various methods have been employed for predicting drug responses. Traditionally, machine learning techniques have been used to select key features for prediction tasks (Ding et al., 2018; Geeleher et al., 2014; Graim et al., 2019; Iorio et al., 2016), while AEs have been applied for feature extraction to improve model performance (Xu et al., 2019b). Ding et al. (2018) uses an autoencoder for feature selection, along with an elastic net and support vector machine (SVM) as classifiers. Many studies emphasize dimensionality reduction because the success of these methods often relies on how effectively essential features are extracted from high-dimensional and complex multi-omics data (Eraslan et al., 2019). AutoBorutaRF (Xu et al., 2019b) employs random forests for classification after performing feature selection using AE and the Boruta algorithm (Kursa and Rudnicki, 2010). In DeepDR (Chiu et al., 2019), AE is pre-trained with TCGA data that excludes drug response information, and the AE weights are then used to initialize a prediction model, which is later trained on labeled GDSC data. DeepDSC (Li et al., 2021) utilizes a stacked deep AE to reduce the dimensionality of multi-omics data. Guney et al. (2016) present a drug-disease proximity measure that quantifies the relationship between drug targets and diseases. This measure addresses known biases in the interactome and aids in revealing the therapeutic effects of drugs while also differentiating between palliative and effective treatments.
Recently, with advancements in DL, drug response prediction research has progressed. For instance, the multi-omics late integration (MOLI) (Sharifi-Noghabi et al., 2019) model leverages a deep neural network architecture to integrate multiple types of omics data at different stages of the network. MOLI also encodes multi-omics data using a deep neural network, but it differs from other models by integrating the loss function, where the encoders and the classifier are trained jointly to share each loss. A key feature of MOLI is its triplet loss function (Schroff et al., 2015), which is designed to better distinguish resistant samples from sensitive ones. In MOLI, the encoders and the classifier are trained together using the triplet loss function. Another approach, supervised feature extraction learning with triplet loss (Super.FELT) (Park et al., 2021), reduces the dimensionality of multi-omics data through feature selection, followed by a supervised encoder that extracts vital information from the reduced data. This encoded data is then classified using a neural network for drug response prediction. Additionally, the DeepInsight-3D (Sharma et al., 2023) model takes a novel approach by transforming structured data into images, utilizing convolutional neural networks (CNNs) to predict patient-specific anti-cancer drug responses. Lastly, GraphCDR (Liu et al., 2022) builds a graph neural network using multi-omics profiles of cancer cell lines, drug chemical structures, and known cancer cell line-drug responses to predict cancer drug response (CDR). It incorporates a contrastive learning task as a regularizer within a multi-task learning framework to improve generalization performance.
On the other hand, generative models have become a cornerstone in modern machine learning, with a wide range of applications, including image generation, text synthesis, drug discovery, and anomaly detection (Radford, 2015). These models learn the underlying data distribution and generate new samples that resemble the training data. By understanding the data’s probabilistic structure, generative models can create novel instances, simulate scenarios, and fill in missing information. One of the most well-known types of generative models is GANs (Goodfellow et al., 2014). GANs consist of two neural networks, a generator and a discriminator, that are trained simultaneously. The generator creates fake data samples, while the discriminator attempts to distinguish between real and fake samples. Through this adversarial process, the generator improves its ability to produce realistic data, while the discriminator enhances its ability to spot fake data. VAEs (Higgins et al., 2017b; Kingma, 2013) are another class of generative models based on the AE architecture. VAEs assume that the data is generated from a latent variable model, with both the encoder and decoder learning a probabilistic distribution. By enforcing a constraint on the latent space to follow a known prior distribution (e.g., Gaussian), VAEs can generate new samples by sampling from this latent space. Normalizing flows (Rezende and Mohamed, 2015) are a class of generative models that transform a simple distribution, such as a Gaussian, into a more complex data distribution using a series of invertible transformations. The key advantage of normalizing flows is that they allow exact likelihood computation, which enables both efficient sampling and model evaluation. These models have been particularly useful in applications where interpretability and tractability of the latent variable space are important, such as in density estimation and generative modeling of molecular structures.
PRELIMINARIES AND NOTATIONS
A collection of biological pathways, represented as
Denoising diffusion implicit models
DDIMs (Song et al., 2020) are a variant of DDPM, which are designed to improve the efficiency of the diffusion process by reducing the number of sampling steps required to generate high-quality data, such as images. DDIMs maintain the generative power of DDPMs while making the reverse diffusion process faster and more deterministic. Some key features of DDIM can be summarized as follows:
Deterministic sampling: Unlike DDPMs, which typically use a stochastic reverse diffusion process, DDIMs introduce a deterministic way to reverse the noise. This means that, for a given starting point (random noise), DDIMs can generate the same output each time. Reduced sampling steps: DDPMs usually require hundreds to thousands of reverse steps to generate high-quality samples, which makes them slow. DDIMs significantly reduce the number of steps needed while still maintaining competitive sample quality. Fewer steps mean faster generation. Implicit model: DDIMs achieve this speed-up by introducing an implicit generative model, which allows the process to skip some of the intermediate noisy steps, making the generation process more efficient. Flexibility in trade-offs: One of the strengths of DDIMs is that they offer a trade-off between speed and sample quality. Users can adjust the number of sampling steps based on their needs, choosing to prioritize faster generation or higher-quality output. Improved sample quality: DDIMs tend to produce higher-quality images with fewer sampling steps compared with traditional DDPMs, which is crucial for real-time or resource-constrained applications.
DDIM builds on the diffusion model framework, where the forward process gradually adds noise to data over multiple time steps, and the reverse process aims to recover the original data. Our problem can simply be defined as Problem 1.
Forward process (non-Markovian diffusion process)
The forward process in DDIM defines a set of noisy variables
The forward process can be derived directly from this expression, and for each t, xt is a noisy version of x0 generated by using:
Unlike the stochastic reverse process in DDPM, DDIM employs a deterministic reverse process. In this process, we start from a noisy sample xT and iteratively remove noise to reconstruct x0. This reverse process is non-Markovian and deterministic, making it faster and more efficient than DDPM. The reverse process is derived based on the model’s prediction of noise
The reverse process equation can be interpreted as separating the noisy part from the signal:
DDIM generalizes DDPM by introducing flexibility in the reverse process. While DDPM uses a stochastic process in the reverse direction (adding noise sampled from a Gaussian distribution at each step), DDIM allows for deterministic sampling. This can be achieved by choosing a specific variance schedule αt and adjusting the number of time steps T. In fact, when the noise schedule and the number of steps are chosen appropriately, DDIM can recover the behavior of DDPM.
DDIM allows for fewer sampling steps than DDPM. The steps in DDIM do not have to match the exact forward diffusion process. This flexibility makes DDIM much faster in practice while retaining high-quality samples. For example, while DDPM might require 1000 steps to generate high-quality samples, DDIM can achieve similar results with only 50 or 100 steps, reducing computational cost.
OUR SOLUTION DRGAT
Here, we introduce our proposed solution DRGAT method for drug response prediction. It has three parts, which are summarized in the sections below.
Selecting features via graph analysis
To determine which biological pathways have the greatest influence on drug response prediction outcomes, we need to extract the biological pathways, which are statistically significantly close to drug-related genes.
We calculated the proximity of these pathways by measuring the distance between each biological pathway and the drug-related genes, by following the approach outlined in Guney et al. (2016). According to this approach, we measure the distance between each biological pathway and the drug-related genes via average shortest path lengths between them, which is defined as:
We determined the statistical significance of these estimated distances for each pathway by generating a reference distribution without depending on the number of vertices inside the pathway where vertices correspond to genes. We generated this reference distribution via bootstrapping a randomly selected set of genes. Genes are randomly chosen, where we ensure selected genes match the degree and size of the original drug-related genes. Afterward, the closest distances are estimated upon these randomly chosen genes. We calculated z-scores by using such reference distribution’s mean and standard deviation. Following such z-score calculation, we sort each pathway according to its z-scores and select the highest-scoring K pathways as the proximal ones. Eventually, we choose the genes existing on the chosen pathways having the highest impact on drug response prediction for analysis in the following steps.
In this subsection, we introduce the second component of DRGAT where we focus on handling the limited training data. We handle limited training data and generalize our method by proposing a data augmentation method. The module consists of two key parts. The first step is the projection step, where we utilize graph AE for projecting the GE dataset into latent space. The second step expands such latent space via DDIM. Afterward, we transform such augmented latent space into GE dataset via graph AE’s trained decoder part.
Gene expression profiles graphical compression via autoencoder
Our proposed graphical compression model for GE profiles was built on an AE architecture. Graph AEs provide an effective way to learn graph-structured data representations by encoding structural and feature information into a lower-dimensional space. Graph AEs capture the rich interconnections between nodes, making them powerful tools for tasks like link prediction, clustering, and anomaly detection in various domains such as social networks, bioinformatics, and recommendation systems.
In our case, our AE’s input is based on utilizing the graph knowledge about the inferred K pathways by the approach in Section 3.1. Such input is encoded into a graph embedding in latent space. We feed the GE data
By following this main step, we design the next section’s generative model in generating the latent space from this section’s process.
The trained graph AE model, consisting of
In image generation area where DDPMs and DDIMs are frequently used, the backbone architecture of DDIM-based models typically uses U-Net (Ronneberger et al., 2015), as the CNN operations within U-Net align well with the inherent patterns of image data. However, for our purposes, using a CNN-based U-Net model is unsuitable since the data we’re dealing with does not have the local structures or neighboring pixel dependencies found in images. Given the nature of GE data, we modified the backbone architecture by replacing the convolution layer with an affine layer.
The module described in this section improves the model’s ability to predict whether a sample is sensitive or resistant to a drug by expanding the training data. Instead of generating samples indiscriminately, it focuses on producing samples labeled with their sensitivity or resistance to drugs. In this conditional generation approach, the input data x0 is paired with a condition term such as the sensitive or drug-resistant group. The diffusion model is then adapted to incorporate the condition term c into the reverse process, allowing the model to learn a conditioned generative model
In the reverse process, where denoising occurs, the transformation is applied as a conditional probability based on the given condition. However, the noise injection remains the same for all data classes, meaning the forward process does not vary according to the condition or class. When the mean in the reverse process changes from
To generate latent variables that capture biological information under specific conditions, it is essential to adjust the stochastic generation step, redefined as ancestral sampling by Ho et al. (2020) and Song et al. (2021). The goal is to modify the inference process to produce stochastic samples that adhere to the given conditions. This adjustment can be outlined as follows:
Lastly, we decoded the generated latent space back into GE data using a trained graph AE model. Next, Section 3.3 outlines the proposed data augmentation method for GE profiles aimed at enhancing the generalization performance of drug response prediction models. This approach addresses the challenge of generating GE data by utilizing a compression model using graph AE to map GE data into a low-dimensional latent space that retains biological structure information, which is then generated using the DDIM model. This method offers several benefits. By incorporating a graph AE to capture biological relationships during the generative model’s training, the complexity of the training process is reduced. Additionally, mapping high-dimensional GE data into a low-dimensional latent space lowers computational demands.
Now, we introduce the last constituent of our method, a drug response prediction technique that utilizes high-order neighbor propagation graph attention networks (HO-GATs) (Xiong et al., 2024). In this approach, each biological pathway is modeled as a subgraph
Overall, high-order propagation has the following benefits: (1) Global context: HO-GATs leverage the graph structure more fully by incorporating information from distant nodes, allowing for a more global perspective on node relationships. (2) Expressiveness: By considering high-order neighbors, HO-GATs capture more complex patterns and interactions within the graph. (3) Flexibility: The model adapts to various tasks where the immediate neighborhood may not provide sufficient information, such as in semi-supervised learning tasks on graphs with long-range dependencies.
Basic graph attention network model
In a traditional GAT, for each node v, the attention mechanism is applied to its direct neighbors Attention coefficients:
Normalization (Softmax): The attention scores are normalized across all neighbors Feature aggregation: The feature update for node v is then given by:
HO-GATs extend the GAT by including higher-order neighbors, meaning the neighbors’ neighbors (and so on) in the message-passing mechanism. This allows information from more distant nodes in the graph to influence the representation of each node. In high-order neighbor aggregation, instead of aggregating information only from direct neighbors (1-hop), the HO-GAT aggregates information from multi-hop neighbors. Specifically, for a node v, we can consider neighbors up to k-hops. The feature propagation now incorporates not only immediate neighbors but also the second, third, etc., neighbors.
The node features consisted of GE data and indicators. Each gene was uniquely assigned a gene indicator using a trainable embedding matrix, similar to the token embedding process in Bidirectional Encoder Representations from Transformers (BERT) (Devlin et al., 2019). Additionally, nodes from different biological pathways with the same gene symbol shared the same gene-embedding space. The connection details for each gene were derived from the adjacency matrix, which was generated by preprocessing data obtained from the Kyoto Encyclopedia of Genes and Genomes (Kanehisa and Goto, 2000) database. Let
In terms of final output, the final node representation after k-order neighbor aggregation is given by:
HO-GATs typically employ multi-head attention, where the attention mechanism is applied multiple times in parallel. Each attention head produces its own set of attention weights and node updates, and the results are then combined (concatenated or averaged). For H attention heads, the output is:
As soon as the whole set of vertices in every subgraph has been updated, we employ a readout function to collect knowledge from the subgraph. Additionally, a concatenation operation then combined the distance data of the target protein, associated with the biological pathway represented by the subgraph, with the information from the nodes in that subgraph, as described in Eq. (16):
Here, dk denotes the distance between the target protein and its corresponding subgraph (biological pathway), and
The approach described in this subsection differs from the model proposed by Ryu et al. (2018) in two key ways. First, among the node features in each subgraph, the gene indicator was obtained from a shared, trainable gene-embedding matrix. This shared matrix allows networks to use common information across all biological pathways while learning the distinct features of each pathway. In other words, by sharing the gene-embedding matrix, the networks can leverage similarities (shared genes) between pathways while still learning their unique traits (geometric information). Second, by integrating the distance information from the target protein into the readout function, the model more effectively captures the connection between GE and drug response, leading to more accurate predictions. This improved accuracy is largely because genes closer to the target protein have a greater influence on drug response than those farther away (Guney et al., 2016).
Experimental setup
We adopted the same dataset configuration as a previous study (Sharifi-Noghabi et al., 2019). The training set comprised samples containing GE values and corresponding drug response data for cell lines from the GDSC (Yang et al., 2013) database. To label drug response (resistant/sensitive), we used experimentally determined cutoffs from the prior study (Iorio et al., 2016) to classify samples as sensitive or resistant for each drug. The test set included GE values and drug response data from patients in TCGA (Weinstein et al., 2013) and the PDX encyclopedia (Gao et al., 2015). The data were downloaded from the Zenodo repository (Sharifi-Noghabi et al., 2019). Our code can be found at https://github.com/seferlab/drgat.
For gene interaction and connection information, we use the Search Tool for the Retrieval of Interacting Genes/Proteins (STRING) database that has protein–protein interaction (PPI) datasets (Szklarczyk et al., 2019). Across the STRING database, we selected the largest connected subgraph and focus only on higher confidence interactions where a high-confidence interaction corresponds to interactions having more than 0.7 confidence score. Such high-confidence score indicates a stronger likelihood that the interaction is biologically relevant and not a random or spurious connection. STRING assigns confidence scores to interactions based on various evidence types, such as experimental data, computational predictions, and known curated databases. We ensured the relevance of extracted pathways by eliminating drugs and pathways without genes in the PPI graph. As a result, we obtained 1923 biological pathways.
We have evaluated the performance of the modification site prediction via various metrics such as F1, area under receiver operating characteristic curve (AUC), and precision-recall (PR) curve. Let TP, TN, FP, FN represent true positive, true negative, false positive, and false negative, respectively. Then, evaluation metrics are defined as:
Receiver Operating Characteristics (ROC) AUC is calculated as the area under the Sensitivity (TPR) − (1 − Specificity) (FPR) curve. It takes values between 0 and 1 where random guess obtains an ROC AUC score of 0.5. PR curve plots precision values on the y-axis and recall values on the x-axis. ROC AUC provides a single value that summarizes the model’s ability to discriminate between the two classes. Overall, the AUC score reflects a balance between sensitivity (how well the model identifies true positives) and specificity (how well it avoids false positives), making it useful in cases where one may be more critical than the other.
Drug response prediction enhancement
We train and validate our model by utilizing the GDSC dataset for training and the PDX/TCGA datasets for testing, focusing on six drugs. To ensure a fair comparison, we maintained the same training and test set configurations, drug selection, and evaluation metrics as used in previous studies (Park et al., 2021; Sharifi-Noghabi et al., 2019; Sharma et al., 2023). The training set was split 80:20 for validation purposes, and stratified 5-fold cross-validation is utilized in determining optimal epoch count and the best optimizer, with early stopping employed. Early stopping was triggered when validation loss ceased to decrease, with a patience value of 10 epochs. We did not include the generated synthetic data as in Section 3.3 in validation datasets, but included only in training subsets. The data augmentation rate for drug response prediction was set to 70% of the real sample count, which represented the optimal augmentation ratio identified across the optimal hyperparameter search discussed in Section 4.5. For example, if the number of real samples for each label (resistant/sensitive) is n and m, the synthetic samples per label would be
We assessed the performance of several state-of-the-art methods for predicting anti-CDR using multi-omics data. Specifically, three recently developed methods—MOLI, Super.FELT, and DeepInsight-3D—were used as benchmarks for comparison. Along with these, we also included non-negative matrix factorization, a feedforward network, and the method proposed in Sharifi-Noghabi et al. (2019) in the comparison analysis. Additionally, we compared other methods cited in a previous study (Park et al., 2021), such as the AE, artificial neural network after feature selection, AutoBoruta Random Forest, and SVM. Lastly, we evaluated the proposed method against TabNet (Arik and Pfister, 2020), a widely used model for similar tasks involving tabular datasets.
Performance
Table 1 provides a summary of the generalization performance of various baseline models compared with the proposed model for drug response predictions, especially on the PDX and TCGA benchmark datasets. The following abbreviations are used for the drugs: Pac for Paclitaxel, Erl for Erlotinib, Cet for Cetuximab, Doc for Docetaxel, Cis for Cisplatin, and Gem for Gemcitabine. The results demonstrated that the proposed DRGAT model achieved the highest AUC scores for all drugs in the PDX benchmark dataset, with the exception of Erlotinib (Erl), and outperformed other models for all drugs in the TCGA benchmark dataset. Overall, the proposed method outperformed almost all baseline models, with an average AUC of 0.82 across the six datasets, indicating its strong potential to enhance the accuracy of drug response predictions, particularly on the PDX and TCGA benchmark datasets. Among the baselines, DeepInsight has generally performed the best so we also apply our augmentation to DeepInsight and present results under DeepInsight (Aug). DeepInsight’s performance increases when we augment the data by following our augmentation technique.
Drug Response Prediction Performance on the PDX and TCGA Dataset
Drug Response Prediction Performance on the PDX and TCGA Dataset
Bold values indicate methods with best performance for each drug.
ABRF, AutoBoruta Random Forest; AE, autoencoder; ANNF, artificial neural network after feature selection; CDR, cancer drug response; FFN, feedforward network; GAT, graph attention network; MOLI, multi-omics late integration; NMF, non-negative matrix factorization; PDX, Patient-Derived Tumor Xenografts; Super.FELT, supervised feature extraction learning with triplet loss; SVM, support vector machine; TCGA, The Cancer Genome Atlas.
Starting from the issue identified in previous studies, which showed poor generalization due to insufficient training data, we evaluated the performance of our proposed method without the data augmentation module to determine if it performs worse without this component. This experiment also allowed for a practical comparison with other baseline models by using the GAT with subnetworks without data augmentation, which can be seen as another contribution of this study. Models trained solely on real data, without augmentation, displayed lower performance across all six drugs compared with those trained with augmented data as seen in Table 1. This indicates that augmenting the training data significantly improves generalization on unseen benchmark datasets and confirms that the augmented data is well-suited for enhancing drug response prediction. Furthermore, using only the GAT, the third module in the DRGAT method, without augmentation, led to higher prediction accuracy than all baseline models for two out of three drugs in the TCGA dataset, and none in the PDX dataset. These findings emphasize the importance of both the data augmentation module and the high-order GAT in achieving strong generalization performance in the DRGAT.
We also evaluate the methods on full CCLE and CTRP datasets as seen in Tables 2 and 3 in terms of PR AUC. In these tables, DRGAT (no-aug) stands for DRGAT without augmentation. The results demonstrated that the proposed DRGAT model achieved the highest PR AUC scores for the majority of drugs in the benchmark datasets, where Super.FELT, DeepInsight, and GraphCDR outperform in a few drugs. Overall, the outperformance of our method indicates its strong potential to enhance the accuracy of drug response predictions.
Results of Validation on CCLE and CTRP in Terms of PR AUC
Bold values indicate methods with best performance for each drug.
AUC, area under receiver operating characteristic curve; CCLE, Cancer Cell Line Encyclopedia; CTRP Cancer Therapeutics Response Portal; PR, precision recall.
Results of Validation on CCLE and CTRP Continued in Terms of PR AUC
Bold values indicate methods with best performance for each drug.
Among the considered drugs, cisplatin is an alkylating agent used to treat various cancers. It inhibits DNA synthesis and RNA transcription by damaging DNA (Bloemink and Reedijk, 1996). The functional enrichment analysis on genes related to cisplatin revealed enrichment in terms such as cell division (GO:0051301), DNA replication (GO:0006260), and cellular response to DNA damage stimulus (GO:0006974), supporting the idea that the genes distinguishing sensitive and resistant samples are linked to DNA synthesis. Temozolomide, another alkylating agent, is used to treat brain tumors by methylating the purine bases of DNA, which triggers tumor cell death (Zhang et al., 2012). The enrichment test identified significant terms related to temozolomide mechanisms, including mitotic nuclear division (GO:0007067), cell division (GO:0051301), and DNA replication (GO:0006260). Docetaxel, a taxoid antineoplastic agent, binds to microtubules and prevents their depolymerization induced by calcium ions (Kumar, 1981), disrupting the cytoskeleton of cancer cells during mitosis (Trendowski, 2014). We found significant molecular function terms in gene ontology, including calcium ion binding (GO:0005509) and structural constituent of cytoskeleton (GO:0005200). For these genes, we conducted a functional enrichment analysis using the Database for Annotation, Visualization, and Integrated Discovery (Huang et al., 2009) to explore gene ontology (GO) terms (Consortium, 2008).
To study the impact of latent diffusion on either AE or variational encoder space as well as the diffusion model directly generating expression data, we report ablation performance for drug response prediction performance on the PDX and TCGA datasets as in Table 4 in terms of F1 score. In the table, latent diff on AE corresponds to a latent diffusion model on AE latent space, diff direct corresponds to a diffusion model that directly generates expression data, latent diff on VAE corresponds to a latent diffusion model on variational AE latent space, DRGAT (no FS) corresponds to DRGAT without feature selection part, and DRGAT (no HO-GAT) corresponds to DRGAT without high-order GAT where HO-GAT is replaced with a traditional GAT (Veličković et al., 2018). DRGAT outperforms all remaining ablation studies. Overall, training the diffusion model in latent space leads to a better performance (Rombach et al., 2022). Among the ablation scenarios, running latent diffusion on variational encoder latent space performs the best, as variational encoder is also effective in searching through latent space (Sohn et al., 2015a).
Ablation Performance in Terms of F1 Score on Drug Response Prediction on the PDX and TCGA Datasets
Ablation Performance in Terms of F1 Score on Drug Response Prediction on the PDX and TCGA Datasets
Bold values indicate methods with best performance for each drug.
HO-GAT, high-order neighbor propagation graph attention networks; VAE, variational autoencoder.
We also compared our augmentation module with four generative models designed for tabular data, excluding image-based generative models. Results are shown in Table 5 in terms of F1 score. The conditional variational autoencoder (CVAE) (Sohn et al., 2015b) is a generative model that generates new data samples by mapping a set of conditional variables to the output data distribution, extending the traditional VAE by adding conditional variables to guide the generation process. We used a CVAE with the KL annealing technique, inspired by β-VAE (Higgins et al., 2017a). The conditional tabular GAN (CTGAN) (Xu et al., 2019a) generates synthetic tabular data by learning the distribution of real data and using the generator to produce synthetic data that mirrors the statistical properties of the original data. Tabular VAE (TVAE) (Xu et al., 2019a) is a VAE specifically designed for tabular data, aiming to learn a compact latent representation for tasks such as data generation and anomaly detection. Lastly, CopulaGAN (Patki et al., 2016), implemented in the Synthetic Data Vault library, uses copulas to capture complex multivariate dependencies in tabular data, allowing it to generate synthetic data with a similar statistical structure to the original dataset.
Ablation Performance in Terms of F1 Score on Drug Response Prediction on the PDX and TCGA Datasets
Bold values indicate methods with best performance for each drug.
CTGAN, conditional tabular GAN; CVAE, conditional variational autoencoder; TVAE, tabular VAE.
In the prior experiments, we observed that incorporating the data generated by the proposed augmentation technique into the training set led to enhanced prediction performance on the benchmark dataset. However, it remained uncertain whether this improvement was solely attributable to the high quality of the generated data. Thus, in this section, we examine whether the data produced by the augmentation module accurately replicated the distribution of real data.
In synthetic data experiments, we employed the generative module with the hyperparameters outlined in Section 4.2 to generate samples equal in number to the real samples. To quantitatively assess the quality of the generated samples compared with existing methods and our proposed approach, we utilized four evaluation metrics inspired by a previous study (Goncalves et al., 2020): cosine similarity, log-cluster, pairwise difference (PD), and Kullback–Leibler divergence (KLD). Cosine similarity measured the angle between two non-zero vectors in an inner product space, indicating the similarity between them. The log-cluster metric evaluated the similarity of the latent structures in the real and synthetic datasets in terms of clustering. PD was determined as the Euclidean distance between pairs of real and synthetic data. Lastly, KLD was calculated based on the comparison of real and synthetic marginal probability mass functions, measuring the similarity between the two. For KLD, PD, and log-cluster, lower values indicated better performance, while higher cosine similarity indicated better performance.
We compared our augmentation module with four generative models designed for tabular data, excluding image-based generative models. The CVAE (Sohn et al., 2015b) is a generative model that generates new data samples by mapping a set of conditional variables to the output data distribution, extending the traditional VAE by adding conditional variables to guide the generation process. We used a CVAE with the KL annealing technique, inspired by β-VAE (Higgins et al., 2017a). The CTGAN (Xu et al., 2019a) generates synthetic tabular data by learning the distribution of real data and using the generator to produce synthetic data that mirrors the statistical properties of the original data. TVAE (Xu et al., 2019a) is a VAE specifically designed for tabular data, aiming to learn a compact latent representation for tasks such as data generation and anomaly detection. Lastly, CopulaGAN (Patki et al., 2016), implemented in the Synthetic Data Vault library, uses copulas to capture complex multivariate dependencies in tabular data, allowing it to generate synthetic data with a similar statistical structure to the original dataset.
Quantitative performance
Using the evaluation metrics described above, we assessed the quality of the generated GE data for each of the six drugs, as shown in Table 6. We then calculated the final model performance by averaging the results of the four evaluation metrics among all these drugs. When comparing the overall performance across the four metrics between our model and the four baseline models, the proposed model showed significantly better results in KLD, pairwise distance, and cosine similarity, with the exception of the log-cluster metric. These results indicate that the proposed model effectively approximates the distribution of real-world data and accurately captures the relationships between features.
Comparison of Generation Performances of Different Models with DRGAT in Terms of Four Metrics
Comparison of Generation Performances of Different Models with DRGAT in Terms of Four Metrics
Bold values indicate methods with best performance for evaluation metric.
KLD, Kullback–Leibler divergence; PD, pairwise difference.
To qualitatively evaluate the sampling diversity between the baseline generative models used in the quantitative assessment and our proposed augmentation module, we conducted a T-distributed Stochastic Neighbor Embedding (t-SNE) visualization (Van der Maaten and Hinton, 2008) comparison between real and synthetic data. The results are shown in Figure 1A−D for CTGAN, CVAE, CopulaGAN, and TVAE, respectively. Compared with the t-SNE distribution of real data, the synthetic data generated by CTGAN and CopulaGAN showed significant deviations in distribution due to the excessive presence of non-existent values. While the CVAE model generated data within the range of real data, it lacked diversity. Similarly, the TVAE model produced data within the real data range but also showed limited diversity. In contrast, the proposed augmentation module outperformed the baseline models in sampling diversity, with a distribution nearly identical to the real data, as shown in Figure 1E.

t-SNE visualizations of the synthetic and real data.
To demonstrate the ability of our proposed augmentation module to generate labels conditioned on drug response, we augmented the training data for both matched and unmatched cases. Matched cases refer to instances where both real and synthetic labels are either resistant or sensitive, while unmatched cases involve real and synthetic labels that differ, with one being resistant and the other sensitive. The augmentation rate was set to 70% of the real data, consistent with the rate used in Section 4.2. Figure 2 displays the validation loss when training the drug response prediction model for Docetaxel using augmented data in both cases. The validation loss reduction was smaller for unmatched cases compared with matched cases, suggesting that the prediction model struggled to learn drug response predictions when trained on unmatched data. This indicates that our proposed generative model is capable of controlling drug response predictions based on the given condition, whether it is resistance or sensitivity.
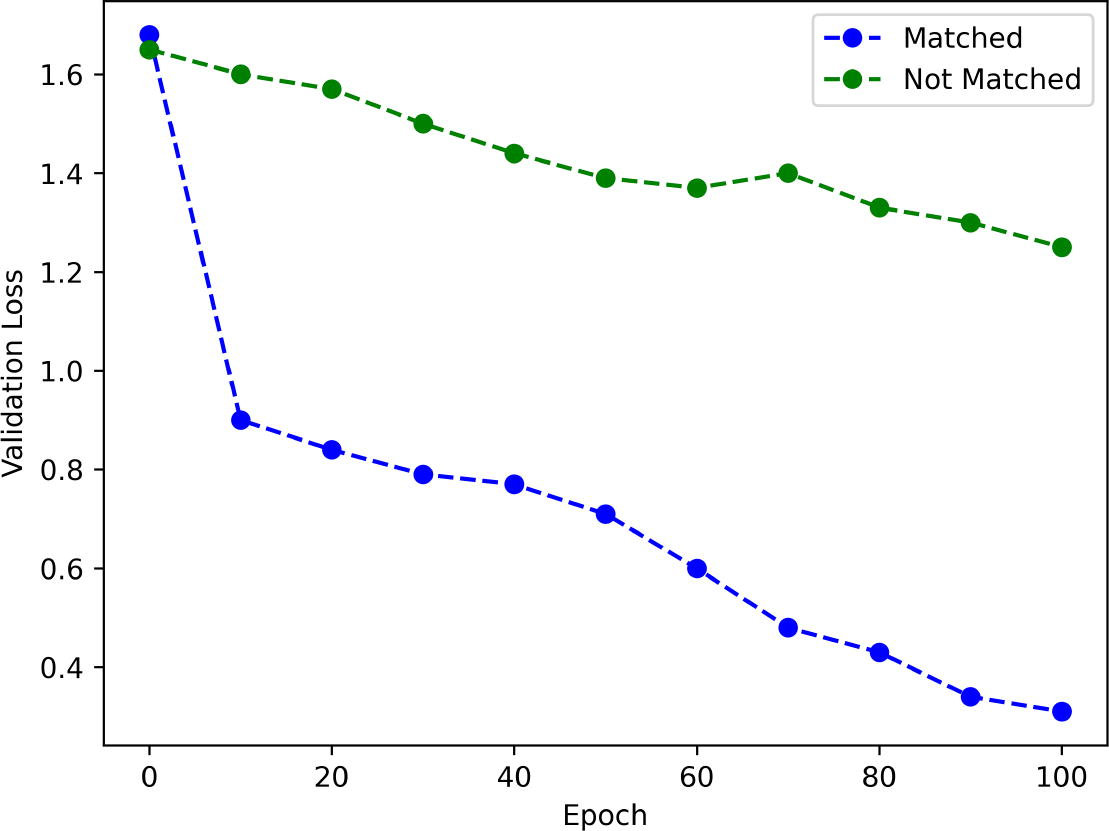
Augmentation of training data for matched and unmatched cases.
These experiments outline the number of biological pathways selected in the first module and the amount of augmented data required in the second module to achieve optimal performance. The experimental setup was similar to the one described in the earlier section on drug response prediction enhancement. The training set was split 80:20 for model validation, with synthetic data excluded from the validation set. Importantly, the independent benchmark datasets PDX and TCGA were not included in this analysis. Additionally, a stratified 5-fold cross-validation was conducted within the training set, maintaining the same 80:20 ratio for training and validation. The performance metric was defined as the average of the final validation losses recorded across each fold under these experimental conditions.
Performance
Figure 3A illustrates the pattern of average final cross-validation loss values based on different levels of training data augmentation, while Figure 3B shows the same pattern based on varying degrees of biological pathway selection. The performance improvements related to augmentation and pathway selection were inconsistent across the six drug cases. However, a common observation across all drug cases was the presence of a threshold beyond which further data augmentation no longer enhanced performance. In other words, simply increasing the amount of data did not result in unlimited improvements in drug response prediction performance. Similarly, there was a threshold for performance improvement with pathway selection, where selecting more pathways did not continuously enhance performance. The optimal performance in drug response prediction was generally achieved when the data augmentation ratio was between 75% and 125% of the original data across all drugs. Specifically, the best performance, reflected by the lowest average validation loss, was observed with a data augmentation ratio of 70%−75% across various augmentation levels at 25% increments from 0% to 150%. Likewise, the optimal hyperparameter for pathway selection was determined by selecting 5% of the total pathways, as per the previously described method.
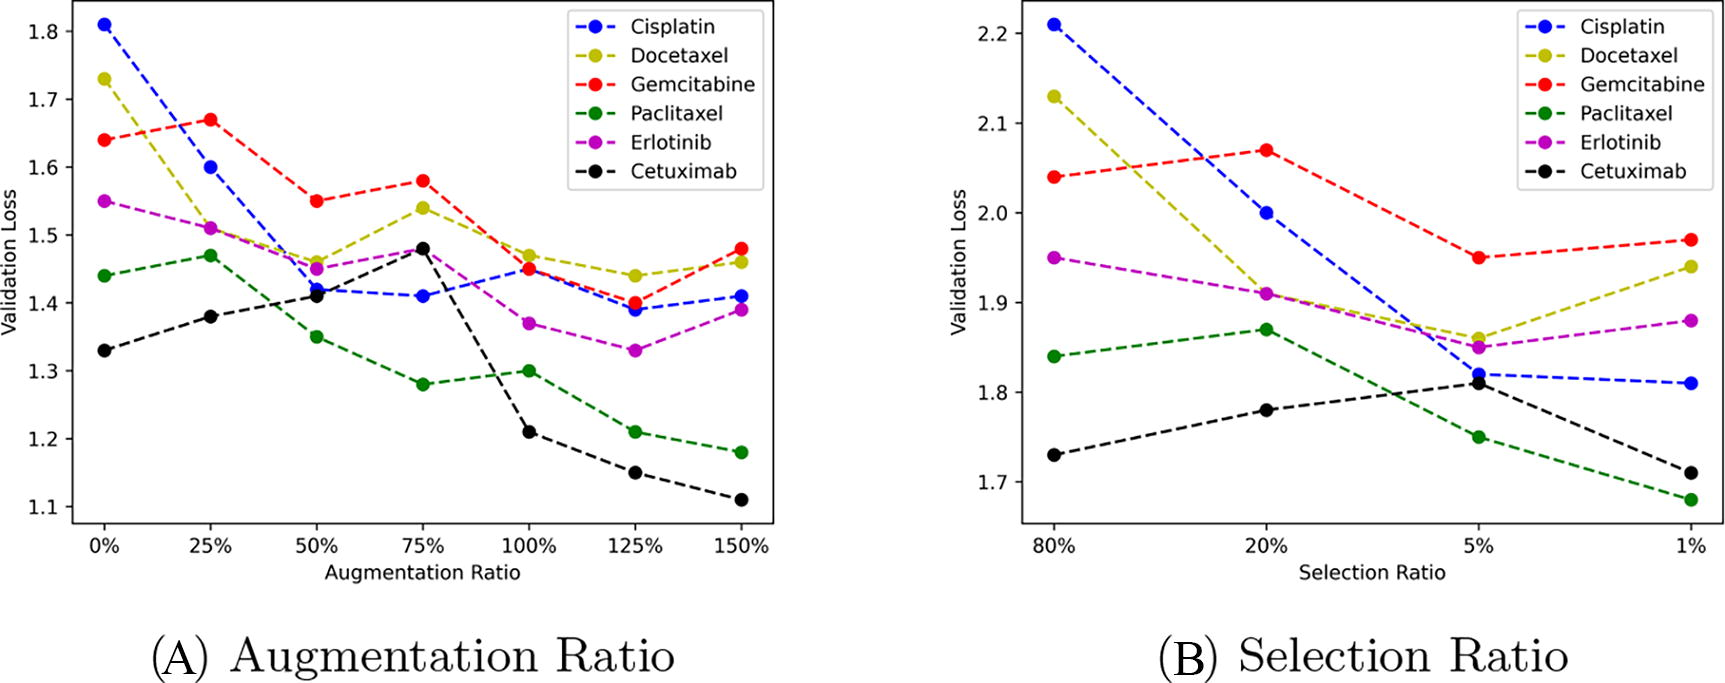
Validation losses across augmentation ratio and selection ratio.
Here, we come up with a novel drug response prediction method to tackle the challenge of high dimensionality and lower sample size in the dataset. We handle this challenge by utilizing a network-based attribute selection method to identify key variables where we calculate the proximity between a drug and its target proteins/genes. Additionally, we focus on augmenting the GE dataset via DDIM-based generation models and used a high-order GAT for drug response prediction. During these steps, we use biological pathways in the graph as a prior knowledge. Our proposed approach exhibited remarkable generalizability across unseen patient datasets in terms of predicting drug responses, when compared with the competing approaches. Additionally, our diffusion-based generation module, which is used for GE data augmentation, has generated high-quality samples compared with those generated via competing baselines.
Footnotes
AUTHOR’S CONTRIBUTIONS
E.S.: Methodology, software, visualization, and writing. The author read and approved the final article.
AUTHOR DISCLOSURE STATEMENT
The author declares no conflict of interest.
FUNDING INFORMATION
This research was funded by TUBITAK (Scientific and Technological Research Council of Turkey) 3501 Project with grant number 122E706.