




Abstract
Predicting the survival outcomes and assessing the risk of patients play a pivotal role in comprehending the microbial composition across various stages of cancer. With the ongoing advancements in deep learning, it has been substantiated that deep learning holds the potential to analyze patient survival risks based on microbial data. However, confronting a common challenge in individual cancer datasets involves the limited sample size and the high dimensionality of the feature space. This predicament often leads to overfitting issues in deep learning models, hindering their ability to effectively extract profound data representations and resulting in suboptimal model performance. To overcome these challenges, we advocate the utilization of pretraining and fine-tuning strategies, which have proven effective in addressing the constraint of having a smaller sample size in individual cancer datasets. In this study, we propose a deep learning model that amalgamates Transformer encoder and variational autoencoder (VAE), VTrans, employing both pre-training and fine-tuning strategies to predict the survival risk of cancer patients using microbial data. Furthermore, we highlight the potential of extending VTrans to integrate microbial multi-omics data. Our method is assessed on three distinct cancer datasets from The Cancer Genome Atlas Program, and the research findings demonstrated that (1) VTrans excels in terms of performance compared to conventional machine learning and other deep learning models. (2) The utilization of pretraning significantly enhances its performance. (3) In contrast to positional encoding, employing VAE encoding proves to be more effective in enriching data representation. (4) Using the idea of saliency map, it is possible to observe which microbes have a high contribution to the classification results. These results demonstrate the effectiveness of VTrans in prediting patient survival risk. Source code and all datasets used in this paper are available at https://github.com/wenwenmin/VTrans and https://doi.org/10.5281/zenodo.14166580.
INTRODUCTION
As our understanding of microbiota expands, it becomes increasingly evident that the human microbiota plays a pivotal role in both human health and the development of diseases (Cho and Blaser, 2012). Microbiota is composed of billions of microbes, forming a complex and diverse ecosystem that resides within the human body. They have been proven to be associated with the carcinogenic effects of certain cancers. The abundance of various microbes varies across different types of cancer and also significantly influences responses to cancer treatments (McQuade et al., 2019; Poore et al., 2020). These facts constantly indicate the enormous potential of microbiota in diagnosing various types of cancer diseases (Wang et al., 2011).
In previous studies, machine learning has played a crucial role in the processing of microbiota information and predicting the survival status of patients (Soueidan and Nikolski, 2015; Oudah and Henschel, 2018; Moitinho-Silva et al., 2017). In recent years, some researchers have attempted to use attention mechanisms to process biological data (Li et al., 2023b, 2023a). With the continuous development of deep learning, especially the widespread application of variational autoencoders (VAEs) (Kingma and Welling, 2013) and Transformer (Vaswani et al., 2017), the research on patient survival analysis is continuously evolving towards deep learning methods. For instance, some studies have applied deep learning methods to analyze human gut microbiota for disease prediction (Nguyen et al., 2018, 2017). These approach effectively addresses the issue of poor predictive performance in traditional machine learning models when dealing with high-dimensional, low-data scenarios (Chappell et al., 2018). Despite the increasing richness of new technologies in enhancing human understanding of microbiome data expression, challenges still exist in effectively harnessing the potential of the microbial data. First, the most significant aspect is that microbiome data often exhibits high-dimensional and limited sample sizes (Hernandez et al., 2022). Consequently, deep learning methods are susceptible to the cruse of dimensionality during the training process, leading to model overfitting and subsequently causing a decline in predictive performance. Second, the interpretability of microbiome data is limited, posing a challenge even when models can make predictions. Understanding how the model makes decision and extracting biological insights from them remains a challenge.
To overcome these challenges, we have adopted a VAE-based pretrained Transformer deep learning method, VTrans for short, for microbiome data analysis. This model primarily integrates Transformer-encoder and VAE, employing pretraining and fine-tuning strategies. We utilize microbiome data for patient risk prediction, employing pretraining methods to mitigate overfitting caused by limited sample sizes. Additionally, we incorporate saliency map to identify microbiota relevant to the model predictions (Simonyan et al., 2013; Zhang et al., 2023).
To train the VTrans model, we initially preprocess five cancer datasets, utilizing them as training data for VAE. The VAE model is employed for data augmentation. Subsequently, the trained VAE weights are transferred to the VAE encoding module. The purpose of this encoding component is to generate a latent representation of the raw data, integrate it into the original expression to obtain an enhanced representation, and then use this enhanced representation as input to a Transformer-encoder. Following the Transformer, a binary classifier is appended to accomplish risk prediction.
The main contributions of our proposed method are as follows:
By employing pretraining and fine-tuning methods, we obtained shared features across multiple cancer datasets. The use of data augmentation addressed the issue of overfitting and performance degradation caused by the limited number of samples in individual datasets. Utilizing a hierarchical structure of the multi-head co-attention Transformer-encoder, we perform deep feature extraction from microbiome data, providing downstream tasks with more informative data. We employed a saliency map method to identify microbiota relevant to model predictions, which can aid in analyzing the survival risk of cancer patients.
Survival analysis via deep learning
We reviewed recent work in the target task domain over the past few years. With advances in VAEs and Transformers, researchers increasingly utilize VAEs for latent data distribution and Transformers for hierarchical feature extraction. MAVAE (Li et al., 2023b) employs the self-attention mechanism of Transformers to first compute the attention scores of input features. After obtaining the attention matrix, it reconstructs new latent variables using the encoder of a variational autoencoder. Finally, a multilayer perceptron is used to perform survival risk classification and prediction for cancer patients. TransVCOX (Li et al., 2023a) adopts a standard transfer learning strategy by using cancer data as input to pretrain a variational autoencoder and then transferring its weights to the backbone network. Within the backbone network, the variational autoencoder is utilized for dimensionality reduction of the input data, which is then combined with the original data and fed into a Transformer encoder for feature reconstruction. Finally, a COX model (COX proportional-hazards model) is employed to predict patient risk. Although previous work shares similarities with our approach, they primarily utilize self-attention mechanisms for feature reconstruction, often overlooking the latent information carried by other data. In contrast, our method reconstructs data that includes latent distributions using a variational autoencoder, and then combines it with the original data to enhance representation. By employing a cross co-attention mechanism, our approach uses these combined data as mutual focus points for attention score calculation and feature reconstruction, thereby fully leveraging the available information and distinguishing our method from others.
Development of co-attention
The co-attention mechanism has undergone significant development since its inception. Over time, various forms of co-attention have emerged and evolved. The concept of Parallel Co-attention first clearly appeared in the image domain (Lu et al., 2016). This method calculates attention between images and questions (text), generating two attention matrices that represent the degree of focus each input modality has on the other. The core idea of this co-attention mechanism is to process the attention of two modalities in parallel at the same network layer, hence the term “parallel.” The same paper also introduced another approach called Alternating Co-attention, which alternately computes attention between the question and the image rather than in parallel. This method embodies the characteristic of “alternating,” which led to its name (Lu et al., 2016).
With the application of Transformer models in tasks like visual question answering and image captioning, the concept of cross co-attention gradually evolved in related fields (Vaswani et al., 2017; Peebles and Xie, 2023). This approach calculates the interactive attention between two modalities. For each pair of input modalities, a shared attention layer computes the weight distribution between them, thereby enhancing the interdependence of the modalities. Inspired by cross co-attention and Transformers, we applied the co-attention mechanism to compute attention between pretrained reconstruction data and the original data. We then summed the two resulting attention matrices to obtain cross co-attention, which enhances the mutual dependency between the two datasets. We have named this method Pretrained-Guided Co-attention.
Development and application of saliency maps
The concept of saliency maps first emerged in the field of computer vision (Simonyan et al., 2013). A saliency map is an image that highlights the regions where human eyes tend to focus first, reflecting the importance of pixels to the human visual system. In neural networks, saliency maps are heatmaps that emphasize the pixels in an input image that contribute most to the output classification. As the concept rapidly evolved, saliency maps have been applied to a broader range of fields. Recently, saliency maps have been used to interpret which parts of a time series are most influential in determining classification results (Parvatharaju et al., 2021). Additionally, some researchers have used saliency maps in deep learning to identify spatial domain-specific variable genes for classification (Zhang et al., 2023). They calculate saliency scores through backpropagation to identify the crucial parts of the neural network that influence classification weights. Inspired by this approach, we applied saliency maps to the analysis of microbiome data in cancer patients for the first time, using backpropagation to identify the microbiome components that significantly influence classification outcomes in cancer patient risk prediction. The goal is to leverage these microbiome components to assist in clinical assessments of patient survival risk.
METHODS
Data preprocessing
In this study, we utilized data from TCGA (The Cancer Genome Atlas Program) database (Tomczak et al., 2015), which includes various types of cancer and provides comprehensive clinical and microbiome data information. To evaluate VTrans, we sourced clinical and microbiome data for three distinct cancer types with substantial sample sizes from the cBioPortal public database (Gao et al., 2013). The three different types of cancers are Colon adenocarcinoma (COAD), Head and Neck squamous cell carcinoma (HNSC) and Stomach adenocarcinoma (STAD). To capture a wide range of modalities, our study focused on patients with available clinical and microbiome data.Rectum adenocarcinoma (READ) and Esophageal carcinoma (ESCA) were included in the pretraining process for each of the other datasets. In other words, READ and ESCA were jointly involved in the pretraining process for each cancer dataset. For the other three specific datasets, to prevent data leakage, two additional types, apart from the designated type, were also included in the pretraining process for the specific dataset. Details of the data can be found in Table 1.
The List of Microbial Datasets Used in the Study Includes the Three Cancer Types with the Highest Number of Samples from TCGA and Two Cancer Types Simultaneously Involved in Pretraining
The List of Microbial Datasets Used in the Study Includes the Three Cancer Types with the Highest Number of Samples from TCGA and Two Cancer Types Simultaneously Involved in Pretraining
COAD, Colon adenocarcinoma; ESCA, Esophageal carcinoma; HNSC, Head and Neck squamous cell carcinoma; READ, Rectum adenocarcinoma; STAD, Stomach adenocarcinoma.
For microbiome data preprocessing, we first conducted screening on microbial features. To maintain consistency, we then combined the five datasets. Then, microbes with missing data rates (dropout) exceeding 95% were removed. VTrans requires data from each sample to be on the same scale. So we conducted consistent preprocessing for each dataset. For clinical data, some of which are redundant and repetitive. We used two types of data: Patient Identifier and Overall Survival Time (Days).
There are missing values in clinical and microbiome Data. To handle missing values in these data, we directly delete the clinical data related to them. Due to the imbalance in the number of clinical data and microbiome data, we only keep clinical data of patients with microbiome data and pretraining with these microbiome data.
Gene expression data and CNA data preprocessing
The original gene expression matrix and copy number alterations (CNA) data contain tens of thousands of features, and we believe that these original data contain a substantial number of redundant features, which may lead to a decline in model performance. To address this issue, we selected the recursive feature elimination method from the scikit-learn library for feature selection, identifying the 300 most important features. These selected features were then standardized separately and used as optional inputs for the model.
Create classification label
VTrans was trained and used for predictions on a single cancer dataset. As classification labels, we used the average overall survival time of patients as the threshold. If the survival time was equal to or exceeds the threshold, it was labeled as 1. Conversely, if the survival time was below the threshold, it was labeled as 0.
Finalizing the training dataset of VTrans
For each cancer dataset, we partitioned the data into two distinct subsets, with a distribution ratio of 7:3 for training and testing respectively. During the training process, due to the limited number of datasets, we used fivefold cross-validation, and selected the best performing one as the result of the model. To avoid overfitting, we employ L1 regularization, dropout and standardize data during training.
The proposed VTrans method
Herein, we introduce our deep learning model, VTrans (Fig. 1), which is mainly composed of two parts, pretrained VAE (Hu et al., 2020) and cross co-attention encoder respectively. The primary purpose of VTrans is to predicting survival risk through microbiome data.
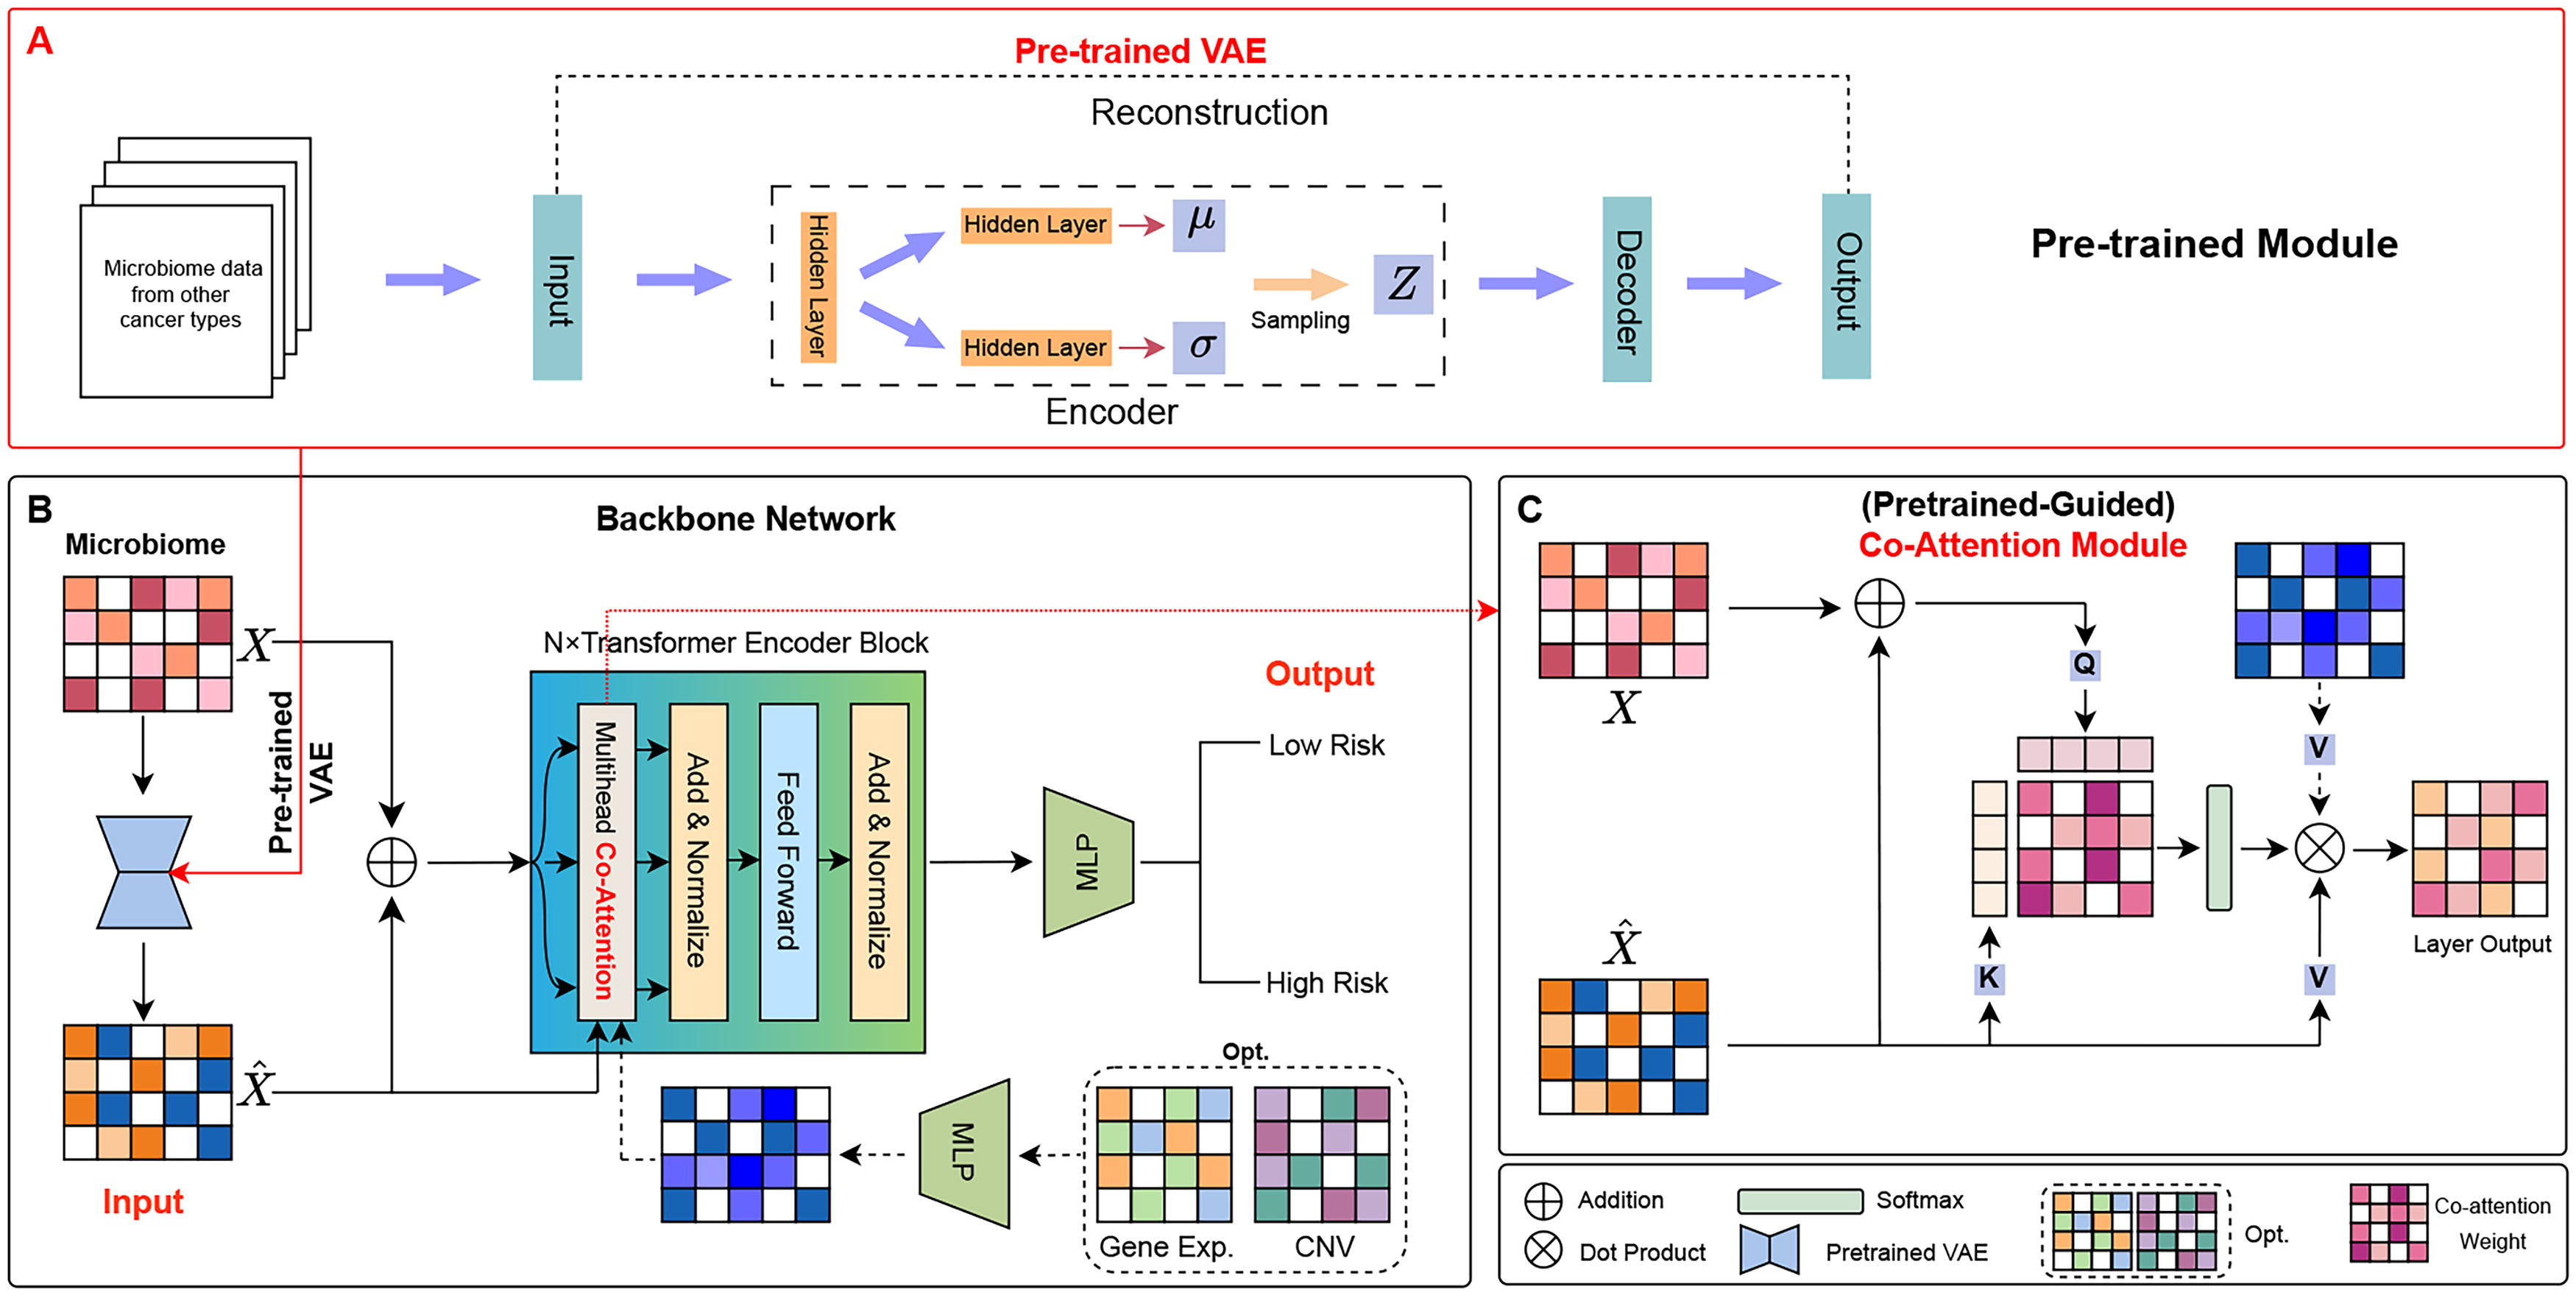
The network architecture of we propose VTrans method mainly includes two parts,
Initially, we use pretrained VAE model to reconstruct the original data. Following reconstruction, the reconstructed data features containing the latent distribution and representation of the data are integrated with the original data and it is also introduced as an additional condition into the attention module. Subsequently, feature reconstruction is performed using cross co-attention encoder. Ultimately, these features are output by a classifier for predicting survival risk.
The VTrans model integrates VAE to preprocess the microbiome data. The VAE model includes an encoder and a decoder. Maintain consistency in structure and functionality with traditional model. Our main purpose in employing the VAE model is to capture the latent distribution and representation of data features.
Formally, given input data
Then the decoder obtains a sample,
The loss function consists of two components, reconstruction loss and KL divergence, respectively. Simultaneously training the encoder and decoder to minimize this loss. Reconstruction loss calculates the mean square error between the input data
After pretraining, we obtain microbial reconstruction data
After obtaining the enhanced representation data E, representing a set of n samples with d features. Use it as input data for the Transformer encoder.
Given the enhanced representation data E, we initially convert it into a sequence of d-dimensional embeddings
Next, we put B into a stack of N co-attention blocks with identical structure. Each block includes two sub-blocks: a multi-head co-attention and a position-wise fully connected feed-forward network. In the multi-head co-attention mechanism, each head learns to focus on the importance of different features and evaluates the importance of one feature compared to other features. It can be formulated as:
After multi-head co-attention, completing the residual connection through an addition, it is then normalized in the feature dimension through a layer of normalization.
In the position-wise fully connected feed-forward network (FFN), It mainly abstracts features through two linear transformations, connected by the activation function Rectified Linear Unit (ReLU) in the middle. It can be formulated as:
After FFN, through the same addition and layer normalization as before, the output result of a block is obtained.
For each block input, denoted as
Our model structure includes N Transformer encoder blocks, a continuous hierarchical structure that allows the model to learn more complex and abstract feature representations. For each block’s output, denotes
The output O of the N-th layer of the Transformer encoder,
To sum up, the main purpose of VTrans is to combine the ability of VAE to capture deep latent representations and the ability of Transformer hierarchical structure to effectively extract abstract features and measure the importance between features. Subsequently, the abstract features containing rich information are mapped to a two-dimensional vector space through a linear layer to accomplish patient survival risk prediction. Our method is striving to improve the accuracy of prognosis assessment and provide a tool for predicting survival risk for cancer patients.
We use the saliency map to measure the contribution of microbial to the patient survival status classification. This idea comes from saliency map in computer vision (Simonyan et al., 2013) and spatial domain-specific saliency map for genes (Zhang et al., 2023).
Specifically, given microbial data of a patient sample
Given a category of all patient samples
Evaluation metrics
We calculate several evaluation metrics for each dataset, which usually appear in the evaluation metrics for classification problems, including Accuracy, Precision (Positive predictive value), Recall, F1_Score (harmonic mean of recall and precision) and area under curve (AUC).
These evaluation metrics are defined as:
To verify the effectiveness of our model, we conducted tests on three TCGA cancer datasets, all of which were trained and tested in the same hardware environment. First, we compared the proposed VTrans method with traditional machine learning methods including logistic regression, support vector machine, random forest, decision tree. In addition, our method compared with different deep learning methods as follows:
DeepSurv (Katzman et al., 2018): This method originally used a three-layer neural network and a layer of COX proportional risk model for risk modeling. Based on this idea, we replaced the original loss function with cross entropy loss and replaced the COX-Layer with a simple linear layer for binary classification. DeepMicroAE (Oh and Zhang, 2020): This method involves reconstructing input data using an autoencoder and making predictions base on the learned latent representation of the data. DeepMicroVAE (Oh and Zhang, 2020): This method utilizes the principles of the VAE model to reduce the dimensionality of features and input the dimensionality reduction data containing the latent distribution of features into the linear layer of the last layer for classification. MOGONET (Vaswani et al., 2017): This approach employs a deep autoencoder to reduce dimensionality. The risk prediction is derived from the representation produced by the deep autoencoder. DSSA (Aslam et al., 2021): This method integrates multi-omics data using graph convolutional networks to generate a risk prediction.
In our experiments, we tested our proposed model on three different datasets. In these datasets, VTrans consistently outperforms most existing methods, achieving state-of-the-art performance (Table 2). In order to better explore which module has the greatest impact on the model performance, we also conducted some ablation experiments.
Comparison with Baseline Methods on the Three TCGA Cancer Datasets by Averaging over 10 Trials
The bold data indicates optimal performance.
DT, decision tree; LR, logistic regression; RF, random forest; SVM, support vector machine.
To verify the discriminative ability of our model for patients with different survival states, We selected five deep learning methods from baseline model for comparison. We illustrate the model predictions for the survival analysis of cancer patients across various datasets using Kaplan–Meier (KM) curves (Fig. 2). The log-rank test p-value is employed to quantify the extent of differentiation between the two curves, with a smaller value indicating a higher level of discrimination. In other words, the lower the value, the better the model performs.
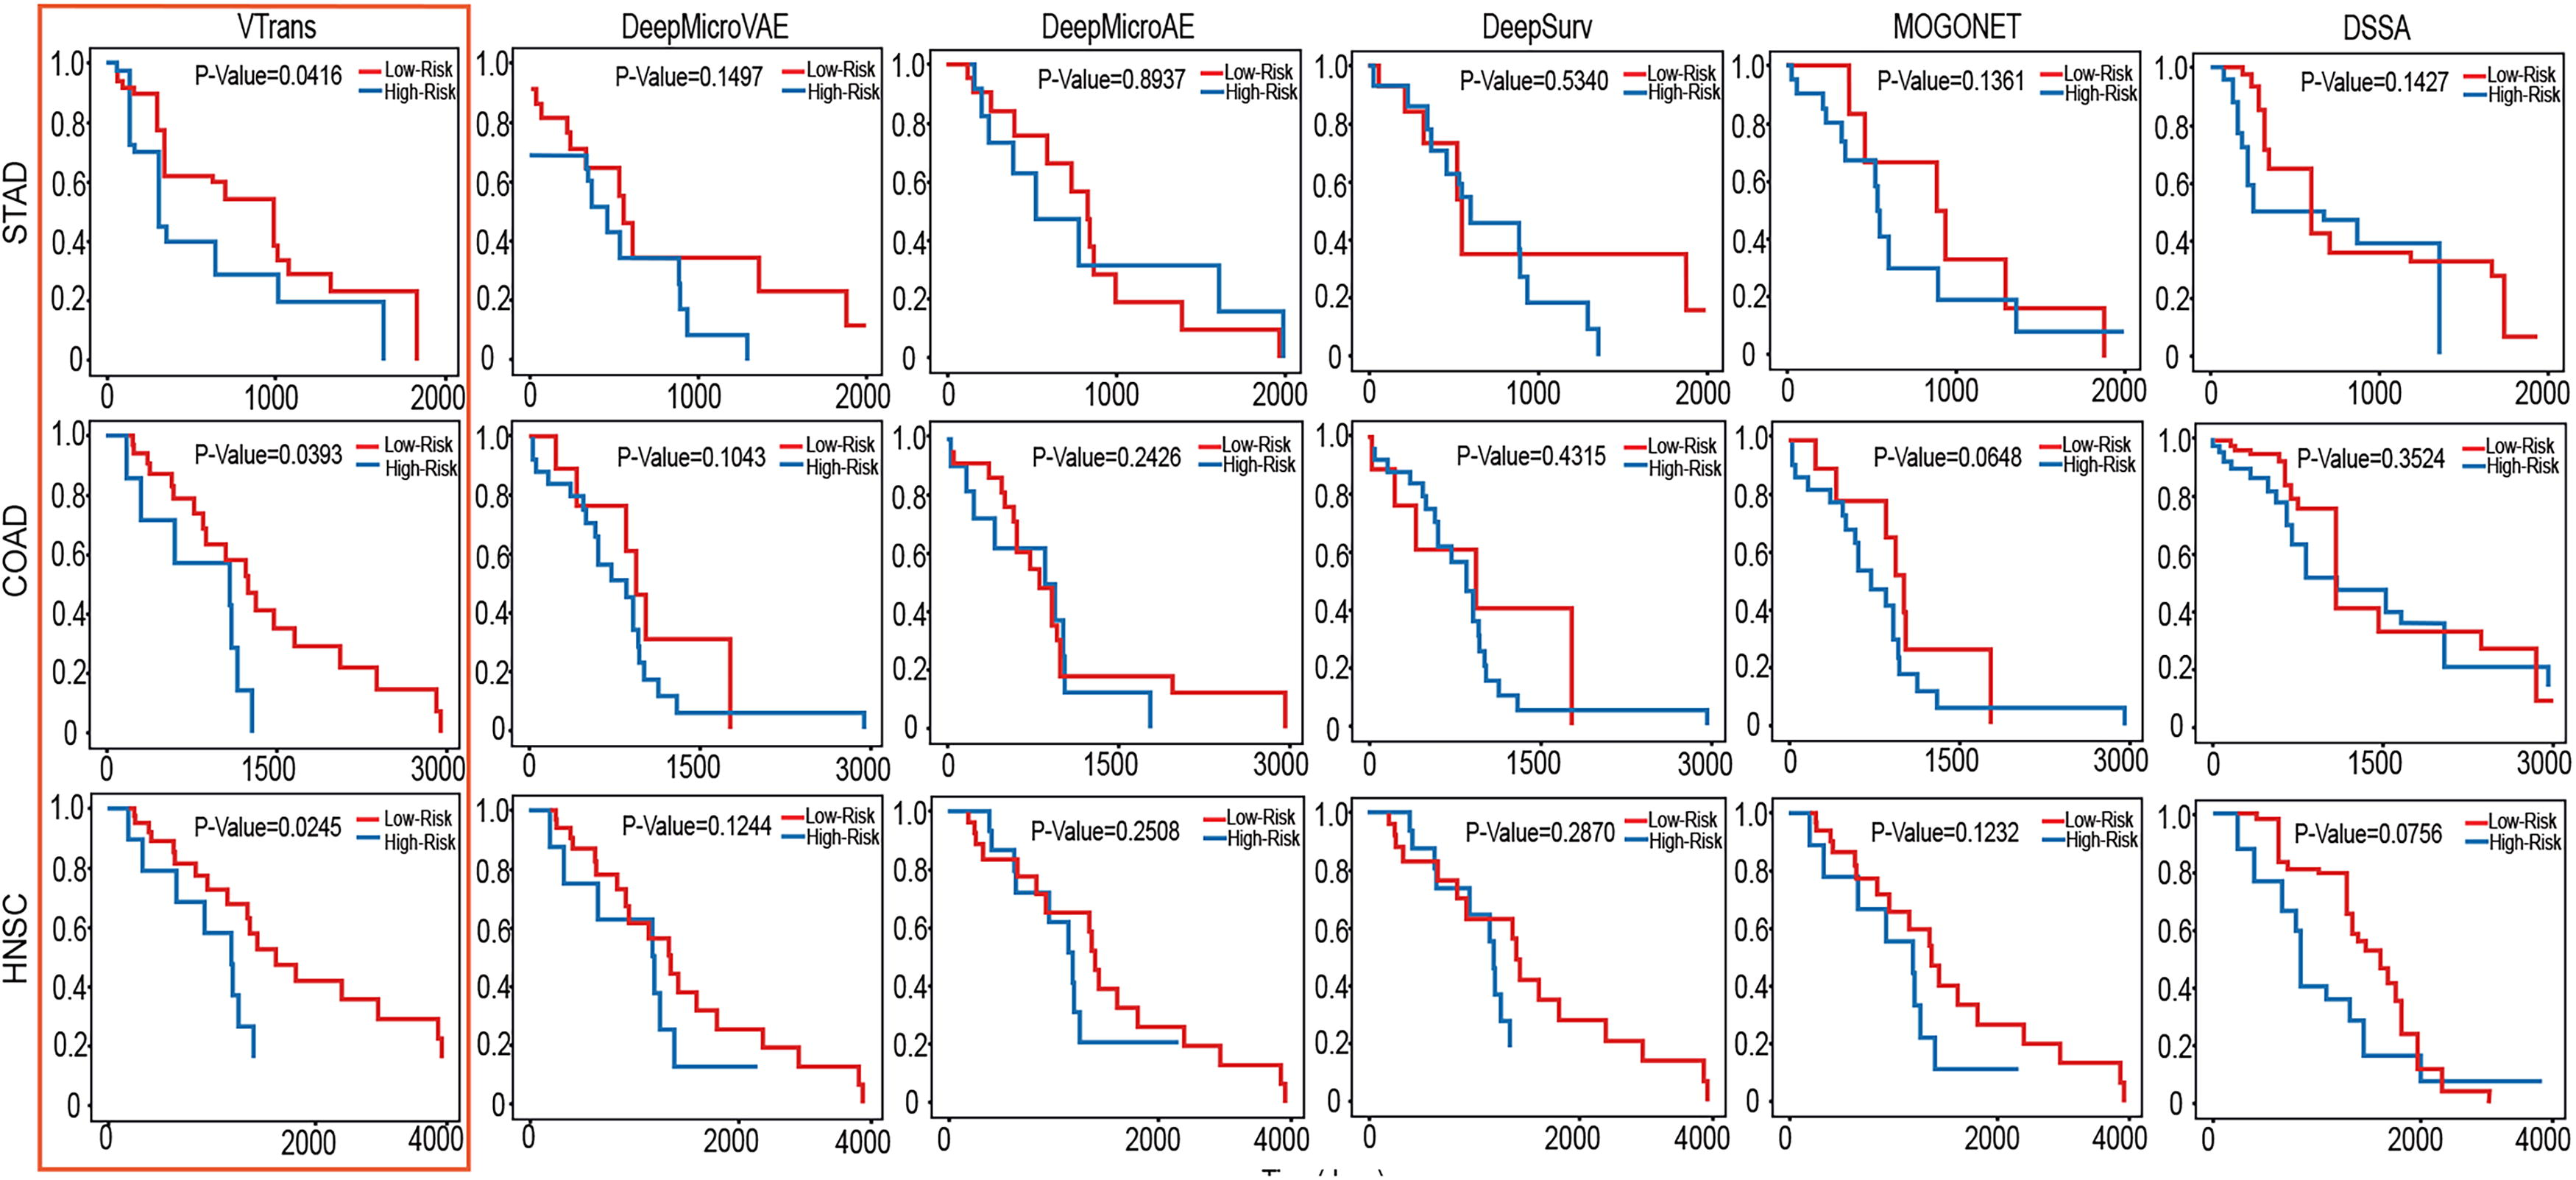
Kaplan–Meier curves for prognosis prediction of three cancer datasets. Our proposed method predicts long-term and short-term survivor categories, and compared with the other five deep learning methods.
The details shown in the KM plots indicate that our method performs best across all three datasets, with p-values under 0.05, signifying significant survival differences between KM curves. On the STAD dataset, our method achieved a p-value of 0.0415, compared to the next best, MOGONET, at 0.1361. In the COAD dataset, our p-value reached 0.0393, while MOGONET followed with 0.0648. For the HNSC dataset, our p-value was 0.0245, with the next best method, DSSA, at 0.0756. It is clear that our model typically performs similarly or better in distinguishing between long-term and short-term survival patients. It also proves that our model has certain advantages over other methods in predicting the long-term and short-term survival of cancer patients. Based on the performance evaluation (Table 2), overall, our model has better accuracy, discrimination and predictive ability.
Since the small sample size of microbial data in most cancer datasets in the TCGA database, training the model solely with a single cancer dataset cannot achieve the expected goals and effects. Therefore, we introduced pretraining method to improve the overall performance of our model. In order to verify that pretraining can improve our model performance, we conducted comparative experiments on the VAE encoding part of the VTrans: (1) Pretraining using microbial data on other type cancer datasets and conduct experiments on a separate dataset (this dataset did not appear in the pretraining phase); (2) Without pretraining, use a separate dataset for model training and evaluation.
The results (Table 3) showed that using pretraining significantly improved the performance of the model. This also proves that pretraining can effectively address the objective factor of a small sample size in the datasets. It is worth mentioning that we searched for relevant microbiome data pretraining parameters in the Hugging Face open-source database (https://huggingface.co/) but were unable to download them due to network issues. However, our experiments have fully demonstrated the effectiveness of the pretraining approach. We firmly believe that utilizing parameters pretrained on large-scale data would further enhance and improve the performance of the model.
Ablation Experiment on Comparing VTrans with Pretrain and without Pretrain by Averaging over 10 Trials
Ablation Experiment on Comparing VTrans with Pretrain and without Pretrain by Averaging over 10 Trials
The bold data indicates optimal performance.
In a conventional Transformer model, the self-attention mechanism lacks inherent positional information for the words in the input sequence, making it unable to directly capture the order relationships within the sequence. To address this, a combination of sine and cosine functions is used to create fixed positional encodings. However, for the specific task of our experiment, the input order of features is not our main focus. Our main target is to enrich the characteristics of the input data and enhance the feature expression of the data. So we introduced VAE encoding, which utilizes the characteristics of the VAE model to learn the hidden distribution of input data, obtain a hidden representation of the data, and then add it to the original data to generate an enhanced representation of the data. To evaluate whether the VAE encoding in the model has any implications for model performance, we conducted comparative experiments while keeping other factors unchanged: (1) Adding VAE encoding; (2) Without VAE encoding.
The results (Table 4) demonstrate that compared to the original position encoding method, our model VTrans performs significantly better than traditional position encoding methods.
Ablation Experiment on Comparing of VAE Encoding and Position Encoding in the VTrans by Averaging over 10 Trials
Ablation Experiment on Comparing of VAE Encoding and Position Encoding in the VTrans by Averaging over 10 Trials
The bold data indicates optimal performance.
VAE, variational autoencoder.
In Transformers, there are various attention mechanisms, with the most traditional being self-attention. To fully leverage the characteristics of data reconstructed by VAE, we employed co-attention mechanism in VTrans. This mechanism uses different input data to compute the queries and key-value matrices in the attention mechanism, more effectively combining data information to enhance model performance. To validate that co-attention is more suitable for our task, we conducted ablation experiments: (1) using self-attention as the backbone, (2) using parallel co-attention as the backbone, and (3) using cross co-attention as the backbone.
From the results (Table 5) shown in the table, it can be observed that compared to the traditional self-attention mechanism in Transformers, co-attention outperforms self-attention in performance evaluation across all datasets. This highlights the importance of additional conditions and the interaction between them. Additionally, the multi-head co-attention approach, compared to single-head cross co-attention, allows the model to explore the relationships between multiple modalities in parallel across different subspaces. This capability enables the model to better capture complex multimodal interactions while leveraging the parallel computation characteristic of multiple heads, thereby enhancing expressiveness and robustness of the model.
Ablation Experiment on Comparing of Different Approaches to co-Attention in the VTrans by Averaging over 10 Trials
Ablation Experiment on Comparing of Different Approaches to co-Attention in the VTrans by Averaging over 10 Trials
The bold data indicates optimal performance.
The influence of different microbes may vary across stages of cancer. Identifying certain signature microbes in patient groups with different risk profiles could greatly aid in clinically assessing patient progression risk. To screen for these signature microbes in patients with varying risk levels, we calculate the contribution values separately from high-risk patients and low-risk patients. We sorted the top 100 microbes in ascending order of score. For the convenience of understanding, we selected the top 50 microbes from 100 to draw a scatter plot of the score, and then selected the top 20 from the 50 to draw a heatmap of the score (Fig. 3). From the graph, it can be seen that different microbes have different contribution values to different classifications.

The microbial contribution values heatmap. The numbers appearing in the line chart represent the identifiers of different microbes, with each number corresponding to detailed information about a specific microbe. The detailed information can be downloaded from the provided dataset link.
To validate microbial contributions to classification, we selected one microbe from the top 80 contributing to high- and low-risk performance across three cancer types and plotted KM curves for patient survival analysis (Fig. 4).

Microbial content for predicting the risk of survival. The first line represents a microorganism selected from those that have a significant impact on high-risk group. The second line represents a microorganism selected from those that have a significant impact on low-risk group. It can be seen that the content of these microbes has a clear discriminative a significantly different on the survival status of patients.
The two graphs (Figs. 3 and 4) suggest that the saliency map method effectively screens microbial contributions to patient survival analysis. Understanding these contributions can aid in medical diagnosis, providing valuable insights into patient survival cycles and statuses, particularly for cancer diagnosis and treatment.
The main function of the Transformer encoder is the feature reconstruction, transforming features into richer representations with more information. In this study, we employed a multi-head co-attention mechanism as the backbone network of the encoder, which allows the model to explore relationships between multiple modalities in parallel across different subspaces, enhancing its ability to capture complex multimodal interaction information. Generally speaking, the more complex the model, the more information it can learn, and the more stable its performance tends to be. To verify whether increasing the number of Transformer encoder layers could improve performance, we conducted relevant experiments.
As shown in graph (Fig. 5), there is a trend between the number of encoder layers and model performance: initially, performance improves with an increasing number of layers. However, after a certain point, model performance begins to decline, which may be due to overfitting caused by insufficient data complexity, leading to decreased model performance.
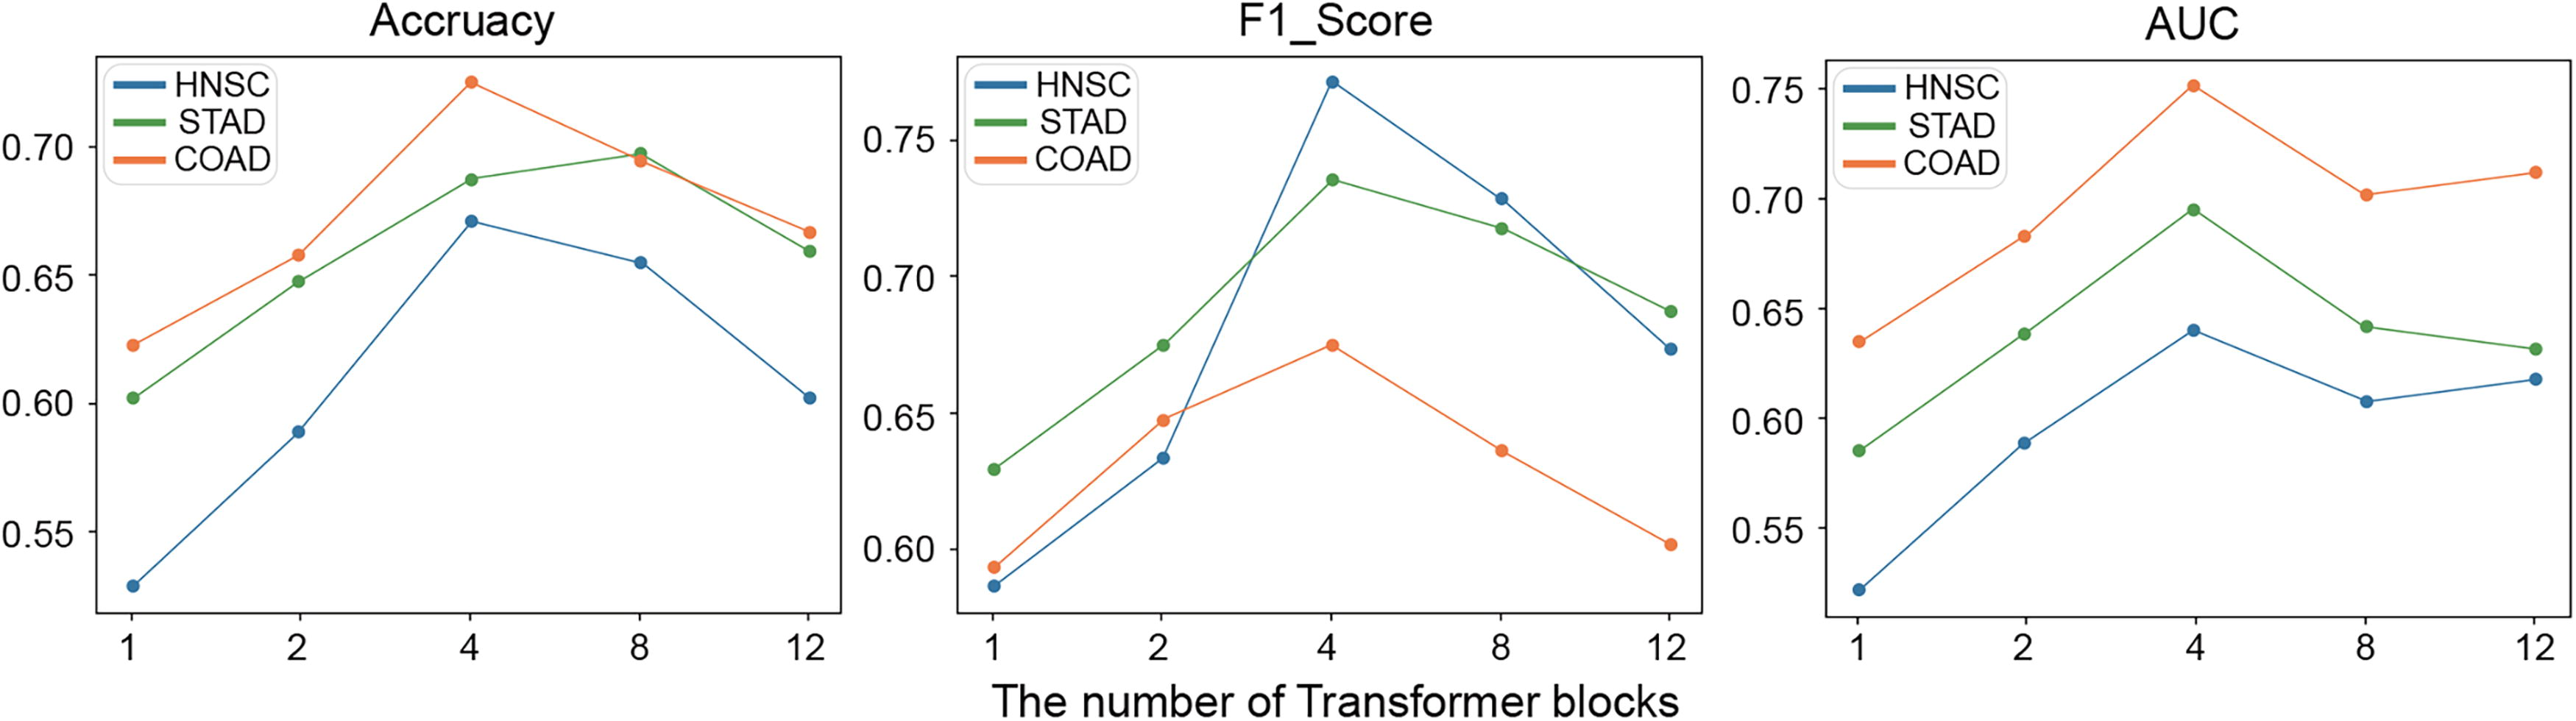
Line chart illustrating the impact of the number of Transformer blocks on model performance, using Accuracy, F1_Score, and AUC as evaluation metrics. As shown in the figure, the performance initially improves with the increase in the number of blocks. However, after reaching a certain point, the performance of model starts to decline, which may be due to overfitting. AUC, under area curve.
The use of multimodal data has become one of the primary directions in cancer research. The integration of microbial multi-omics data is crucial for gaining a comprehensive understanding of complex biological systems. By combining data from various sources—such as CNA, Gene Expression, and Microbiome profiles—we may uncover interactions and relationships that single-modality analyses may overlook. It is possible to enhance the performance of deep learning models from multiple perspectives.
VTrans can be expanded for integrating microbial multi-omics data, which holds promise for improving performance in survival analysis through effective multimodal integration. In the VTrans framework, we incorporated an optional offline multimodal window into the backbone network (Fig. 1B), which allows for the inclusion of additional modalities as extra input using “Multihead Co-Attention” module.
We conducted a performance evaluation of VTrans for integrating microbial multi-omics data in three cancer types. We assessed the contribution of each modality on model performance using metrics such as Accuracy, Precision, Recall, F1_Score, and AUC. As observed in the figure (Fig. 6), the model performance significantly improves when other modalities are integrated, compared to the unimodal scenario. Notably, when CNA and gene expression data were integrated, all metrics showed significant improvement. We speculate that the increase in interactive information enabled the model to better learn data features, resulting in more accurate analysis. Additionally, as microbial data is progressively integrated with other omics data, the performance of VTrans continues to improve across three datasets. This directly highlights the importance and research potential of multimodal data.
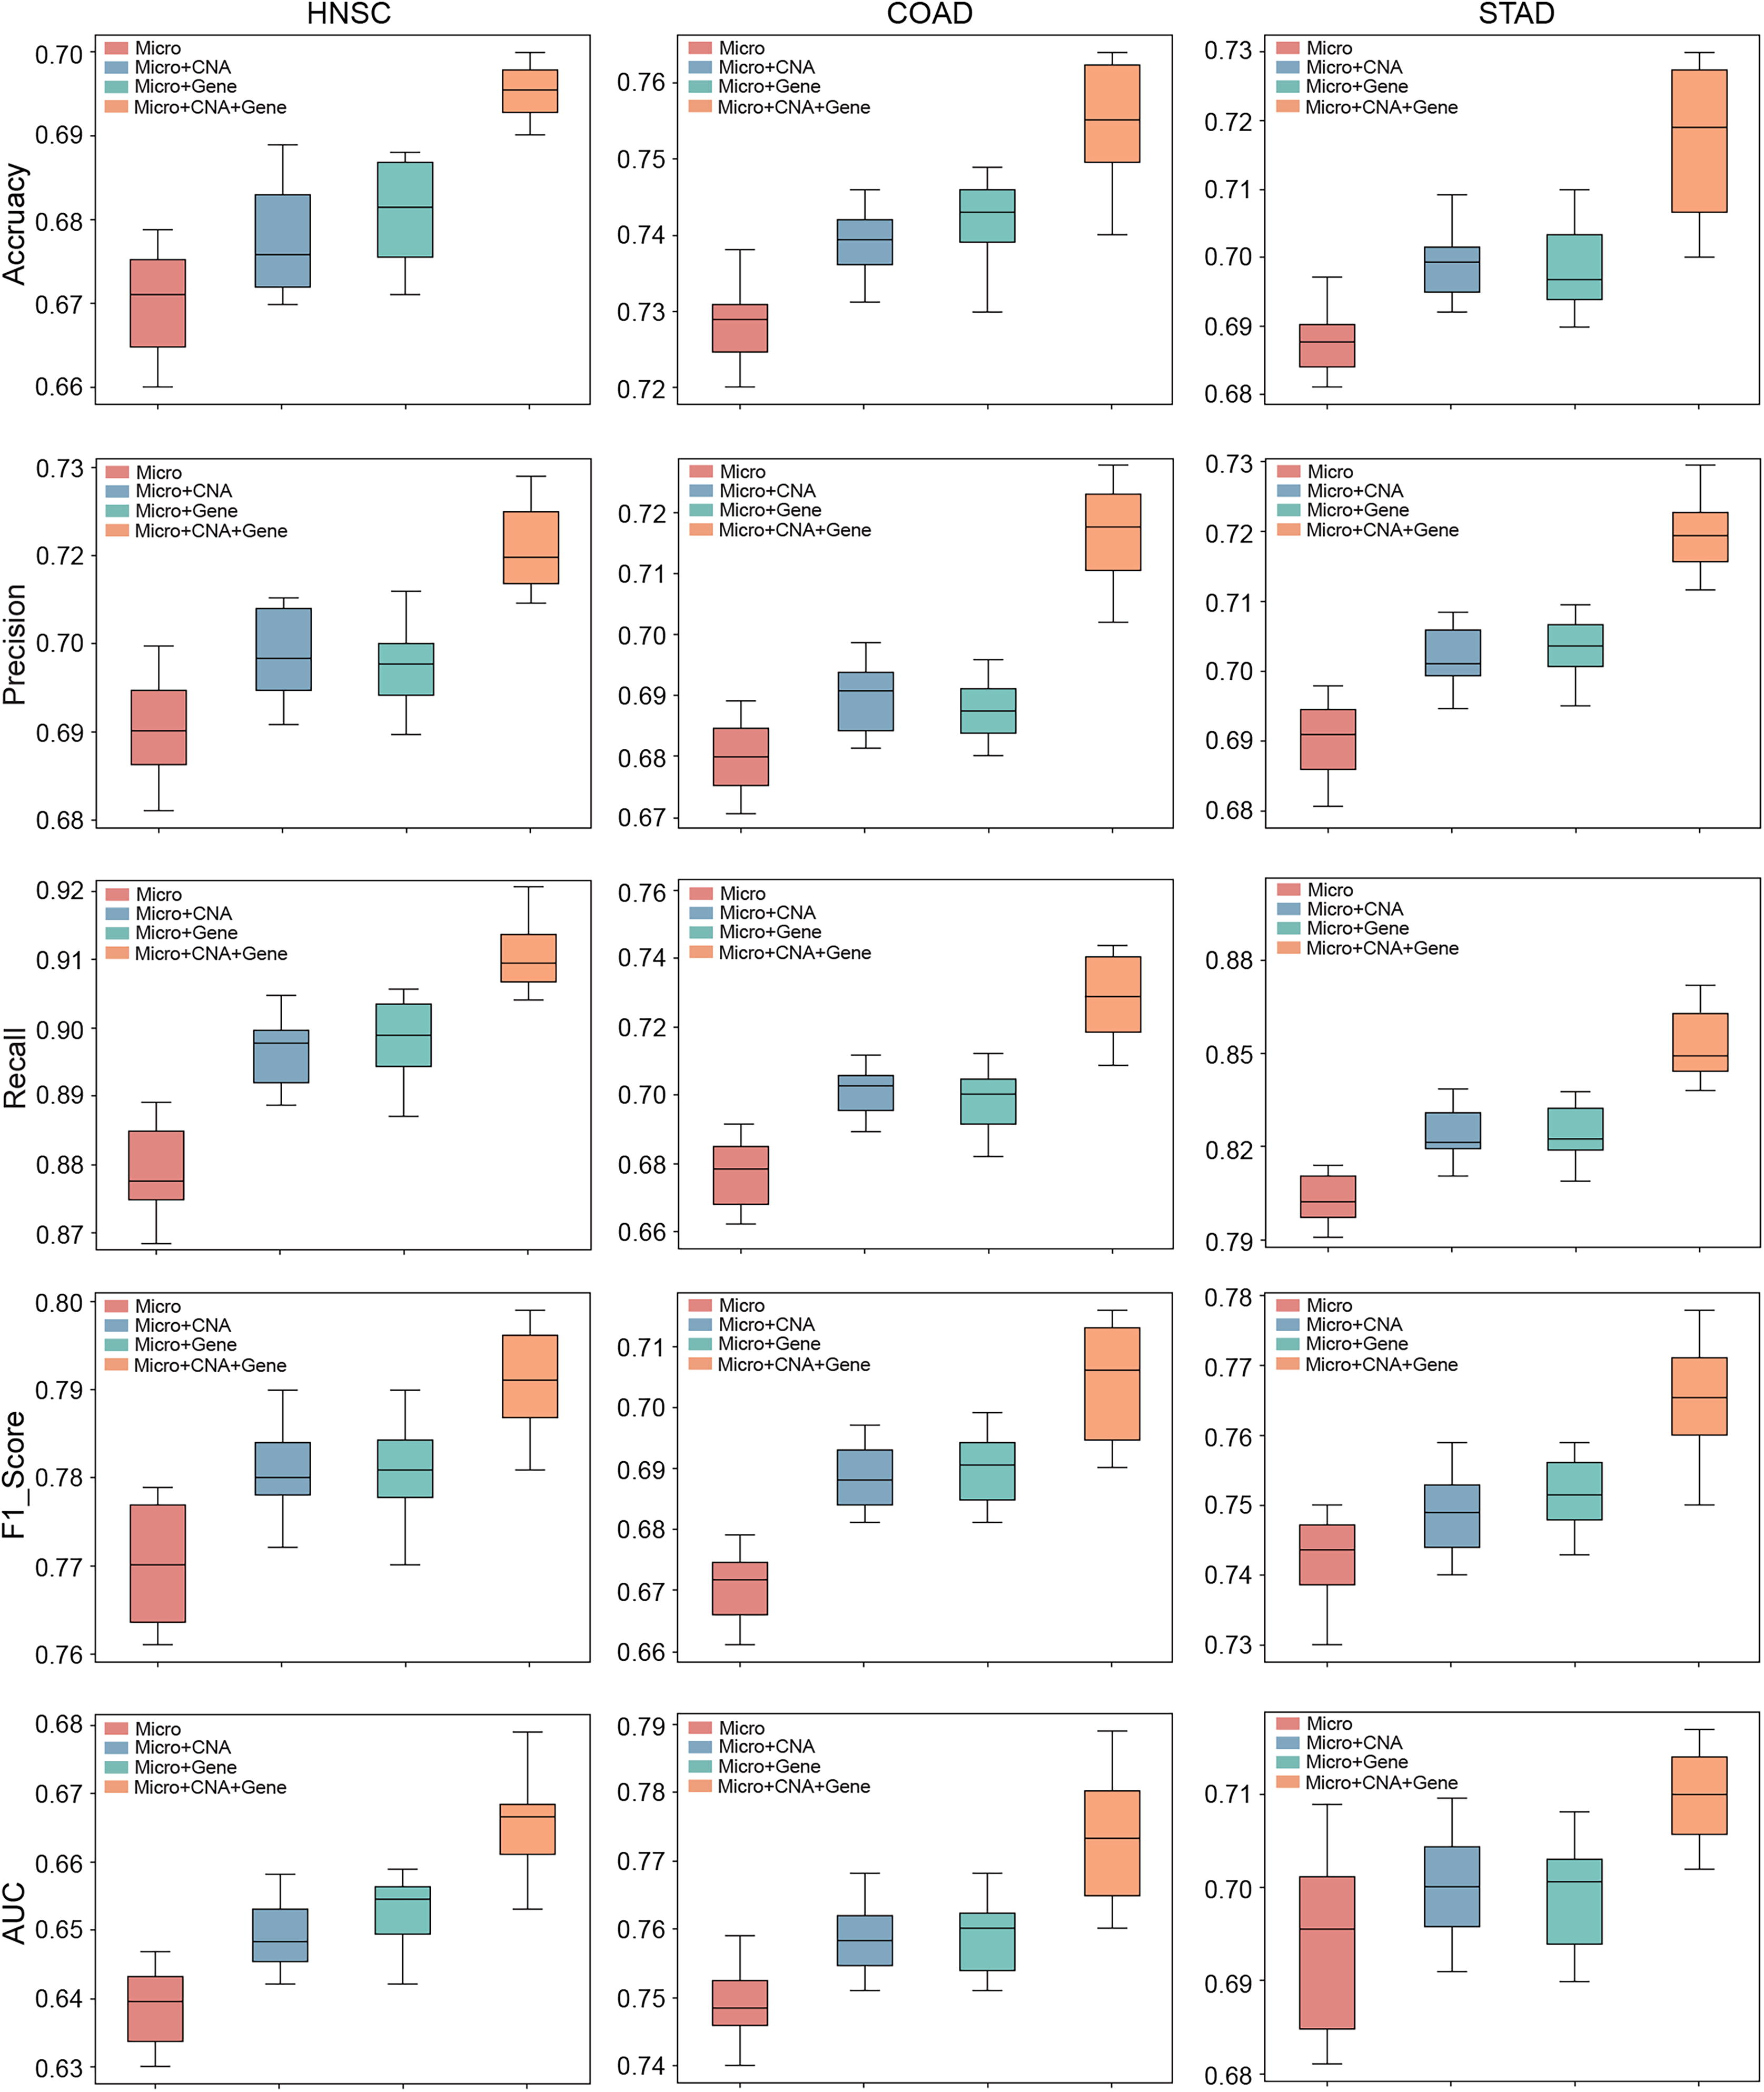
Performance evaluation of VTrans in integrating microbial multi-omics data. We analyzed the contribution of each modality—CNA, Gene Expression and Microbiome—to model performance using Accuracy, Precision, Recall, F1_Score and AUC metrics. CAN, copy number alterations.
In our research, we presented a VAE-based pretrained transformer method for microbiome data analysis. Our method combines the ability of VAE to learn latent representation of data and the excellent ability of Transformer encoder to extract features layer by layer in depth, and combined with saliency map in computer vision, the importance of microbiome species for cancer patient survival analysis was calculated.
The experimental results show that our model outperforms the other nine baseline models in three types of TCGA cancer, effectively discerning diverse survival periods among cancer patients. Ablation experiments reveal that the importance of pretraining in small samples training, the performance of the model using VAE encoding is better than that using traditional positional encoding, different attention backbone networks are suited to different specific tasks and multimodality has great potential for enhancing model performance. In addition, we introduced saliency map to calculate and evaluate the importance of microbiome species in the survival analysis of cancer patients. Experimental results show that this method is great significance for cancer diagnosis a treatment and for patient survival analysis.
Despite the advances achieved, several challenges remain unaddressed. It is worth noting that overfitting remains one of the importance issues in model training, especially when handling high-dimensional and low-sample biological datasets. Especially when the dimension of the feature space is much higher than the sample size of patients, the overfitting problem will continue to deepen. Solving these issues is crucial for future development.
Although VTrans improves the accuracy of survival analysis for cancer patients compared to many existing methods, there is still significant potential for expanding the experiments. Conducting survival analysis using only single microbiome data is somewhat limited, as most recent studies focus on multimodal data. While our method briefly explores multimodal data, the integration approach is relatively simplistic. Therefore, incorporating multimodal data through more sophisticated fusion strategies represents a promising direction for further research. Additionally, regarding the choice of backbone networks, although VAE demonstrated good performance in our experiments, other generative models, such as GANs and diffusion models, could potentially enhance performance and are worth exploring (Choi et al., 2023; Li et al., 2024a; Li et al., 2024b).
Footnotes
AUTHORS’ CONTRIBUTIONS
X.S.: Data curation, software, visualization, writing—original draft preparation. F.Z.: Data curation, writing—original draft preparation, writing—review, and editing. W.M.: Conceptualization, methodology, writing—review, editing, and supervision.
AUTHOR DISCLOSURE STATEMENT
The authors report no conflict of interest.
FUNDING INFORMATION
The work was supported in part by the National Natural Science Foundation of China (Grant No. 62262069), Scientific Research Fund Project of Yunnan Education Department (Grant No. 2025J0735), Yunnan Fundamental Research Project (Grant No. 202301AT070230), and Young Talent Program of Yunnan Province (Grant No. C619300A067).