
Abstract
Protein pockets are essential for many proteins to carry out their functions. Locating and measuring protein pockets, as well as studying the anatomy of pockets, helps us further understand protein function. Most research studies focus on learning either local or global information from protein structures. However, there is a lack of studies that leverage the power of integrating both local and global representations of these structures. In this work, we combine topological data analysis (TDA) and geometric deep learning (GDL) to analyze the putative protein pockets of enzymes. TDA captures blueprints of the global topological invariant of protein pockets, whereas GDL decomposes the fingerprints into building blocks of these pockets. This integration of local and global views provides a comprehensive and complementary understanding of the protein structural motifs (niches for short) within protein pockets. We also analyze the distribution of the building blocks making up the pocket and profile the predictive power of coupling local and global representations for the task of discriminating between enzymes and nonenzymes, as well as predicting the enzyme class. We demonstrate that our representation learning framework for macromolecules is particularly useful when the structure is known, and the scenarios heavily rely on local and global information.
INTRODUCTION
Proteins are biological macromolecules responsible for carrying out many of the essential functions of cells. Understanding protein function remains a fundamental aim to understand life at the molecular level. Although the availability of protein sequence and structure information has grown exponentially, the experimental determination of the function of a protein is still limited by time and cost. To address this limitation, a variety of computational methods have been developed to predict protein function (Zhou et al., 2019). The key to these computational approaches is to infer protein function by finding proteins with similar sequence, structure, or other characteristics. For example, the shape and properties of the protein surface determine what interactions are possible with ligands and other macromolecules (Coleman and Sharp, 2010).
Among the multiple elements of protein structures, voids, pockets, and channels are important features of the protein surface; thus, they play a crucial role in many protein functions (Liang et al., 1998). For example, locating and measuring protein pockets and cavities has been shown to be useful for computer-aided drug design (Stank et al., 2016). Furthermore, studying the anatomy of protein pockets and cavities with geometry and topology helps us understand the shape and topological niches, referred to as protein structural motifs (Tian and Liang, 2018).
Toward this goal, a natural approach is to use topological data analysis (TDA) for capturing the global information within protein structure data (Chazal and Michel, 2021). For example, persistent homology (PH), a main workhorse of TDA, can represent macromolecules into persistent barcodes, diagrams, or landscapes as input to machine learning models (Bubenik and Dłotko, 2017). PH can also help reduce the structural complexity as well as preserve the topological invariant properties. Encoded features, including connected components, loops, voids, and other properties of higher order along with their persistence, are descriptors of global information in Euclidean space ℝ n . Traditional TDA-based methods cannot capture local structural information since topology studies properties of spaces that are invariant under any continuous deformation (Fasy and Wang, 2016). As a result, PH only captures changes of topological invariants and provides some persistence, which is not sensitive to homotopic shape evolution. Fortunately, recent efforts have aimed at addressing the shortcomings of TDA when it comes to the study of protein morphology. For example, Cang et al. (2015) proposed a topological approach for protein classification, while Kovacev-Nikolic et al. (2016) profiled the persistence landscapes of protein structures. Both studies demonstrated that TDA- and PH-based methods can be effectively used to analyze protein structures. In some cases, these studies have also shown that TDA-based approaches can even identify protein superdomains (Cang et al., 2015) or the patterns of maltose-binding protein (Kovacev-Nikolic et al., 2016). However, proteins with similar pocket shapes could have distinct functions. In addition, some key substitution of residues could alter the function or physicochemical properties to a large extent. Furthermore, in the case of enzymes, enzyme-substrate and intra-enzyme interactions should be included and modeled as they may carry critical information for binding affinity. Therefore, there is a need for methods that further incorporate biochemistry and biophysics information as a means to better understand enzyme structure–function relationships (Bourlieu et al., 2020).
To this end of integration of biochemical and biophysical features toward uncovering shapes and heterogeneous properties of structural data, an alternative approach involves the use of computational geometry such as geometric deep learning (GDL). GDL is an umbrella term for techniques aiming at generalizing deep neural models to non-Euclidean domains such as graphs, hypergraphs, manifolds, and so on. Compared with TDA, GDL is locally aware and gives us a zoomed-in view of the data while mapping it to the representation space coupled with domain knowledge (Atz et al., 2021). GDL can handle information beyond distance, mesh, shape descriptors, or curvature descriptors, including extended geometry-associated features such as node or edge labels, as well as different types of interactions, to name a few. In the context of proteomics, amino acid residues are the building blocks of proteins; thus, they are typically represented as nodes, while hyperedges are used to model the pairwise and higher-order relationships between interacting residues (Maruyama et al., 2001; Freudenberg et al., 2002; Ye et al., 2007). In the resulting hypergraph of an underlying protein (pocket) structure, both pairwise and higher-order residue interactions can naturally encode the conservation and “hyper-conservation” of the interacting residues (Ye et al., 2007). This “hyper-conservation” can only be captured by hypergraph-based approaches. Moreover, pockets with similar topology but different microenvironments caused by residue composition (e.g., charged, pH, hydrophilic, and hydrophobic) are likely to exhibit distinct binding affinity profiles. Therefore, GDL is a suitable approach for exploring these properties and revealing significant residue interactions in protein families derived from structural and functional constraints. Finally, GDL is also able to make complementary contributions to the structure profiles obtained by TDA.
Inspired by recent efforts that have shown that global structural topology and local geometry refinement can have mutual benefits toward protein pocket mining (Roy and Zhang, 2012; Swenson et al., 2020), we combine TDA and GDL to analyze putative protein pockets of enzymes. For a ligand-binding pocket, the initial motivation for PH was to shape the structures of the protein–ligand complexes. Capturing the appearance and disappearance of topological features successfully quantifies shapes and sizes. Recent efforts in GDL have also been made to improve the molecular descriptors of protein–ligand complexes by mining distributive patterns (Saha et al., 2019). Therefore, in this work, we study the topological invariants using the PH method, as well as the distributive information of the pockets using a fully labeled hypergraphlets (Lugo-Martinez et al., 2021) and feed neural network learners to find niches (Huang and Yang, 2021; Carrière et al., 2020).
Contributions
Given the success of TDA and GDL within the proteomics space, we hypothesize that the combination of TDA and GDL will reveal niches of protein binding pockets by leveraging the quantitative power of top-down and bottom-up representations. In particular, the contributions of this work are listed as follows: (1) we show that GDL successfully decomposes pocket blueprints into quantifiable “hyper-conservation” features, whereas TDA captures the global topological invariant of pockets in terms of structure. The combination of both views gives us a comprehensive and complementary understanding of the niches within the space of protein pockets, (2) we analyze and evaluate the efficacy of integrating local and global representations for discriminating between enzymes and nonenzymes, as well as predicting enzyme classes. Furthermore, we show that these predictions are supported by enzymology, and (3) we construct a novel representation learning framework for proteins. This framework is particularly useful when the structural information is known, and the downstream task is heavily based on local and global information.
Related work
Multiparameter persistent homology
Multiparameter persistent homology (MPH) is an extension of the PH of a single filtered space. As an active area of TDA, MPH can capture the topological invariants of interest by considering the multifiltered space. MPH provides and calculates (n-parameter) persistence modules (algebraic invariants of data), simply by applying homology field coefficients to a multifiltration (Botnan and Lesnick, 2022). MPH gives us insights to interpret and compare data at different types and scales simultaneously. For example, MPH has been used to study immune cell distributions with differing oxygenation levels (Vipond et al., 2021). In this work, we aim to apply MPH to protein pockets across different levels of pocket confidence.
Hypergraph kernels and hypergraph neural networks
Hypergraphs, a generalization of graphs, provide a flexible and accurate model to encode higher-order relationships inherently found in many disciplines. In particular, hypergraphlets, small hypergraphs rooted at a vertex of interest, have been successfully used to probe large hypergraphs, as hypergraphs can be thought of as being composed of a collection of independent hypergraphlets (Gaudelet et al., 2018; Lugo-Martinez et al., 2021). Furthermore, Lugo-Martinez et al. (2021) present a generalized algorithm for counting hypergraphlets as a means of defining a kernel method on vertex- and edge-labeled hypergraphs for analysis and learning.
To take advantage of the expressiveness of hypergraphs, researchers have tried to adapt graph neural networks (GNNs) to hypergraph neural networks (HGNNs) for graph representation learning. The challenge is how to learn powerful representative embeddings without losing such higher-order information. Huang and Yang (2021) proposed a unified framework for graph and HGNNs to unify the message passing process with minimal effort. The message passing in hypergraphs is shown to be as powerful as the one-dimensional generalized Weisfeiler–Lehman (1-GWL) algorithm in terms of distinguishing nonisomorphic hypergraphs (Böker, 2019).
Topological layers
Many studies have incorporated topological invariants for end-to-end learning with neural networks. Hofer et al. (2019) proposed the first topological layer using the idea of Gaussian transformation in persistence diagrams. They also proposed a novel type of readout operation to leverage PH computed via a real-valued, learnable filter function layer (Hofer et al., 2020). Another more comprehensive layer called PersLay for persistence and topological signatures was described by Carrière et al. (2020). PersLay is an end-to-end, differentiable framework for learning versatile PH descriptors in a neural network, which allows us to better understand the topological features of data in an automatic way. Various vectorization methods were used in PersLay for better learnable representations of persistent diagrams. Finally, Horn et al. (2021) proposed a topological neural network that is strictly more expressive than message passing GNNs.
METHODS
Background and notation
Here, we review the background on protein pockets, as well as some basic concepts and notations of TDA and GDL.
Protein binding pocket
As mentioned earlier, protein binding pockets (ligand binding sites or simply pockets) play an important role in protein function, as well as drug design. Pockets are regions with specific sizes, shapes, and physicochemical properties. On the contrary, ligands are specific small molecules that could fit into pockets and bind with host proteins. Different approaches have been used to predict ligand binding sites, including geometric-, energetic-, consensus-, template-, conservation-, and knowledge-based methods. A comprehensive review of these approaches is provided by Krivák and Hoksza (2018).
For simplicity, in this work, we treat a protein P of length n as a sequence of amino acid residues denoted as
Vietoris–rips complex
A simplex is a generalization of the notion of a triangle or tetrahedron to arbitrary dimensions. A k-simplex is a k-dimensional polytope that is the convex hull of its k + 1 vertices. A simplicial complex
A Vietoris–Rips complex consists of all those simplices whose vertices are at a pairwise distance less than or equal to r defined as:
In this work, we only consider the metric space (
Multiparameter persistence homology and landscape
Multiparameter persistence homology is an extension of (single-parameter) persistence homology (Vipond, 2020; Carriere and Blumberg, 2020). Formally, MPH is induced by a multifiltration function f: X → ℝ
d
. For any a, b ∈ ℝ
d
, we denote a ≺ b when ∀i, ai ≤ bi. Then, the sublevel sets Fr = {x ∈ X| f (x) ≤ r} satisfy Fa ⊆ Fb as long as a ≺ b. For a family of multiparameters r1, r2, ⋯, rn ∈ ℝ
d
, when ri ≤ rj, the sets
The multiparameter persistence landscape is similarly defined as:
The multiparameter persistence landscape considers the maximal radius over which k features persist in every (positive) direction of
Fully labeled hypergraphs
A hypergraph G is a pair (V, E), where V is the vertex set and E is a family of subsets of V called hyperedges. Any hyperedge e ∈ E is a nonempty subset of V and can connect any number of vertices. In a vertex-labeled hypergraph, a node labeling function fV is defined as fV: V → Σ, where Σ is a finite alphabet. Analogously, in a hyperedge-labeled hypergraph, another labeling function fE is defined as fE: E → Ξ, where Ξ is also a finite alphabet. Finally, a fully labeled hypergraph G is a 6-tuple (V, E, fV, fE, Σ, Ξ), where each node v ∈ V has a corresponding vertex label fV (v) ∈ Σ and each hyperedge e ∈ E has a corresponding hyperedge label fE (e) ∈ Ξ.
A hypergraphlet is a small (typically up to four nodes), simple, connected, rooted hypergraph (Lugo-Martinez et al., 2021). An n-hypergraphlet is a hypergraphlet of n nodes. Supplementary Figure S1 in the Supplementary Data shows all unlabeled hypergraphlets for n ∈ {1, 2, 3}.
From protein structures to hypergraphs
There is a long history of modeling protein structures using hypergraphs (Maruyama et al., 2001; Freudenberg et al., 2002; Ye et al., 2007; Zhang et al., 2022; Jiang et al., 2023). Previous studies have demonstrated the need for a hypergraph-based representation over a graph-based representation for accurately modeling protein structures across different tasks (Ye et al., 2007; Zhang et al., 2022; Jiang et al., 2023). In this work, we further expand previous work on hypergraph-based modeling of protein structures by encoding different types of bonds into the representation. In order to obtain hypergraph-based representations, protein structures were modeled as fully labeled hypergraphs G = (V, E, fV, fE, Σ, Ξ), where each amino acid residue was represented as a vertex, the vertex alphabet Σ was derived from the physicochemical properties of amino acids, hyperedges were defined by different combinations of bond or interaction types (e.g., hydrogen bond, spatial proximity, or electrostatic), and the hyperedge alphabet Ξ was derived by assigning a unique label to each biochemically possible combination of bond/interaction types. In the case of spatial proximity, for a given amino acid residue, we compute a sphere of a prespecified radius (6 Å in our case). Then, all residues within the sphere are considered spatially close. We summarize the vertex alphabets (Supplementary Table S1) and edge alphabet (Supplementary Table S2) used in this study in the Supplementary Data.
Datasets
In this work, we focus on the quantification of protein binding pockets from protein 3D structures. Binding pockets are highly related to protein functions, especially enzymatic functions (Stank et al., 2016). Therefore, we consider two enzyme-related biological tasks: (1) classification between enzymes and nonenzymes from protein structures and (2) prediction of the enzyme class from protein structures. For the former, we compiled two publicly available datasets: D&D and PROTEINS. D&D is a widely used dataset originally published by Dobson and Doig (2003), composed of 1178 proteins categorized as enzymes (691) and nonenzymes (487). PROTEINS (Dobson and Doig, 2003; Borgwardt et al., 2005) is another popular dataset of protein structures composed of 1128 proteins categorized as enzymes (665) and nonenzymes (463). For the latter task, we collected another publicly available dataset ENZYMES (Borgwardt et al., 2005). ENZYMES contains 600 protein structures listed in the BRENDA enzyme database (Schomburg et al., 2002). The proteins are further annotated based on the Enzyme Commission (EC) number, which is a numerical classification scheme for enzymes. In particular, the annotations are divided into six groups: Oxidoreductases (EC 1), Transferases (EC 2), Hydrolases (EC 3), Lyases (EC 4), Isomerases (EC 5), and Ligases (EC 6), respectively (McDonald and Tipton, 2023). In this multiclass classification task, we have 100 annotated structures for each group.
Identifying protein pockets
Let P be a protein structure of interest. We first predicted the binding pockets of P using P2Rank (Krivák and Hoksza, 2018), a software tool for the prediction of ligand binding sites from protein structures. Let
Learning pocket geometry on a hypergraph
As described in Section 2.2, we defined an improved representation of protein structures as fully labeled hypergraphs. This enriched hypergraph-based representation enables a more accurate modeling of the biochemical information within protein structures than the previous graph-based protein structure models (Lugo-Martinez et al., 2016).
Let G be a fully labeled hypergraph G = (V, E, fV, fE, Σ, Ξ) corresponding to protein structure P, and let
Then the count vector for each vertex is then normalized and fed into a message-passing HGNN as the initial embedding of vertices (
This process is repeated for the remaining putative pockets in

Global and local representation of a putative pocket for AONS of Escherichia coli.
Let
The filtration value for distance d ranges from 0 to the maximum diameter of all pockets by a step of 0.05 Å. The filtration value for pocket score k ranges from 0 to 1, but the steps are five quintiles of all residue-wise scores in the same protein. For those proteins with no or not enough putative pockets, we also treat the residues between each quintile (0, 0.2, 0.4, 0.6, 0.8, 1) of P2Rank scores as putative pockets. The final filtration value space is the Cartesian product of distance values and pocket scores. It is worth noting that we take all pockets together and use MPH to analyze the global topological information, which is different from the local information capture procedure described in the previous subsection.
Next, the persistence of our biparameter filtration is computed, and the persistence diagrams are obtained. The biparameter persistence diagrams are the input of a neural network with layers, Perslay, which is a unified topological layer that captures topological signatures. The unified operation toward a persistence diagram is given as:
Topological signatures are automatically calculated in a topological layer with different weights and transformation functions. In this work, we focus on the topological landscape. A constant weight w = 1 and a triangle point transformation
Finally, the final representation R for
Revealing niches by statistical analysis
The count vector representation provides a very useful distribution of fully labeled hypergraphlets to build the hypergraph, showing the frequency of higher-order interactions. To statistically analyze the enrichment of these interactions, we compare our hypergraphlet-based counting with the configuration model proposed by Chodrow (2020). Usually used as a null model, this configuration model builds random hypergraphs by holding constant node degree and edge dimension sequences but generates multiple configurations.
In this work, we extend the configuration model by adding both node labels from an alphabet Σ and hyperedge labels from an alphabet Ξ. In the null model, during sampling from the configuration, we randomly assign a node or edge label by its natural abundance. Taking a toy pocket with 3 residues and 2 interactions as an instance, we show it in Figure 2a. Consider the background abundance of node labels P, N, A are rP, rN, rA, and the background abundance of hyperedge labels D, A are
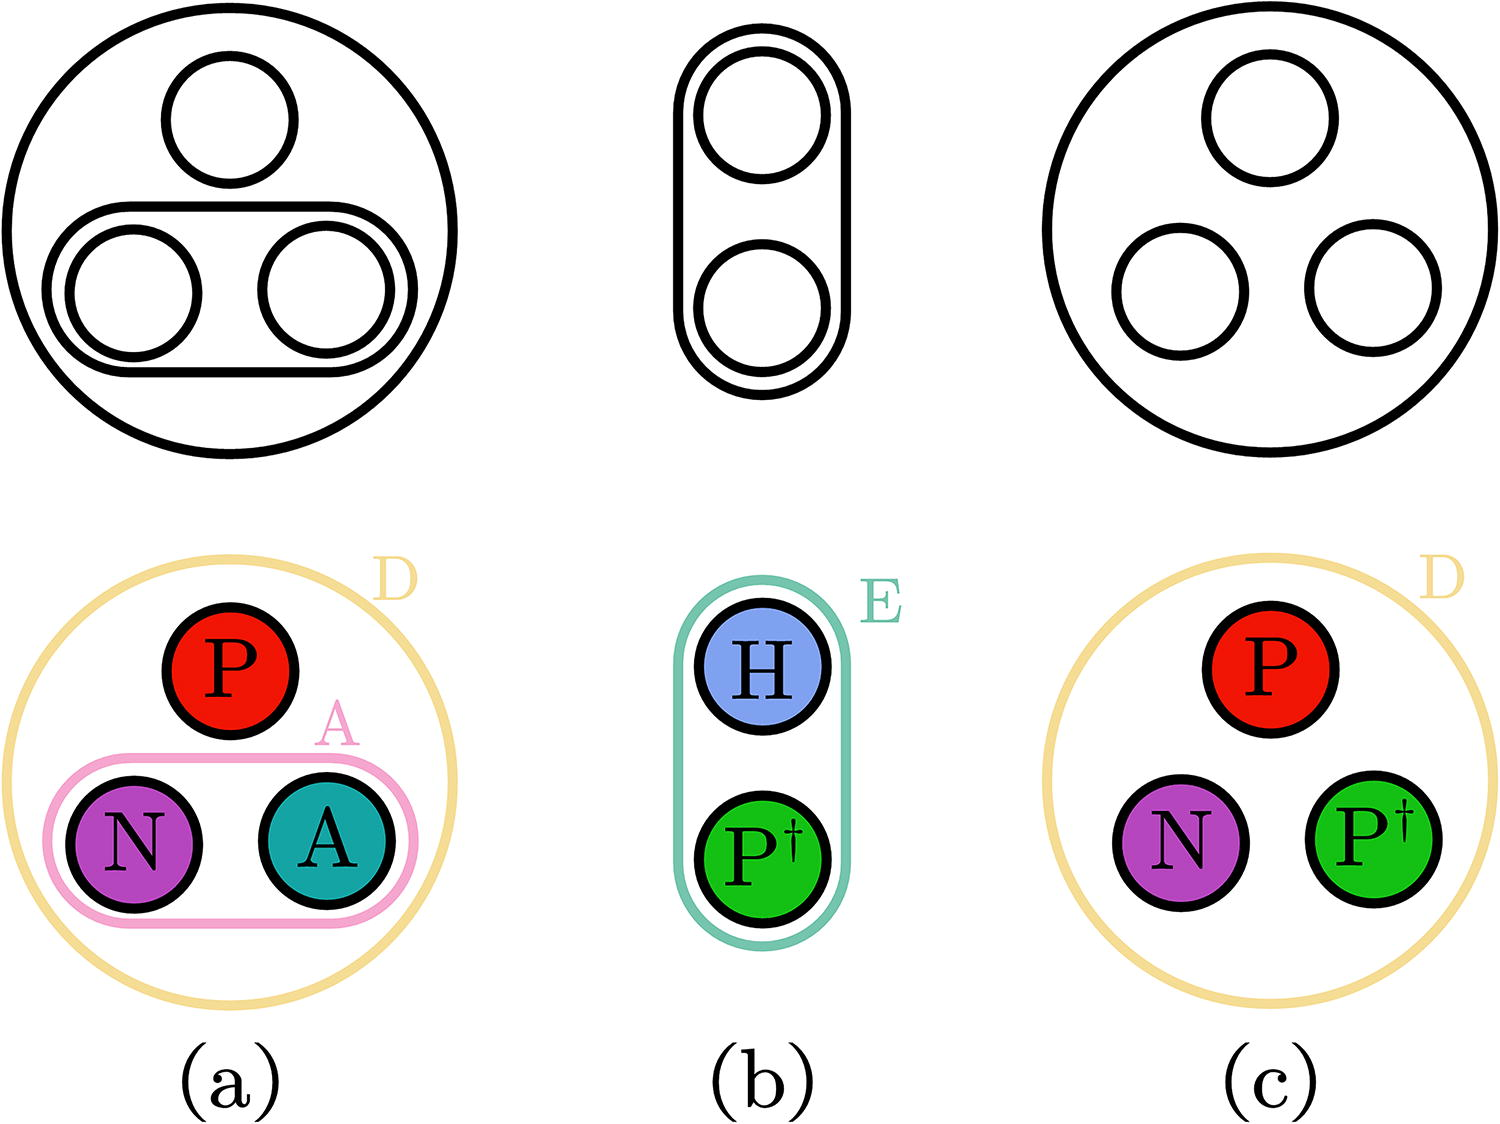
Examples of unlabeled hypergraphlets and fully labeled hypergraphlets. The string representation of each hypergraphlet is
where ℙ (Gunlabeled) is from the original hypergraph configuration model (Chodrow, 2020). The equivalence classes for unlabeled hypergraphlets are shown in Supplementary Table S3.
We sample from our fully labeled configuration model multiple times and compute the frequency of each motif. We then acquire the over/under expression of patterns by the difference between the observed count flet and the frequency sampled from the null model
Following Milo et al. (2004), we set the smoothing parameter ε = 4 to avoid unrealistic large values when flet and
The ensemble of over/under expression of all the nth higher-order motifs is called the hypergraph significance profile (HSP). Normalized HSP Δ
n
is the fingerprint of the local structure of the hypergraph (Lotito et al., 2022) and has the same length as the count vector
In this section, we describe the evaluation methodology across each prediction task. For the classification task using the D&D and PROTEINS datasets, we first systematically evaluate the performance based on different representations. In addition, to test the effects of global and local information, we evaluate the concatenated representations of global and local representations in isolation and in combination. To evaluate the impact of using different numbers of pockets, only the local and global representation in top k (k = 1, 2, 3, 4, 5) are preserved, respectively. To test whether our local representation improves prediction performance, we evaluate our methodology by measuring the performance of the proposed hypergraphlet-based embeddings across three state-of-the-art methods: GIN (Xu et al., 2018), MEWISPool (Nouranizadeh et al., 2021), and DDGK (Al-Rfou et al., 2019). For this comparison, the initial node features are one-hot encoding of 20 types of amino acids. We then replace it with our hypergraphlet, counting as initial node features. Next, we test if the accuracy is increased by adding global information to the corresponding model. This is accomplished by concatenating our global features to the output of each model’s final pooling or readout function but before the output layer. The dimensions are correspondingly modified.
For the enzyme class prediction task, we also test the effects of global and local information as well as the impact of using different numbers of pockets; however, we only report the performance based on top k (k = 1, 3, 5) putative pockets, respectively.
In the evaluation of each method, a 10-fold cross-validation is implemented, which means that in each iteration, 10% of the samples in the data were selected for the test set, whereas the remaining 90% were used for training. Shallow neural network was used to construct our predictors and perform comparative evaluation. Furthermore, we used PyTorch (Paszke et al., 2017), a highly useful automatic differentiation tool, with the default value of a linear layer. The Rectified linear unit (ReLU) activation functions were used. The model was trained using the backpropagation algorithm and the cross-entropy loss function. The initial learning rate was set to 0.05, whereas the decay rate was set to 0.99. The best model within 100 epochs was saved as the final one.
RESULTS
In the Results section, we first report the overall performance of our proposed framework on two function prediction tasks: classifying enzymes versus nonenzymes and predicting the enzyme class. Then, we evaluate both local geometric representation and global topological representation and their power of expressiveness. We extensively evaluate how the captured geometry and topological features are aligned and consistent with experimentally verified structures in biochemistry, including mechanisms based on spectroscopic, kinetic, and crystallographic studies (Webster et al., 2000). That is, we align local and global information with reference pocket properties of enzymology. Finally, we give a case study of topology and geometry.
Enzyme classification
To study the impact of learned representations, we evaluated the classification performance in the enzyme dataset (Dobson and Doig, 2003). Enzymes are special functional proteins that speed up the rate of a specific type of biochemical reaction. The place where the substrate binds is called the active site. Active sites are almost among the putative binding pockets (Dobson and Doig, 2003). Among the 1178 proteins in D&D dataset, 691 are enzymes and 487 are nonenzymes. After removing proteins with poor structures or without pocket predictions, we keep 1139 out of 1178 proteins distributed as 666 enzymes and 473 nonenzymes (Supplementary Table R1). We perform a similar screening process on the PROTEINS dataset and keep 1092 proteins of which 640 out of 665 enzymes and 452 out of 463 are preserved (Supplementary Table R2). Table 1 provides a summary of two enzyme classification datasets.
Enzyme Classification Dataset Summary
Enzyme Classification Dataset Summary
We first study the power of global or local representation in isolation. As shown in Table 2 and Figure 3, fully labeled hypergraphlets performed better than one-hot amino acid encoding (accuracy: 0.721 vs. 0.707). More importantly, enzymes are better identified by combining local and global representations (accuracy, combined: 0.761; global: 0.741; local: 0.721), where the best performance is achieved by integrating global information into hypergraphlet-based counts. Furthermore, we study the effect of the number of pockets. In Figure 3, we vary the number of pockets from the top 1 to the top 5 and compare the predictive accuracy. The global representation is always better than the local representation, except for the top 1 pocket. However, the combined representations outperform either representation in isolation. Overall, the best accuracy for three approaches is always achieved on the top 4 or top 5 pockets.
Classification Accuracy for Local and Global Representation on the D&D Dataset and PROTEINS Dataset
Mean and standard deviation of binary classification in a 10-fold cross-validation using shallow (five-layer) neural networks.
The bold data indicates the highest value for each dataset (column).
Topological landscape extracted by the operator kth max.
One-hot embedding as initial node features.
Hypergraphlet counting embedding as initial node features.
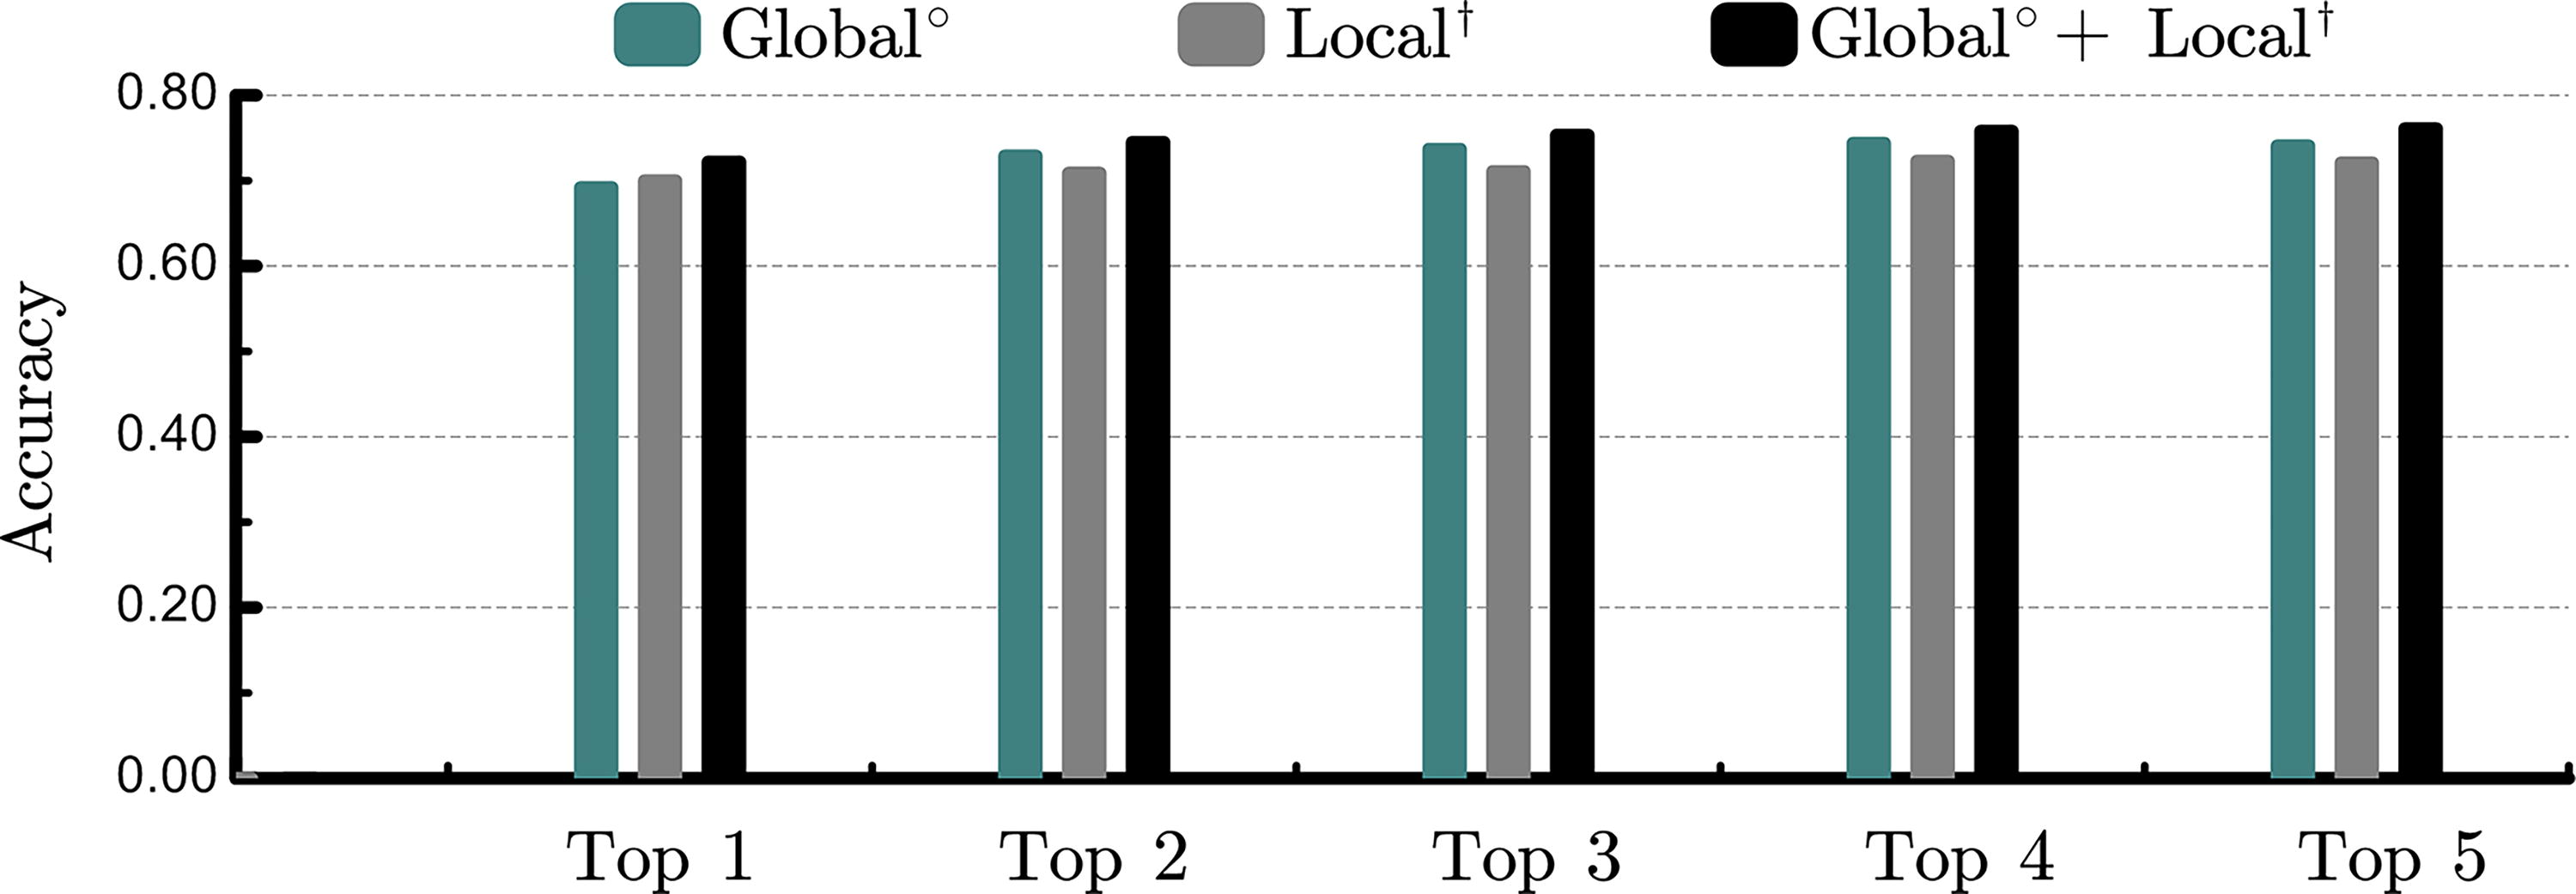
The performance comparison of different number of putative pockets. The values represent the mean accuracy-based one representation Global°, Local†, and Local† + Global°.
Then we evaluate our approaches with some state-of-the-art methods, which are based on kernels or GNNs. As shown in Table 3, the accuracy is better with the help of global representation. The highest average accuracy 0.865 is achieved by a GNN-based approach with maximum entropy weighted independent set, SetMEWISPool (Nouranizadeh et al., 2021) plus global feature. For another graph kernel-based deep learning method, DDGK (Al-Rfou et al., 2019), the best performance is achieved with one-hot embeddings instead of hypergraphlet counting. It might be due to the overuse of kernel tricks in both steps. We note that the global information surprisingly performs well and further improves the state-of-the-art models. These results demonstrate the advantage of our representation.
Classification Accuracy with Different Models and Representations on D&D Dataset
Mean and standard deviation of binary classification with or without topological features. Some performance of state-of-the-art methods is based on original 1178 proteins, whereas ours is based on 1139 proteins (Table 1).
The bold data indicates the highest value for each dataset (column).
Topological landscape extracted by the operator kth max.
One-hot embedding as initial node features.
Hypergraphlet counting embedding as initial node features.
NN, neural networks.
To comprehensively and robustly evaluate our framework, we predict the enzyme class using the ENZYMES dataset. Among the 600 enzyme structures, each class (i.e., EC numbers 1–6) has 100 structures. After filtering out proteins with poor structures or pocket predictions, we keep 597 out of 600. The resulting distribution of structures per class is shown in Table 4, and the detailed list of protein structures is provided in Supplementary Table R3.
Distribution of Structures in Six Enzyme Commission Number Classes of ENZYMES Dataset
Distribution of Structures in Six Enzyme Commission Number Classes of ENZYMES Dataset
EC, Enzyme Commission.
Table 5 shows the results for the task of predicting the enzyme class. Similar to enzyme classification, combining local and global representations significantly outperforms local- and global-only approaches across different number of top pockets. For example, for top 5 pockets, combining local and global representations (accuracy: 0.722) outperforms both local-only (accuracy: 0.683) and global-only (accuracy: 0.604). In this task, we also provide evidence that local representations outperform global representations. It shows that the number of pockets plays a central role in the prediction of the enzyme class, which is consistent with the functional bases and rational nomenclature of enzymes (McDonald and Tipton, 2023). Next, we compare our Local + Global results with other state-of-the-art methods for this task within the published literature: FGW sp (Vayer et al., 2018) is an optimal transport-based method that achieves an average accuracy of 0.712 on the same dataset. Depthwise Separable Graph Convolution Network (DSGCN) (Balcilar et al., 2020), another GNN-based method aware of spectral and spatial domains, achieved an accuracy of 0.784 on the same data for this prediction task. DSGCN also provides a spectral analysis of convolution frequency profiles, which can partially explain the predictive power.
Enzyme Commission Number Prediction Accuracy for Local and Global Representation and Comparison of Different Number of Putative Pockets on ENZYMES Dataset
Mean and standard deviation of multiclass classification in a 10-fold cross-validation using shallow (five-layer) neural networks.
The bold data indicates the highest value for each dataset (column).
Topological landscape extracted by the operator kth max.
One-hot embedding as initial node features.
Hypergraphlet counting embedding as initial node features.
Finally, we investigate the power of statistical analyses to associate pocket niches with higher-order motifs (Lotito et al., 2022). We calculate the frequency and normalized HSP for fully labeled 1-, 2-, and 3-hypergraphlets in the top 1 pocket (Fig. 4).

The profile of the frequency of seven, 287 fully labeled motifs including all 1-hypergraphlet, 2-hypergraphlet, and 3-hypergraphlet in the scheme of positively charged (P)/negatively charged (N)/other amino acids (O). The corresponding normalized HSP Δ n for all motifs are in descending order of Δlet. HSP, hypergraph significance profile.
Taking the charge property as an example. We find the most abundant and significant 1-hypergraphlet, 2-hypergraphlet, and 3-hypergraphlet and relate them to enzymology studies. Here, we will denote a fully labeled hypergraphlet using its corresponding string representation (Supplementary Fig. S1). The most frequent and significant 1-, 2-, and 3-hypergraphlets are a noncharged amino acid (“O”), two proximal noncharged amino acids (OO|D, Type I), and three proximal noncharged amino acids (OOO|DD, OOO|DDD, OOO|DDDD, Type II to X). One positively charged amino acid with two accompanying noncharged amino acids (OOP|DD, Type IV or VI) in the pocket is immediately after in the list. Another example is a salt bridge where a glutamic acid and a lysine show an electrostatic interaction and a hydrogen bond (Horovitz et al., 1990). The occurrence of such salt bridges could be captured by a few 3-hypergraphlets, such as PNO|ID (Type III or V), which is the 264th most significant hypergraphlet, which is consistent with the widespread occurrence of salt bridges within proteins (Horovitz et al., 1990). Unsurprisingly, our 5 physicochemical-based vertex-labeling schemes and 15 interaction types (Supplementary Table S2) contribute a lot for incorporating domain knowledge into downstream biological analysis tasks. The emergence of task-specific motif families could leverage the interpretability with HSP.
Here, we give a detailed case study of the protein AONS in Figure 1. The Pyridoxal phosphate (PLP) cofactor (one substrate of 8-Amino-7-oxononanoate synthase [AONS]) is covalently bound to Lys236, while His133 and His207 are important for binding (Fig. 5). Figure 6 shows that the proximity relationship is captured by a “D” hyperedge. That is, Asp204 is hydrogen bonded to PLP, and O3 is hydrogen bonded to His207. Such a scenario is captured by another hydrogen bond but not proximity-based labeled relationship “A” in the hypergraph. Figure 2a shows the exact hypergraphlet (PNA|DA, Type VI), representing this biochemical relationship. In the counting step, once the hypergraphlet is matched, the corresponding count will increase by one.
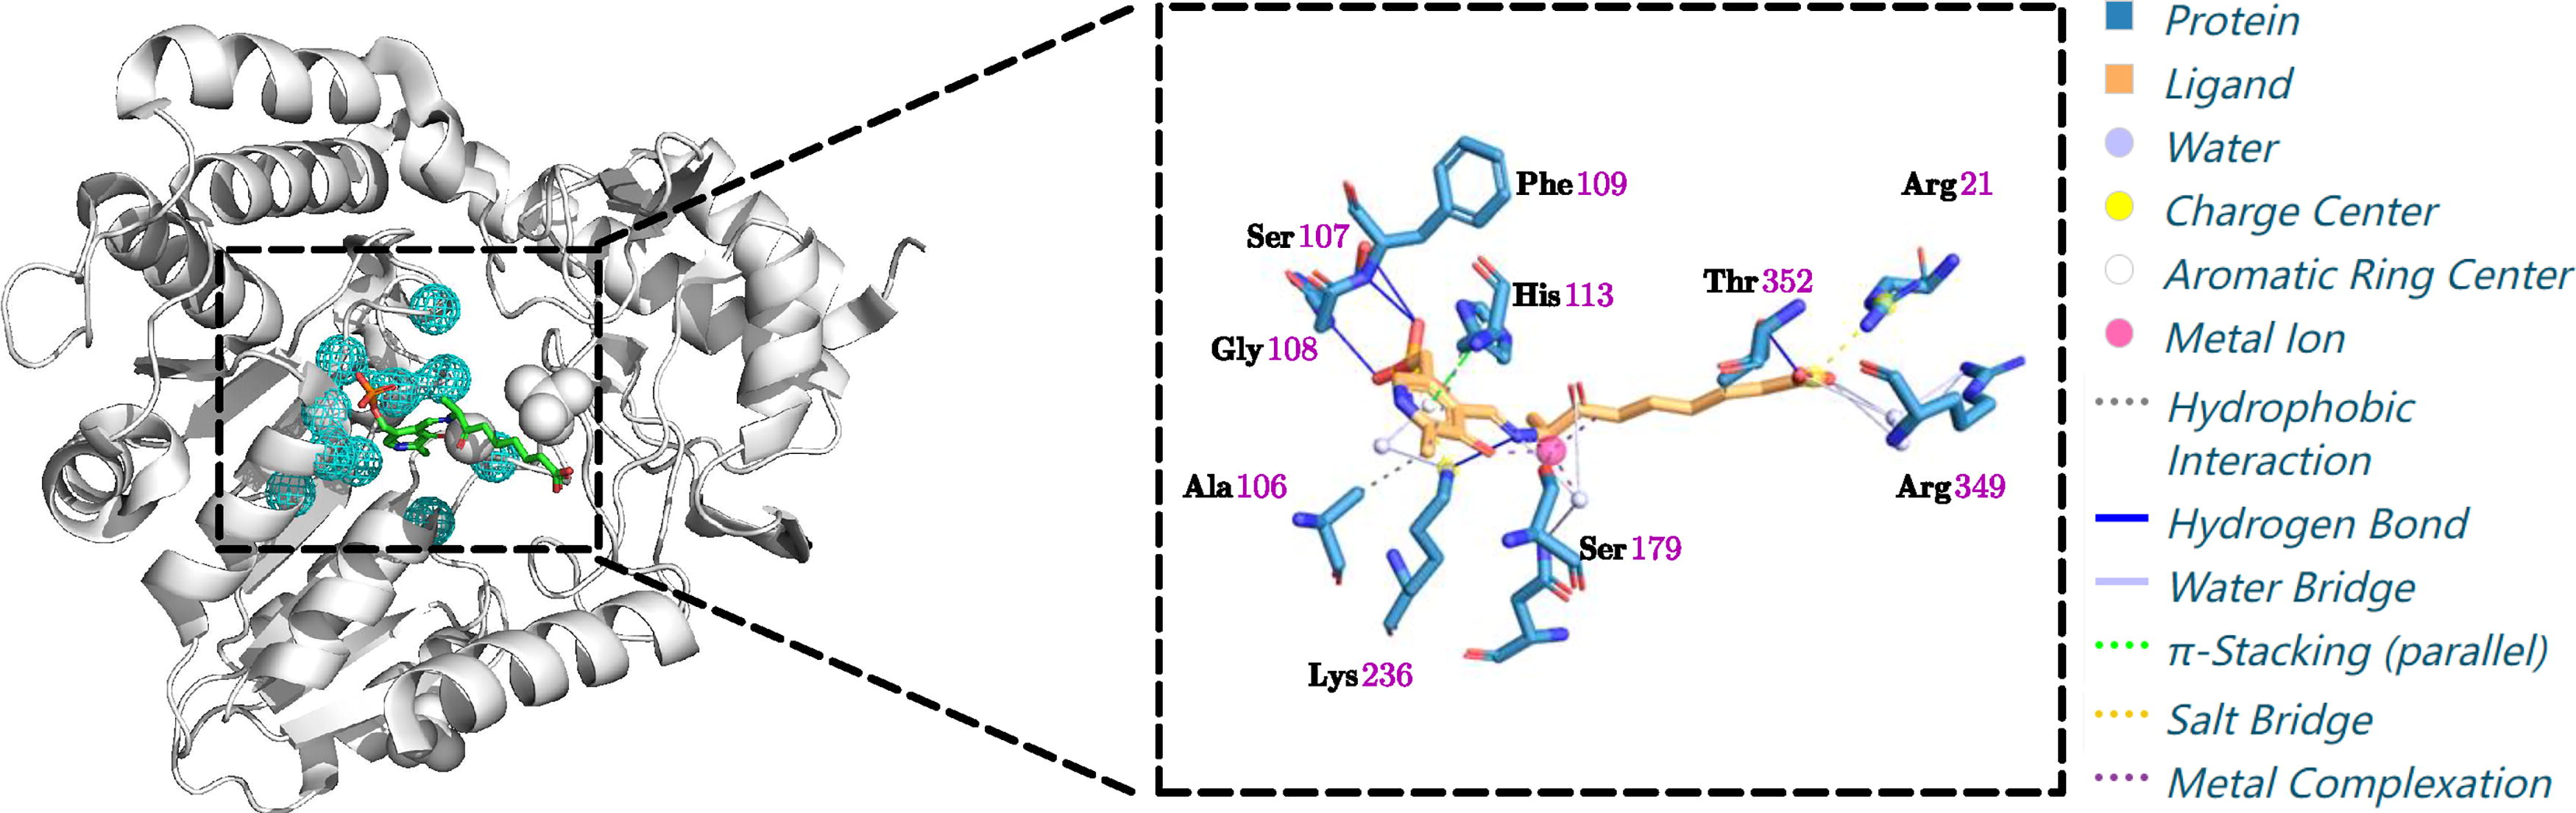
The binding pocket and interaction illustration of protein AONS. The top 1 pocket

The hypergraph illustration of the top 1 pocket for protein AONS. Left, part of the true 2D ligand interaction diagram. Right, the corresponding fully labeled hypergraph of the pocket.
In addition, the pyridoxal enzyme (Webster et al., 2000) interaction can be inferred if we add the hydrophobic node label for Ala206 and Thr233 and consider the relationship “E” that captures both proximity and hydrogen bond. Figure 2b shows the corresponding fully labeled hypergraphlet for this case.
However, it is not enough to use the top 1 pocket. Glu175 is a negatively charged residue that can polarize the hydroxyl group of Ser179 (Webster et al., 2000). Our top 1 hypergraph
We argue that the nested fully labeled hypergraphs are simple but enriched representations of the microenvironment within the pocket (Fig. 6). Furthermore, hypergraphlets enable the incorporation of domain knowledge via the node and hyperedge labeling alphabets, thus enabling the study of distinct complex biological interactions at the local scale.
As for the global information captured by TDA, we compared the persistent diagram for the AONS enzyme and its five putative pockets. Figure 7 shows the Vietoris–Rips complex of AONS (Fig. 7a) and five nested putative pockets (Fig. 7b–f) for alpha carbon atoms at maximum cutoff of r = 7.5 Å. While most of the topological features are present, loops or voids are more prominent in these pockets.

The illustration of the constructed Vietoris–Rips complex of
The persistence diagram of the AONS complex is too noisy to extract pocket information. For instance, in the Vietoris–Rips complexes of the top four putative pockets, the shape is consistent with that of the ligand KAM, where the benzene ring and phosphonooxymethyl group are at the bottom, and the keto-aminopelargonic side is at the top. On the contrary, the top 1 pocket is smaller and only captures the rich interaction void near the benzene ring and phosphonooxymethyl group. The scattered points (h = 0, 1, 2) give an overview of the size and surface area of the narrow pocket. It is worth noting that the operation in the topological layer will select landscapes that correspond to the most persistent structures.
We present a representation learning framework for macromolecules (Fig. 1), which is particularly useful if the structure of the underlying macromolecule is known. Our comprehensive evaluation shows that learned representations encode informative and biochemically explainable local and global features. Extended statistical approaches for hypergraph-based motifs identify some favorable patterns in protein structures that are consistent with enzymology. However, we note that hypergraphlet-based enumeration methods can become computationally expensive when we consider densely connected hypergraphs. Overall, our work shows evidence that methods combining labeled hypergraphlet-based inference and persistence topology-based analysis are competitive with other approaches.
Footnotes
ACKNOWLEDGMENT
The authors would like to thank Prof. Karsten Borgwardt for providing the corresponding PBD IDs for the PROTEINS and ENZYMES datasets.
AUTHORS’ CONTRIBUTIONS
P.J. and J.L.-M. conceived and designed the experiments. P.J. performed the experiments. P.J. and J.L.-M. analyzed the data. All authors contributed to the writing of the article. All authors read and approved the final article.
DATA AVAILABILITY
All the data underlying this article were collected from publicly available sources in the TUDatasets repository, https://chrsmrrs.github.io/datasets/docs/datasets/. In addition, we provide all the corresponding PDB entries for each dataset in the external Excel files. The hypergraphlet code and documentation are available at https://github.com/jlugomar/hypergraphlet-kernels. All other code and documentation will be available upon acceptance at ![]() .
.
AUTHOR DISCLOSURE STATEMENT
The authors declare that they have no competing interests.
FUNDING INFORMATION
No funding was received for this article.
References
Supplementary Material
Please find the following supplemental material available below.
For Open Access articles published under a Creative Commons License, all supplemental material carries the same license as the article it is associated with.
For non-Open Access articles published, all supplemental material carries a non-exclusive license, and permission requests for re-use of supplemental material or any part of supplemental material shall be sent directly to the copyright owner as specified in the copyright notice associated with the article.