
Abstract
The increased development of functionally diverse and highly specialized genome editors has created the need for comparative analytics tools that are able to profile the mutational outcomes, particularly rare and complex outcomes, to assess the editor's applicability to different domains. To address this need, we have developed Generalizable On-target activity ANAlyzer (GOANA), a high-throughput web-based software for determining editing efficiency and cataloguing rare outcomes from next-generation sequencing data. GOANA calculates mutation frequency and outcomes relative to a supplied control sample. It is scalable to thousands of target sites across the entire genome and is 4,000% faster than CRISPResso2. Mutations are reported on a “per-read” level rather than individually, enabling the identification of co-occurring mutations. GOANA is editor agnostic and can be applied to data generated from any targeted editing experiment, including base editors. Requiring only that control and treated reads are aligned to the same reference, GOANA can handle data from any library preparation method, including pooled amplicon and whole-genome sequencing. As a proof of principle, we analyze two large data sets of CRISPR-Cas9 and CRISPR-Cas12a editing, demonstrating the power of GOANA and highlighting several key differences between the two enzymes. GOANA is available for use at https://gt-scan.csiro.au/goana/ and as a command line tool from https://github.com/BauerLab/GOANA.
Introduction
Genome editing is applied in a wide range of application areas, ranging from basic science to products in the agricultural and medical space. This has resulted in a plethora of highly specialized genome editing platforms being developed (e.g., CRISPR-Cas, base editing, and prime editing 1 ). Understanding and comparing the editing characteristics of these platforms is crucial to choosing the optimal one for different domains. As such, highly precise analytical pipelines are needed to quantify editing outcomes rapidly and accurately. Especially for medical application cases, such as gene therapy, cataloguing even rare outcome characteristics is crucial to reaching the precision and control needed for this domain.
The editing activity of these platforms is most effectively measured through direct sequencing of the targeted region. Here, the frequency with which the editing platform can create the intended outcome can be measured directly. As such, analytics pipelines that measure gene editing activity using sequencing data will be more accurate and generalizable. 2
Besides editing efficiency, other editing outcomes need to be recorded, as many of the ways by which these editing platforms induce genomic changes involve stochastic processes. For example, non-homologous end joining repair often leads to randomly inserted or deleted sequences (known as indels). 3 Similarly, while base editors typically aim to induce specific changes, there are often bystander edits where nearby sequences are also changed, potentially resulting in completely unintended sequence conversions. 4 In some instances, the outcome can be even more complex, such as combining multiple indel events. 5 These events can occur through several processes, such as when errors in the repair pathway cause both deletion and insertion events (e.g., through the error-prone non-homologous end joining pathway 6 ), through alternate repair pathways that are prone to substitution errors 7 or if the original edit does not fully destroy the original target site, allowing CRISPR to rebind and cleave, albeit at a lower efficiency. Such combinations are important to consider, as they may have a significant effect on the final phenotype and confound the final results. This is particularly important in applications where only exact changes to the DNA sequence are acceptable, such as gene therapy.
The precise cataloguing of editing profiles is also the basis to train software tools aimed at predicting the outcome of future editing events.2,4,8,9 Being able to guide researchers and practitioners in the editor choice and design process requires computational tools that detect and quantify the editing outcomes precisely, especially with such diverse outcome profiles to consider.
Various tools have been developed for quantifying editing outcome from sequencing data. 10 Two of these tools, CRISPResso2 11 and Cas-Analyzer, 12 are provided as web apps, allowing users to upload sequencing data for analysis. CRISPResso2 provides an overall view of editor activity, such as summarizing the dominant mutational outcomes, but does not identify more complex outcomes. While Cas-Analyzer is capable of capturing mutation combinations, it is limited to analyzing a single target site at a time, making it impractical for large-scale data sets. Both web apps also use a static reference sequence for identification of mutations. This means that heterozygosity or mosaicism within the treated population is missed and may confound the results. As a result, there is no tool to date that combines high-throughput analysis with the ability to quantify the complex mutational outcomes.
To address this need, we designed Generalizable On-target activity ANAlyzer (GOANA), a high-throughput analytics approach able to quantify overall gene editing activity in a target site as well as report the specific details of individual mutations that were observed, such as indel rates, substitutions, and unique mutation combinations. The pipeline is high throughput and generalizable to any gene editing technology, including base editors. GOANA is a web service, and through using advanced client-side handling, all analysis is done on the user's local computer. As such, large and potentially sensitive data files do not need to be uploaded, hence combining ease of use and scalability with security and data privacy. A command-line version is also available for automated workflows.
With a generalizable tool such as GOANA, it is possible to compare and contrast various gene editing methods. As an example, we compare two gene editing experiments, one with Cas9 and one with Cas12a, identifying differences in editing outcome with a specific focus on mutational combinations and how these differ between the editors.
Methods
Implementation
GOANA is a lightweight tool designed to facilitate rapid analysis, characterization, and quantification of mutations from targeted gene editing. The tool processes alignments from sequencing data and is aligner agnostic, accepting any alignment, for example with custom parameters, provided it is in the appropriate format (.bam). No assumption is made about the underlying gene editing mechanisms, meaning any method of inducing targeted mutations (such as base editors) can be assessed.
First, GOANA collates all reads that map across the provided target sites (including any user-defined flanking regions). Reads must cover a minimum portion of the target site to be considered, so as to discard reads from similar locations that have been incorrectly aligned. Coverage thresholds can be set by the user, and defaults to include any read that contains at least 20 bases covering the target site. Users can also set a minimum base quality to exclude low-quality or ambiguous bases, which could lower result confidence. The CIGAR string of each aligned read is then used to transform each read into a list of position-specific elements, where each list element records the corresponding nucleotide or series of nucleotides at that position. This includes matches/mismatches (recorded as the corresponding base), deletions (recorded as “–”), and insertions (recorded as X + YZ, where X is the reference base preceding the insertions, Y is the length of insertion, and Z is the inserted sequence). When the read does not cover the entirety of the target site, unspecified bases are recorded as blank entries. Hard- and soft-clipped reads are also treated as missing bases. Once all reads have been converted to list elements, identical entries are aggregated.
Once collated, GOANA then scans for the presence of mutations. In order to account for natural variation in the experimental system, a consensus sequence is generated from the control sample, consisting of the most frequently observed base at each position. All sequences across the control and treated samples are then compared back to this consensus in order to identify mutations, and their individual frequency is calculated. In an ideal case, the data are mostly uniform, with the majority of the reads matching the consensus and the remaining errors attributable to sequence errors. This can provide important information about the structure and reliability of the control data, including whether there is any heterozygosity or mosaicism. This is useful in the context of polyploid species, such as some plants, where a single static reference sequence is not applicable. In the instance where two or more sequences are tied for most common occurrence, the consensus sequence is chosen as the first allele alphabetically. Quantification then occurs normally, with all observed variants split based on their allele. As such, users can determine if their approach is predominantly targeting one allele over the other.
A notable advantage of GOANA's approach is that it can identify and process combinations of mutations that occur together, such as nearby co-occurring single nucleotide polymorphisms (SNPs) or a deletion event paired with a nearby substitution. Mutation combinations that are observed on the same read are treated as single mutation events. Once all mutations are identified, a final mutation frequency for the entire target site is then calculated using the following equation:
where
This activity score is an improvement over the typical mutation frequency calculation, 13 which is calculated as the proportion of mutated reads in the treated sample. We improve upon this by first normalizing against a control data set, which removes any background variation that was already present in the sample. Second, the pairwise proportion differences of alleles between the treated and control are taken rather than the total difference in mutated read proportions. This gives a more accurate representation, as a control and treated sample may have the same proportion of mutated reads but could be made up of different alleles. The typical calculation would return an erroneous frequency of zero in this scenario, while the pairwise approach generates a meaningful quantification.
Target sites can also be extended by a user-defined length up- and downstream to catch mutations outside the immediate target site, for example to include anticipated CRISPR-induced large-scale deletions. 14 Reads must cover the target site with a minimum number of bases set by the user (default: 20) in order to be included in the analysis. This limits the effect small overlaps have on the calculated mutation rate, as the ends of reads typically have a higher sequence error rate.
Webapp implementation
GOANA is accessed via a URL and is hosted on a secure private server. The application was created using the Angular web framework, and the data processing logic and reporting are also written entirely in TypeScript. Since the processing steps are written in TypeScript, data are processed entirely on the client side in the browser. The benefits of this are twofold. BAM files can be large, often several gigabytes for a typical use case. The localized analysis functionality means that these large files do not need to be uploaded for processing, as GOANA simply extracts the relevant data from the local files. Second, if alignment data are of a sensitive nature, they do not need to be uploaded, and security can be maintained. The trade-off for the security and limited data movement is that performance is limited by the resources of the user's machine. However, testing shows typical machine hardware is easily capable of rapid and thorough analysis.
BAM file data are extracted using the open-source JavaScript package GMOD/bam-js (https://github.com/GMOD/bam-js), and graphical output is generated using the open-source HTML5 package ChartJS (https://github.com/chartjs/Chart.js)
GOANA output
The final output is presented in an interactive tabular and graphical form and allows users to search rapidly for specific mutations (such as specific homology-directed repair outcomes). An example output is shown in Figure 1. The user can simply search across the output file for the insertion, deletion, or substitution they desire, and all locations and corresponding read frequencies will be highlighted. The user can also search for a specific sequence or pair a sequence with a desired mutation or mutations, for example a specific edit induced via base editing.

Example output from GOANA. GOANA provides both graphical and tabular output, including global information about all sites analyzed (including average mutation rates and input parameters)
The results screen displays all reads that appeared in either the treated or control samples, and their respective counts both as a raw count and as a percentage against the total of reads present. The final column records the difference between the control and treated samples. Sorting by this final column allows users to see which alleles are the most differentially expressed in the two samples, showing where the most variability is coming from. Mutations are highlighted in colors for easy identification against the consensus: SNPs are red, insertions green, and deletions blue. Output can be sorted based on any of these counts, given thresholds for inclusions or exclusion, and filtered to search for specific mutations or read substrings. To assist users in choosing the optimal threshold, GOANA reports the distribution of SNP frequencies across the full data set, allowing users to identify a threshold that reduces the impact of potential sequencing errors. Users also have a toggle option to include or exclude all SNPs. This allows the user to examine indels more closely while ignoring SNPs that may potentially be sequencing errors.
GOANA also produces graphs for fast general overviews of data. These show the distribution of mutations across the provided site, as a bar graph, highlighting mutation hotspots where variation is prevalent. The distribution of indel size is shown on a separate line graph. Finally, a pie chart shows the proportion of insertions, deletions, and SNPs across the region. These three graphs allow the user to identify rapidly what has occurred in their data, and give a starting point for looking through the mutations list in the table.
Data preparation and processing for demonstration case
Sequencing data from three studies were used to test GOANA: two CRISPR-Cas9 studies (Chari et al. 15 and Kim et al. 16 ) and a CRISPR-Cas12a study (Kim et al. 9 ). In each of these studies, multiple loci were targeted by CRISPR-Cas9 or Cas12a, and the subsequent on-target editing efficiency assessed by targeted sequencing. Data sets were downloaded from the NCBI SRA database (see Supplementary Table S1 from more detail), and then reads were aligned to the reference genome using either Bowtie2 17 (v2.3.4.3), BWA mem 18 (v0.7.15), or Hisat2 19 (v2.1). Default settings were used for all alignments. The control and treated pairs were then passed to GOANA, along with the respective target sites in BED format for analysis. GOANA output was then analyzed using custom python scripts. The full analysis workflow can be found at https://github.com/BauerLab/GOANA_Data.
CRISPREsso2 was installed as recommended using an anaconda environment. CRISPRessoWGS was run using default settings, except for exclude_bp_from_left and exclude_bp_from_right, which were both set to 0 and the –ignore_substitutions flag.
Results
Performance analysis and comparison
To test the performance of GOANA, we reanalyzed the data from Chari et al., 15 a large-scale study of CRISPR-Cas9 activity consisting of 1,362 targets assessed by targeted sequencing, with more than 31 million reads in both the treated and control samples. Samples were processed as outlined in the Methods and then passed to the GOANA web app. We used commodity compute systems that are readily available for GOANA's client-side processing, namely a 2015 MacBook Pro with a 2.7 GHz i5 CPU and 16GB RAM.
We first confirmed that the activity scores as measured by GOANA matched those reported by the original paper. Using the same filtering criteria as the original paper (ignoring SNP mutations and requiring a minimum coverage of 100 reads), GOANA processed the full data set in 21 min and showed a correlation of R = 0.96, with the reported activities confirming that it is highly accurate in its analysis (Fig. 2A). As a comparison, we compared GOANA to CRISPRessoWGS, the CRISPResso2 implementation for analyzing multiple targets within a single alignment file. CRISPRessoWGS required 14 h but also showed a correlation of R = 0.96 with the activities reported in Chari et al. and R = 0.96 with those reported by GOANA (Fig. 2B), confirming that GOANA accurately measures editing efficiency (see Supplementary Table S2 for full results). The difference in activity scores between GOANA and the Chari data set is due to differences in how mutation rate was calculated. While the Chari et al. study and CRISPRessoWGS calculate activity as the difference in %-modified reads between control and treated samples, GOANA calculates the pairwise differences for each individual mutation. In cases where the control sample shows low variability, these metrics provide a very similar score. However, in case with more variability is observed in the control, GOANA's approach provides a more effective method to capture the true mutation rate.
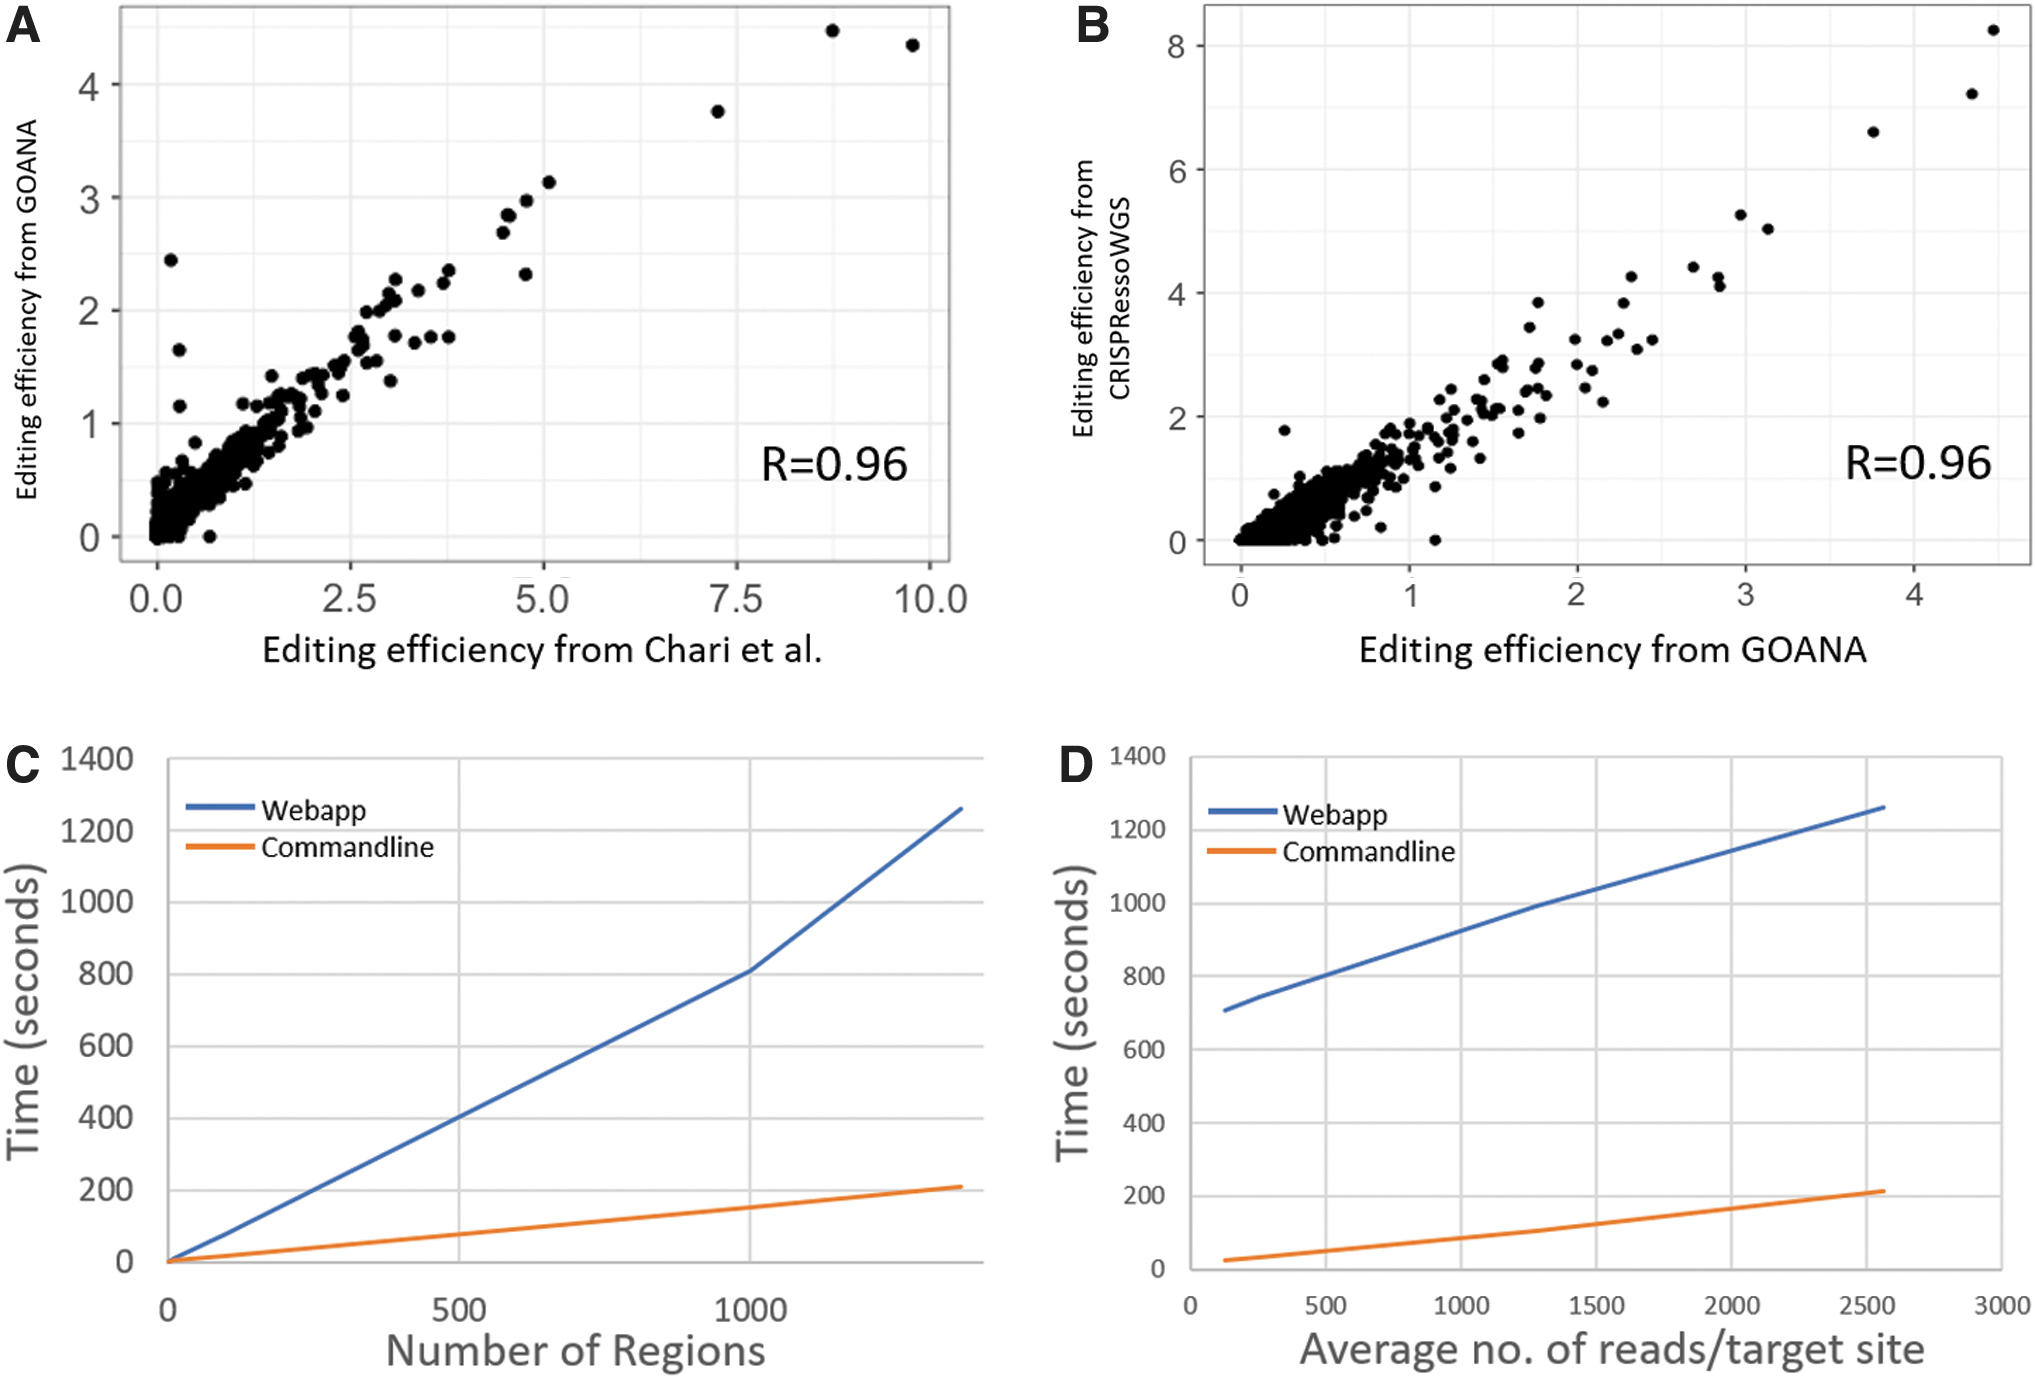
Performance analysis of GOANA.
We next tested whether GOANA is truly aligner agnostic by realigning the data with the BWA and Hisat2 aligners and comparing the measured activity across all conditions. BWA showed a correlation with the results from Chari et al. of R = 0.98, and the Hisat2 alignment showed a correlation of R = 0.97, confirming that GOANA is aligner agnostic. Across all GOANA, Chari, and CRISPResso comparisons we identified a small number of targets where there was low correlation across the different analyses (Supplementary Table S3). While no obvious reason could be seen for why these targets should differ, we note that the discrepancy was not unique to GOANA (with both the Chari and CRISPRessoWGS results showing at least one outlier each) and was dependent on the aligner used. Consistent with this, we found subtle variations among the alignments at these target sites (e.g., Supplementary Fig. S1). This highlights the need for users to optimize their alignment strategy for their specific use case and the importance of aligner-agnostic downstream analysis.
To test how well the GOANA web app and command line implementations scale, we varied the number of target sites analyzed. Performance time scales linearly with the number of regions being analyzed, where all 1,362 target sites take 21 min for the web app and just under 4 min for the command line to complete (Fig. 2C). As a comparison, we tested CRISPRessoWGS, which requires the same preprocessing and input files as GOANA Using the same hardware, CRISPRessoWGS took 14 h and 41 min to process the entire Chari et al. data set—a 40-fold increase compared to the web app's 20 min and a 220-fold increase compared to the command line. We note as well that CRISPRessoWGS only analyzes a single sample. In order to compare control versus treated, CRISPRessoWGS must be run over both samples and then the results processed with CRISPRessoPooledWGSCompare.
Additionally, we also tested how read coverage effects performance by subsampling the control and treated alignments with SamTools (v1.1) 20 to simulate lower coverage. Again, we found that run time increased with higher coverage, but the run-time gradient was flatter than a one-to-one increase, indicating that as coverage increases, the proportional time spent analyzing each read decreases (Fig. 2D). As expected, as coverage decreased, so did accuracy in the measured editing efficiency. Using only 5% of the reads, the correlation with the reported results was only R = 0.55, increasing to R = 0.96 when 100% of the reads are used (Supplementary Table S4). Interestingly, the top/bottom 10% of target sites showed a higher correlation (R = 0.67 at 5% of reads), suggesting these extremes are more resistant to low coverage. The correlation at 50% of reads (which corresponds to an average of approximately 1,200 reads/target site) was 0.89, suggesting at least 1,000 reads/target site are required to gain an accurate measure of editing efficiency.
GOANA was designed to be library agnostic, working equally well on whole-genome sequencing as amplicon sequencing. To test this, we reanalyzed the Chari et al. data, this time aligning only to the specific amplicon sequences (defined as the target site ±500 bp) with BWA. Reanalysis with GOANA showed a similarly high correlation to the Chari et al. results (R = 0.93) as the whole-genome alignments.
These results demonstrate the high-throughput, general, and scalable nature of GOANA, making it readily applicable for the analysis of large-scale genome editing experiments.
Comparing Cas9 and Cas12a
To showcase GOANA output and the power of a Cas-agnostic tool, we reanalyzed sequencing data from two studies, which profiled the activity of CRISPR-Cas9 and CRISPR-Cas12a across 125 and 55 genomic sites, respectively.
Based on these studies, GOANA showed that CRISPR-Cas9 has a much higher average mutation efficiency than Cas12a (55.34% vs. 14.18%). The mutation profile of the two enzymes was also different (Fig. 3A). Both Cas9 and Cas12a data sets showed an enrichment of SNP mutations, with frequencies of 58% and 71% of all mutations, respectively. While these SNPs may be sequencing errors, they are indistinguishable from real SNPs based on currently available knowledge. Both data sets displayed a similar level of deletion events (26% and 27%, respectively). However, Cas9 showed a much higher level of insertion events than Cas12a (17% compared to 2%).
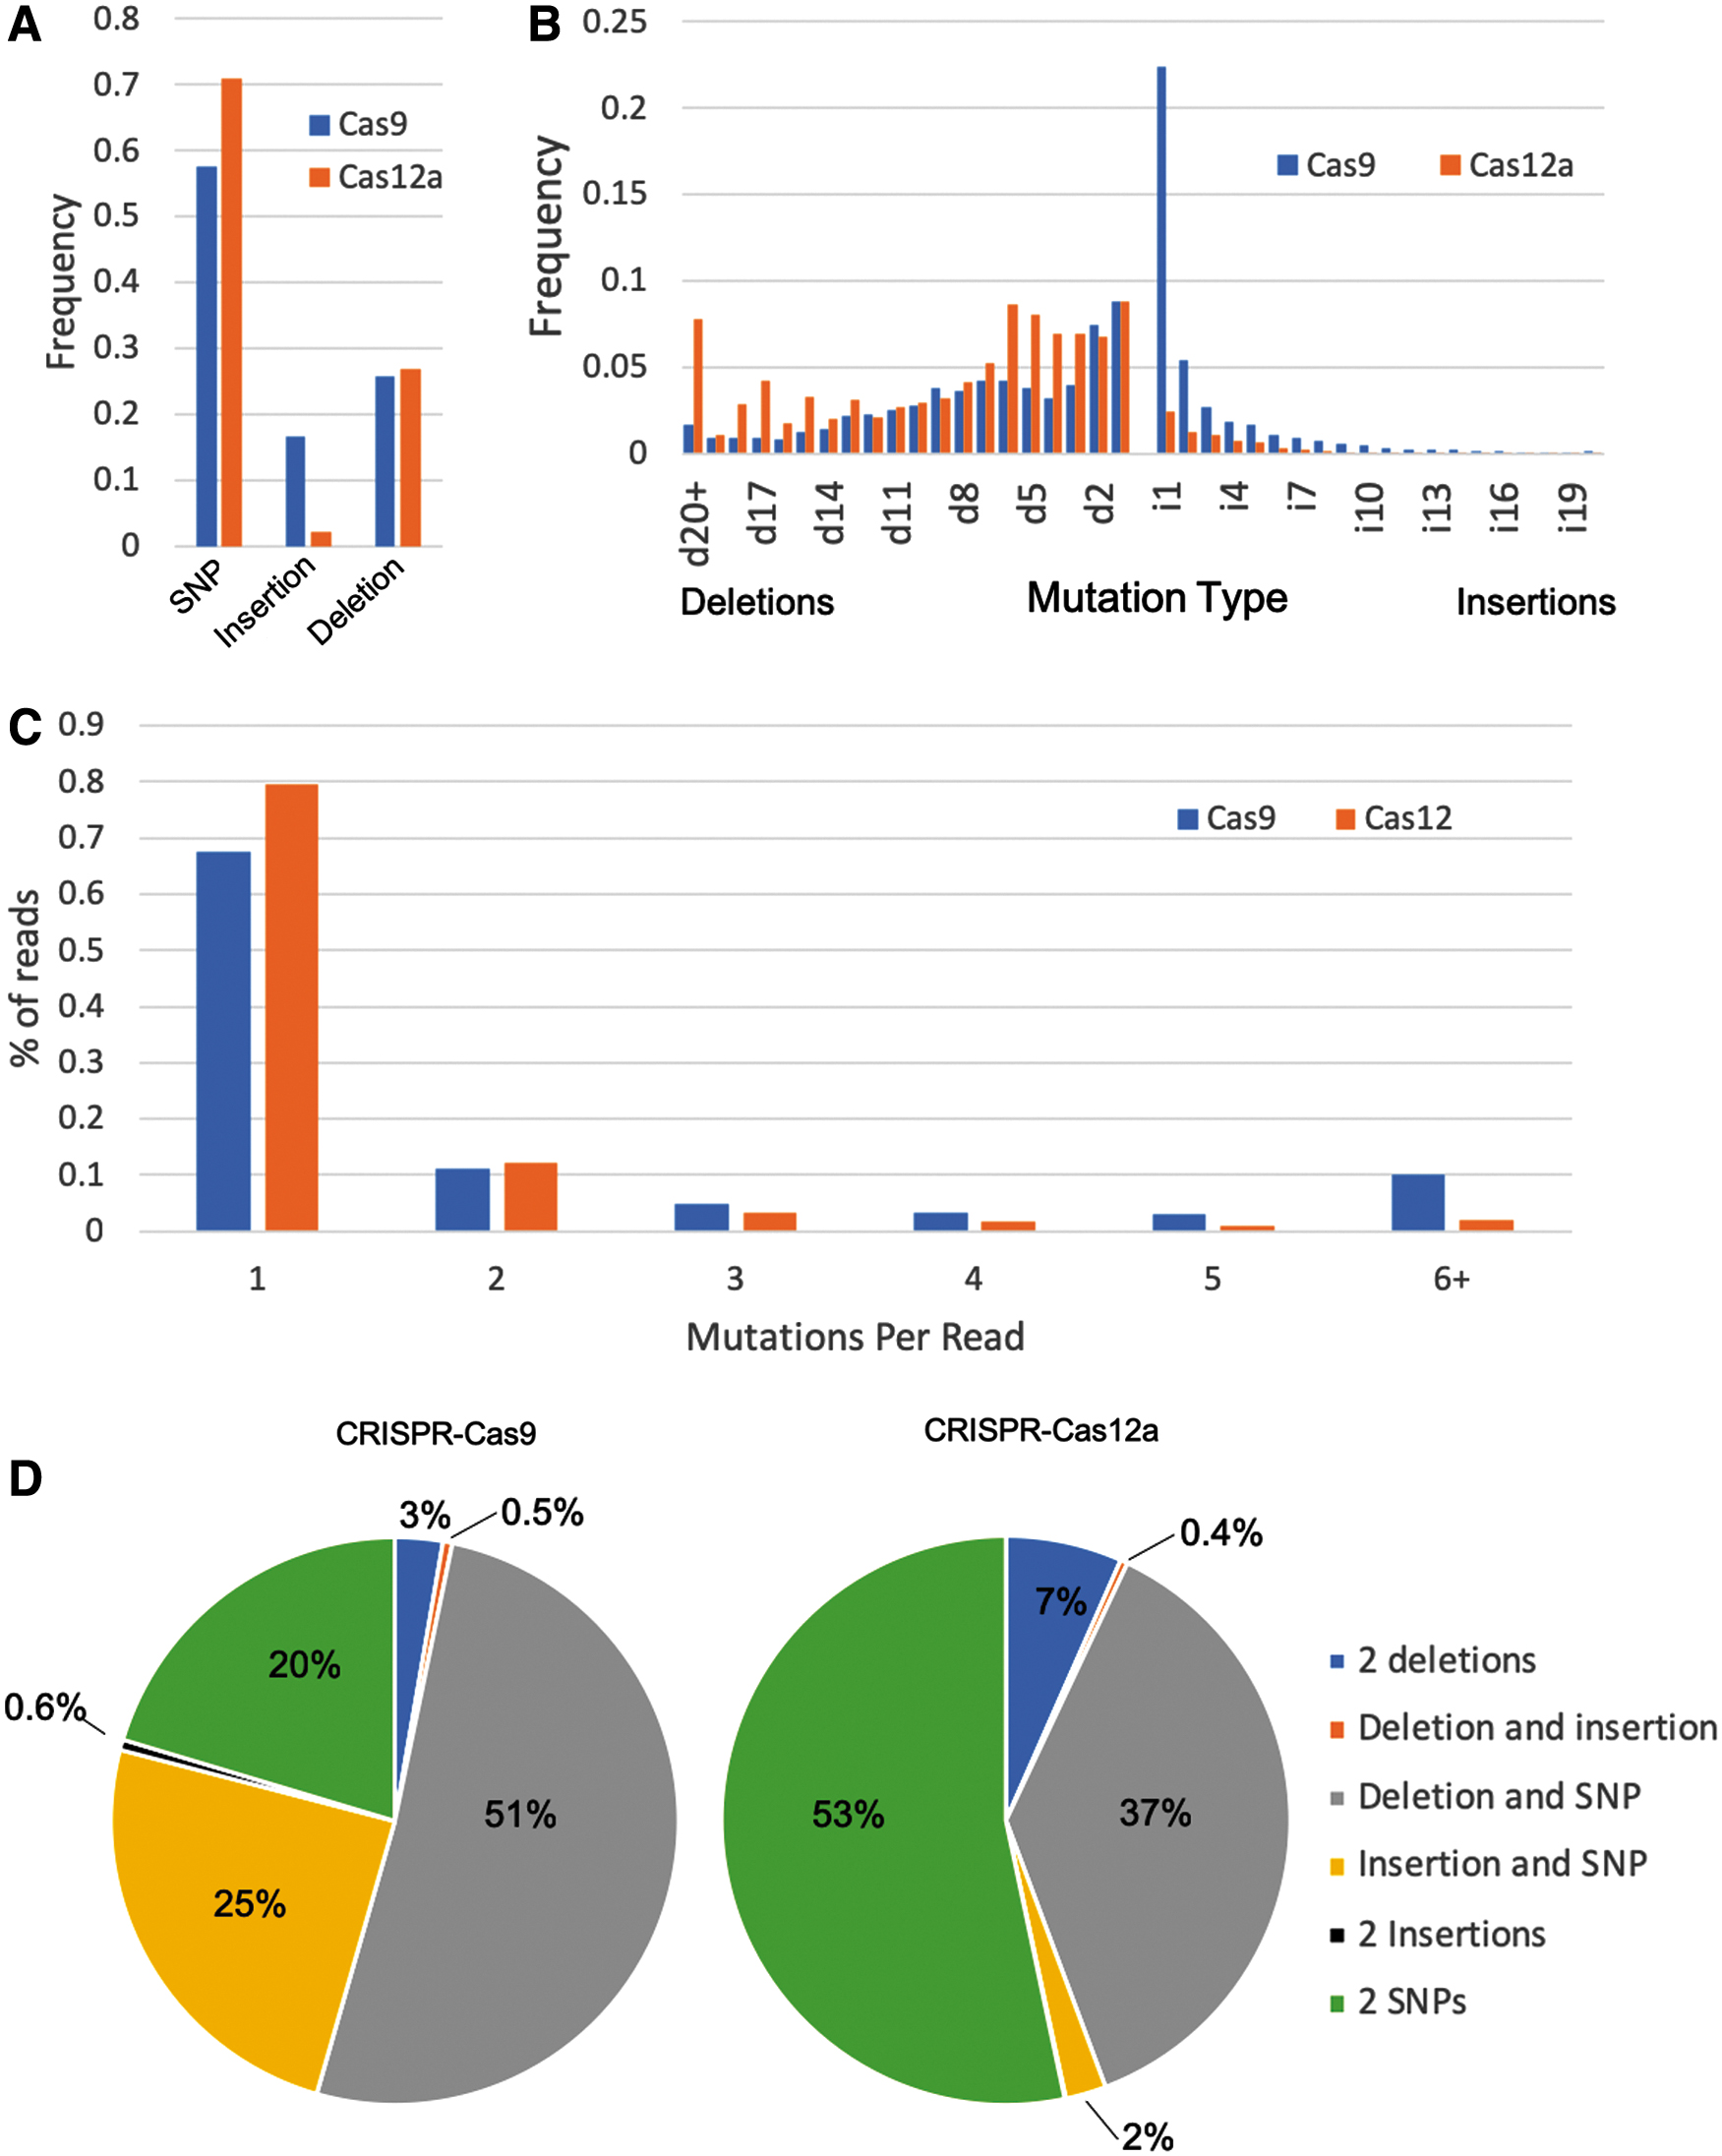
Comparison of Cas9 and Cas12a with GOANA.
The two enzymes show different patterns of indel size. Both CRISPR enzymes displayed a unimodal (one maximum) distribution of insert size, peaking at a length of 1 bp, while deletions showed a multimodal distribution (Fig. 3B). Interestingly, while Cas12a showed a relatively even distribution of inserted bases, Cas9 showed a distinct enrichment of As at the insertion site (Supplementary Fig. S2). It has been suggested that CRISPR-induced 1 bp insertions tend to copy the nucleotide at position −4 relative to the protospacer adjacent motif (PAM). 21 We investigated whether this may explain the enrichment of inserted As by comparing the inserted bases to the nucleotide at position −4, but found no correlation across both the entire Cas9 and Cas12a data sets or specifically the instances of inserted As (Supplementary Table S5). Cas9 deletions have distinct peaks at lengths of 1 and 8 bp, where Cas12a deletions have distinct peaks at l = 1 and l = 6 (Fig. 2B). Indels tended to be larger for Cas12a, with 8% of deletions being >20 bp long and with an average deletion size of 8.8 bp compared to the Cas9 average of 7.2 bp. Conversely, Cas9 appeared to favor smaller insertions, with an average insertion size of 2.8 bp and >22% of all indels being a single base insertion. A potential explanation for this difference in indel sizes is the difference in target site editing efficiency. The highest overall mutation frequency for Cas12a was 52%, while Cas9 showed a broad range of activities. We tested if there was any correlation by splitting the Cas9 target sites into high (>52% mutation frequency) and low (<52% mutation frequency) and calculating the frequency of indel size (Supplementary Fig. S3). The high and low Cas9 target sites showed very similar trends, suggesting this difference between Cas9 and Cas12a is not due to overall activity.
Alternate DNA repair pathways, such as micro-homology mediated end joining (MHMEJ), could also contribute to the difference in deletion sizes between Cas9 and Cas12a. MHMEJ occurs when there are micro-homologies flanking the site of the DNA break, which are used during repair, resulting in a deletion flanking the original break site. 22 To investigate whether this may be contributing to the differences in deletion size, we analyzed the 5 bp flanking sequences surrounding the cut sites (defined as 3 bp upstream of the PAM in Cas9 and 19 bp downstream the PAM in Cas12a) for homology and compared it to the average deletion size for each target site. The results showed no clear correlation between homology and length of deletion (Supplementary Fig. S4).
Frequency of co-occurring mutations
GOANA can identify co-occurring mutations with high confidence by reporting only mutations occurring within the same read. As shown in Figure 3C, Cas9 tends toward more mutations per read than Cas12a, with 32.3% of the reads showing more than one induced mutation across the data set compared to 20%, respectively. We further investigated if the editors displayed preferences for the types of combinations (e.g., favoring two substitutions or an insertion with a deletion). Figure 3D shows that the major combination of mutations induced by Cas9 consist of a deletion and SNP (51% in Cas9 vs. 37% in Cas12a), whereas in Cas12a the prevailing mutations are a pair of SNPs (53% in Cas12a vs. 20% in Cas9). The most common combination of mutations involved at least one SNP, accounting for >90% of all paired mutations in both cases. While it is likely that some of the combinations including SNPs involve sequencing errors, it is not possible to distinguish these without further experimentation. Complex outcomes including a deletion and insertion or two insertions were very rare for both Cas9 and Cas12a, accounting for less than a combined 1% of all paired mutations in both cases. For Cas12a, multiple insertions were detected at very low levels, accounting for <0.1% of all paired mutations. This trend is similar to what is observed when only the top 10% of mutations at each target are considered (Supplementary Fig. S5), suggesting it is not an effect of low frequency mutations/potential sequencing errors.
Discussion
The read-focused nature of GOANA enables identification of co-occurring mutations, the importance of which is highlighted by the comparison of Cas9 and Cas12a activity where the observed outcome profiles can influence the editor's applicability to certain domains. Using GOANA we identified multiple instances of co-occurring mutations across both data sets, with a higher prevalence in the Cas9 data. The two data sets also show distinct distributions of insertion, deletion, and substitution events. Editing with Cas9 typically gave a higher number of mutations per read than Cas12a. These may be due to differences in how the enzymes induce mutations. While Cas9 creates a clean double-strand break, Cas12a creates a sticky-end-like cut, with an overhang of five bases. These different cleavage properties likely influence repair outcome and may explain why Cas12a showed on average larger deletions. These larger deletions may also more fully destroy the original target and prevent subsequent rebinding and cleavage by the CRISPR enzyme. The smaller deletions induced by Cas9 may allow the CRISPR enzyme to rebind and cleave, resulting in more mutations and explaining why Cas9 showed a higher frequency of multiple mutations. Quantification and analysis of these unique properties will be critical to future studies and applications of genome editing tools. Comparisons across technical and biological replicates will be key to confidently separating out genuine low-frequency mutations and sequencing errors.
A key improvement of GOANA over other available tools is its scalability. Built specifically to handle large scale data sets, the GOANA web app was able to process more than 1,300 target sites in just over 20 min—a 40-fold improvement in run time over CRISPRessoWGS, the current state of the art. The command line implementation of GOANA was even faster, completing the full analysis in <4 min. This significant increase in speed will greatly simplify the process of analyzing gene editing experiments. Furthermore, GOANA can process treatment and control samples simultaneously, which represents a substantial time gain compared to CRISPRessoWGS's sequential analysis followed by a post-processing step.
As a web app, GOANA requires no installation, only requiring the data to be aligned prior to the analysis. Additionally, by performing the analysis on the user's side, there is no requirement for uploading of large files, drastically reducing the processing time further. This also provides added security in the case of sensitive data, as the alignment files are never uploaded to an external server, and full control over data access can be maintained. By using pre-aligned files, GOANA is also able to fit into existing workflows easily, such as those that require specific or custom handling and filtering of alignments. For added ease, a command line version of GOANA is also available, which can be directly integrated with existing workflows.
Conclusions
GOANA fills an emerging need in the genome editing space by providing the robust and high-throughput analysis capability for large-scale sequencing studies of editing activity. Additionally, GOANA allows for the identification and quantification of co-occurring mutations. The flexible nature of the tool means it can be applied to any editing technology, including base editors, and can easily fit into existing workflows. By enabling comparisons between current and yet to be developed editing technologies, GOANA will facilitate new insights into how these editors function, how they compare to existing approaches, and in what context they are best applied.
Footnotes
References
Supplementary Material
Please find the following supplemental material available below.
For Open Access articles published under a Creative Commons License, all supplemental material carries the same license as the article it is associated with.
For non-Open Access articles published, all supplemental material carries a non-exclusive license, and permission requests for re-use of supplemental material or any part of supplemental material shall be sent directly to the copyright owner as specified in the copyright notice associated with the article.