
Abstract
Cerebral organoids are a promising model to study human brain function and disease, although the high inter-organoid variability is still challenging. To overcome this limitation, we introduce the method of labeled mixed organoids generated from two different human induced pluripotent stem cell (hiPSC) lines, which enables the identification of cells from different origin within a single organoid. The method combining gene editing and organoid differentiation offers a unique tool to study gene function in a complex human three-dimensional model. Using a CRISPR-Cas9 gene-editing approach, different fluorescent proteins were fused to β-actin or lamin B1 in hiPSCs, and mixtures of differently edited cells were seeded to induce cerebral organoid differentiation. Consequently, the development of the organoids was detectable by live confocal fluorescence microscopy of whole organoids and immunofluorescence staining in fixed samples. We demonstrate that a direct comparison of the individual cells is possible by having the edited and the control (or the two differentially labeled) cells within the same organoid, thus overcoming the inter-organoid inhomogeneity limitations. Furthermore, the approach enables mosaic analysis of mutant clones in a wild-type three-dimensional cellular environment. It paves the way for the reliable analysis of human genetic disorders using organoids and the gain of fundamental understanding of the molecular mechanisms underlying pathological conditions.
Introduction
Cerebral organoids (COs) offer a state-of-the-art three-dimensional cell culture model to study human brain function and pathophysiology. COs are differentiated from human induced pluripotent stem cells (hiPSCs) and comprise features of the human brain in respect to their cytoarchitecture, for example the different layers of the human brain, from the ventricular layer to the cortical plate.1,2 The protocol for the formation of embryoid bodies (EBs) from hiPSCs and the subsequent ectoderm-derived differentiation was originally established in 2014, 3 but has since been extended to a variety of methods to develop brain area-specific organoids (e.g., tissue with hippocampal neurons).4,5
The Yamanaka protocol for the reprogramming of human body cells such as peripheral blood mononuclear cells (PBMCs) or fibroblasts into hiPSCs 6 increases the applications of COs for basic research because it enables hiPSCs to be obtained from every individual, and similarly allows personalized cerebral (and other) organoids to be differentiated. COs could be on their way to becoming an indispensable technology for drug screening experiments, biomarker identification, and drug treatment response analyses for different fields of research, including neurodevelopment, neurodegeneration, and psychiatric disorders, and the list is continuously growing.7–9
Despite these amazing features, CO technology is currently facing challenges, such as the lack of a co-differentiating vascular system (from the mesoderm germ layer), the absence of a body axis, and a large heterogeneity in respect of their shape and size. As a consequence, many replicates need to be studied in order to define significant differences between patient-derived COs and controls.10–13
Another technology of the 21st century is the Nobel prize-awarded CRISPR-Cas gene editing method, offering unique capabilities to modify the genome of an organism. Originally identified as an adaptive immunity defense mechanism, 14 the technology is now used to knock out genes, to include mutations, or to activate and silence genes. 15 Although it has been mainly used for the aforementioned purposes, CRISPR-Cas has already been identified as a promising tool for future applications in cell tracing and reporter-cell generation via specific expression of fluorescent proteins.16,17
The application of CRISPR-Cas gene editing on hiPSCs and the subsequent organoid differentiation promises a fascinating tool to study the consequences of genetic changes in a three-dimensional, tissue-like model and provides an auspicious technology to examine the molecular mechanisms underlying human physiology and pathophysiology.
Accordingly, in the current study, we focused on an innovative way to combine two outstanding molecular biological techniques, CRISPR-Cas9 gene editing and CO generation, in order to overcome some of the limitations accompanying CO technology. We used fluorescent-labeled cell lines, endogenously tagged for broadly expressed proteins with a fluorescent cassette.
Using this approach, we generated fully differentiated, mature COs that allow the identification of differently labeled cells by confocal microscopy. We further observed a comparable organization and cell type composition in fluorescently labeled COs as reported for nonedited COs. Moreover, our results confirm the possibility of developing “mixed” COs from gene-edited cells with different genetic backgrounds and different labels that can be identified and analyzed separately within the same CO.
Altogether, our results support the possibility of using distinctively labeled reporter cell lines, with different characteristics (e.g., mutation-containing and “healthy cells”) to generate more accurate human brain disease models, enabling a direct comparison under identical experimental conditions. This would be particularly relevant for brain diseases with underlying genetic mutations, such as familial Alzheimer's disease, Huntington's disease, frontotemporal dementia, or Parkinson's disease, to name but a few. Moreover, any type of mutation that induces brain disease–characteristic pathophysiology, such as plaques, disturbed neurogenesis, or neurodegeneration, when applied in our improved organoid model for comparative analysis, will be helpful in unraveling the underlying mechanisms.
Methods
hiPSC culture
hiPSC lines (CL1, CL2, CL3; ACTB-GFP: AICS-0016) were each reprogramed from fibroblasts. They were cultured in StemFlex™ medium (Gibco™, Thermo Fisher Scientific) with 1% penicillin/streptomycin on 35 mm dishes coated with Geltrex™ (Gibco™, Thermo Fisher Scientific, 1:150 dilution in Dulbecco's modified Eagle's medium [DMEM]/F12) at 37°C in 5% CO2 atmosphere. The Parafilm®-sealed dishes were stored at 4°C for up to 2 weeks and were incubated for 60 min at 37°C prior to use for polymerization. A light microscope was used to observe cell growth and health. The StemFlex™ medium was changed every 1–2 days, and the cells were split before 70–80% confluency was reached.
For splitting, the cells were rinsed with 1 mL Dulbecco's phosphate-buffered saline (DPBS; –/–; Gibco™, Thermo Fisher Scientific) once and harvested by adding 1 mL ReLeSR™ (STEMCELL Technologies) for 30 s at room temperature. The solution was removed except for a thin film and incubated for 90 s, and the dish was occasionally tapped gently on the bench. The undifferentiated cell colonies were detached by rinsing three or four times with 1 mL StemFlex™ and divided onto new Geltrex™-coated culture dishes.
Gene editing of hiPSCs
For generation of the RFP-LMNB1 cell line, the CL3 cell line was gene edited via a homology-directed repair (HDR)-based CRISPR-Cas9 approach.
Before 70% confluence was reached, cells were detached using TrypLE™ (Gibco™, Thermo Fisher Scientific) according to the manufacturer's instructions. A total of 200,000 cells per nucleofection sample were prepared according to the instructions of the Lonza P3 Primary Cell 4D-Nucleofector™ kit using a 16-well Nucleocuvette™ strip (Lonza). Nucleofection was performed according to the instructions of Integrated DNA Technologies [IDT]) using Alt-R® Cas9 Electroporation Enhancer (IDT), Alt-R® CRISPR-Cas9 tracrRNA (IDT), Alt-R® S.p. Cas9 Nuclease V3 (IDT), and 400 ng of LMNB1_mTagRFP-T HDR plasmid (Addgene 114403) as well as LMNB1 crRNA designed according to Roberts et al. (5′-3′ sequence: GGGGTCGCAGTCGCCATGGCGGG). 18
The nucleofection was performed with the pulses DN-100 and CA-137 in addition to a control (no pulse) with the Lonza 4D-Nucleofector™. Afterwards, hiPSCs were cultivated with 0.1% ROCK inhibitor (Rho-kinase inhibitor, Y-27632; STEMCELL Technologies) and 0.1% Alt-R® HDR Enhancer (IDT) in StemFlex™ medium at 37°C and 5% CO2 for 24 h after which the medium was changed to StemFlex™ medium without further supplements. The fluorescent signal resulting from the knock-in (KI) of the reporter gene was observed by fluorescence microscopy 72 h after nucleofection.
Several days post nucleofection, cells were detached using TrypLE™ (Gibco™, Thermo Fisher Scientific) as described before and centrifuged at 300 g for 5 min. The pellet was re-suspended in DPBS at a concentration below 100,000 cells/mL. Cells that successfully incorporated the fluorescent RFP KI fragment were separated by fluorescence-activated cell sorting (FACS) using the MoFlo Astrios Eq Cell Sorter (Beckman Coulter), adjusting the settings to obtain a uniform pool of LMNB1_mTagRFP-positive cells with high fluorescence. More than 3,000 cells were sorted in one well of a 96-well plate precoated with Geltrex™ and equilibrated with 100 μL StemFlex™ and 0.1 μL ROCK inhibitor.
Cells were further incubated at 37°C and 5% CO2 and cultured, changing the medium every other day. Correct KI integration was further confirmed by hiPSC DNA extraction, polymerase chain reaction amplification (using primers LMNB1_RFP_fw gtgcttctccgttcctctaa, LMNB1_RFP_rev gtctgtggtccacatagtaga, LMNB1_RFP_downstream_fw caacaccgagatgctgta, and LMNB1_RFP_downstream_rev cctggtctactatctgcaca), and Sanger sequencing (Supplementary Fig. S3).
Normal and mixed COs
COs were cultured according to the protocol of Lancaster and Knoblich, 3 and only modifications are stated in the following.
HiPSCs were harvested using TrypLE™, and hiPSC lines (labeled: ACTB-GFP, RFP-LMNB1; unlabeled: CL1, CL2 and CL3) were mixed in respective ratios before centrifugation at 300 g for 5 min at room temperature.
On days 1 and 2 after seeding, the EBs were monitored for their appearance and size using a light microscope. If the EBs showed blurred edges or a diameter <300 μm, half of the medium was aspirated and exchanged with 150 μL fresh hESC medium containing 4 ng/mL bFGF (Peprotech) and 50 μM ROCK inhibitor. On day 3, the medium was changed to hESC medium without supplements. On day 6, the medium was changed to NI medium and then changed every other day until day 11 or 12, when EBs were embedded in growth factor–reduced Matrigel (Corning) droplets.
Therefore, the EBs were removed from the well using a cut 200 μL pipette tip and placed in a mold on a Parafilm® strip. Excess media around the EBs was removed, and a 15–20 μL drop of Matrigel was added to each EB, which was then carefully moved to the middle of the drop using a 10 μL pipette tip. After 25–30 min of incubation at 37°C to allow polymerization of the Matrigel, the Matrigel drops were carefully loosened at the edges using a 10 μL pipette tip, and the parafilm strip was placed upside down into a well of a six-well plate filled with 2 mL DM-A medium. Gentle shaking of the plate detached the Matrigel drops from the parafilm strip so that the parafilm strip could be removed from the well. Embedded EBs were kept at 37°C and 5% CO2 in a humidified atmosphere.
Organoid cryo- and vibratome sections and immunofluorescence staining
COs were fixated in 4% paraformaldehyde (4°C, 90 min), washed twice with PBS, and incubated in a 30% (w/v) sucrose in PBS solution (4°C, overnight). The next day, the COs were embedded in a 1:1 mixture of 30% (w/v) sucrose in PBS and O.C.T. tissue freezing medium (Sakura) in a block form, snap-frozen on dry ice, and stored at −80°C. They were sliced into 16 μm sections using a cryostat (Leica CM3050S), mounted on SuperFrost™ slides (Thermo Fisher Scientific), and stored at −80°C until further use.
For immunofluorescence staining, all steps were performed at room temperature and protected from light, and all washing steps were done with PBS for 4 min, if not stated otherwise. The CO sections were thawed in PBS, and single organoids were circled with a Liquid Blocker Super PAP Pen (Sigma–Aldrich).
After washing twice, the sections were blocked using a biotin/avidin blocking kit (Thermo Fisher Scientific) and then permeabilized and blocked with 0.1% Triton X-100 and 5% normal goat serum (Abcam) in PBS for 1 h. Primary antibodies were diluted in 0.1% Triton X-100 in PBS (β-tubulin III: ab78078, Abcam, 1:500; MAP2: M4403, Sigma–Aldrich, 1:500; PAX6: 60094, STEMCELL Technologies, 1:500; SOX2: MAB4343, Merck Millipore, 1:500; FOXG1: ab196868, Abcam, 1:500) and incubated on the CO sections in a humidified chamber at 4°C overnight.
The sections were washed twice and incubated with the (biotinylated) secondary antibody (B-2770, Thermo Fisher Scientific), diluted in 0.1% Triton-X-100 in PBS, in a humidified chamber for 1 h. After washing twice, the sections were incubated with avidin-TRITC (Thermo Fisher Scientific) diluted 1:1,000 in 0.1% Triton X-100 in PBS. In case of not using a biotinylated antibody, the secondary antibody (A-11001, Thermo Fisher Scientific) was diluted in 0.1% Triton X-100 in PBS and incubated on the sections in a humidified chamber for 45 min. The sections were washed twice and incubated with 0.001 mg/mL DAPI or 0.001 mg/mL Hoechst33342 (Thermo Fisher Scientific) for 15 min. Following two washing steps, the sections were mounted with a coverslip and left to dry overnight.
Vibratome slices were generated according to the protocol by Giandomenico et al. 19 with some modifications. Briefly, mature organoids (35–45 days old) were washed (PBS without Ca2+ and Mg2+) and embedded in 3% low-melting-point agarose (Thermo Fisher Scientific) at 40°C in reusable silicone molds (1 cm3). The agarose blocks were cooled on ice for 10 min and sectioned into slices 300 μm thick in cold PBS using the Leica VT1000S vibrating microtome. Sections were collected in 24-well plates, containing serum-supplemented slice culture medium (DMEM [Thermo Fisher Scientific], 10% fetal bovine serum, 0.5% [w/v] glucose, 1 × [v/v] GlutaMAX [Thermo Fisher Scientific], 1% antibiotic-antimycotic [Thermo Fisher Scientific]), and were incubated for 1 h at 37°C.
After incubation, the medium was replaced with serum-free slice culture medium (neurobasal medium [Thermo Fisher Scientific], 1:50 [v/v] B-27™ supplement [Thermo Fisher Scientific], 0.5% [w/v] glucose, 1 × [v/v] GlutaMAX [Thermo Fisher Scientific], 1% antibiotic-antimycotic [Thermo Fisher Scientific]). Sections were cultivated at 37°C, 5% CO2, and the medium was exchanged every other day.
Widefield and confocal microscopy
Developing fluorescently labeled EBs were regularly imaged using an Olympus IX51 inverted microscope equipped with a 10 × objective.
Immunofluorescence stained CO sections were imaged with a Leica TCS SP8 confocal microscope system using a 10 × dry objective (0.3 NA) or 100 × oil objective (1.4 NA) and a 405 nm and white light laser with excitation wavelengths of 405 nm (DAPI/Hoechst), 488 nm (eGFP), and 551 nm (TRITC) and emission wavelengths of 461 nm (DAPI/Hoechst), 509 nm (eGFP), and 576 nm (TRITC). The detection ranges were 410–463 nm (DAPI/Hoechst), 493–592 nm (eGFP), and 556–701 nm (TRITC).
Images were recorded in a sequential scan at a scan speed of 600 Hz into 5,648 × 5,648 (10 × ) or 2,640 × 2,640 (100 × ) images. Hybrid detectors were used for eGFP/FITC/TRITC and a photomultiplier tube detector for DAPI/Hoechst. For tile scans, 465 × 465 μm areas (3 × 3 tiles) were recorded in the x and y directions. LAS X-software was used for data analysis. To improve resolution, a deconvolution process was performed via HyVolution 2 in the Huygens Essential Automatic approach, taking the refractive index of the mounting medium into account. Alternatively, immunofluorescence-stained samples were analyzed using a Keyence BZ-X fluorescent microscope.
Results
Setup of the mixed organoid approach using CRISPR/HDR labeling of hiPSCs
High inter-organoid variability is a tremendous problem when it comes to comparability in studies using COs. As an innovative approach for overcoming this variability, we have established the concept of mixed organoids. By mixing two different cell lines, which are differently labeled, it is possible to combine control and mutation-containing cells within one organoid while still being able to differentiate between them. This novel method of creating COs allows ideal comparison between control and mutated cells.
In this very first approach of mixed, gene-edited COs, we have tested the feasibility of the mixed organoid method. Mixed organoids were derived from hiPSCs, which were obtained by reprogramming patient-derived fibroblasts (Fig. 1A). 20 Within our approach, we used a commercially available, gene-edited β-actin (ACTB-GFP) hiPSC line (Fig. 1B). In addition, we labeled the lamin B1 protein (LMNB1) in different cell lines and included a red fluorescent protein (RFP).
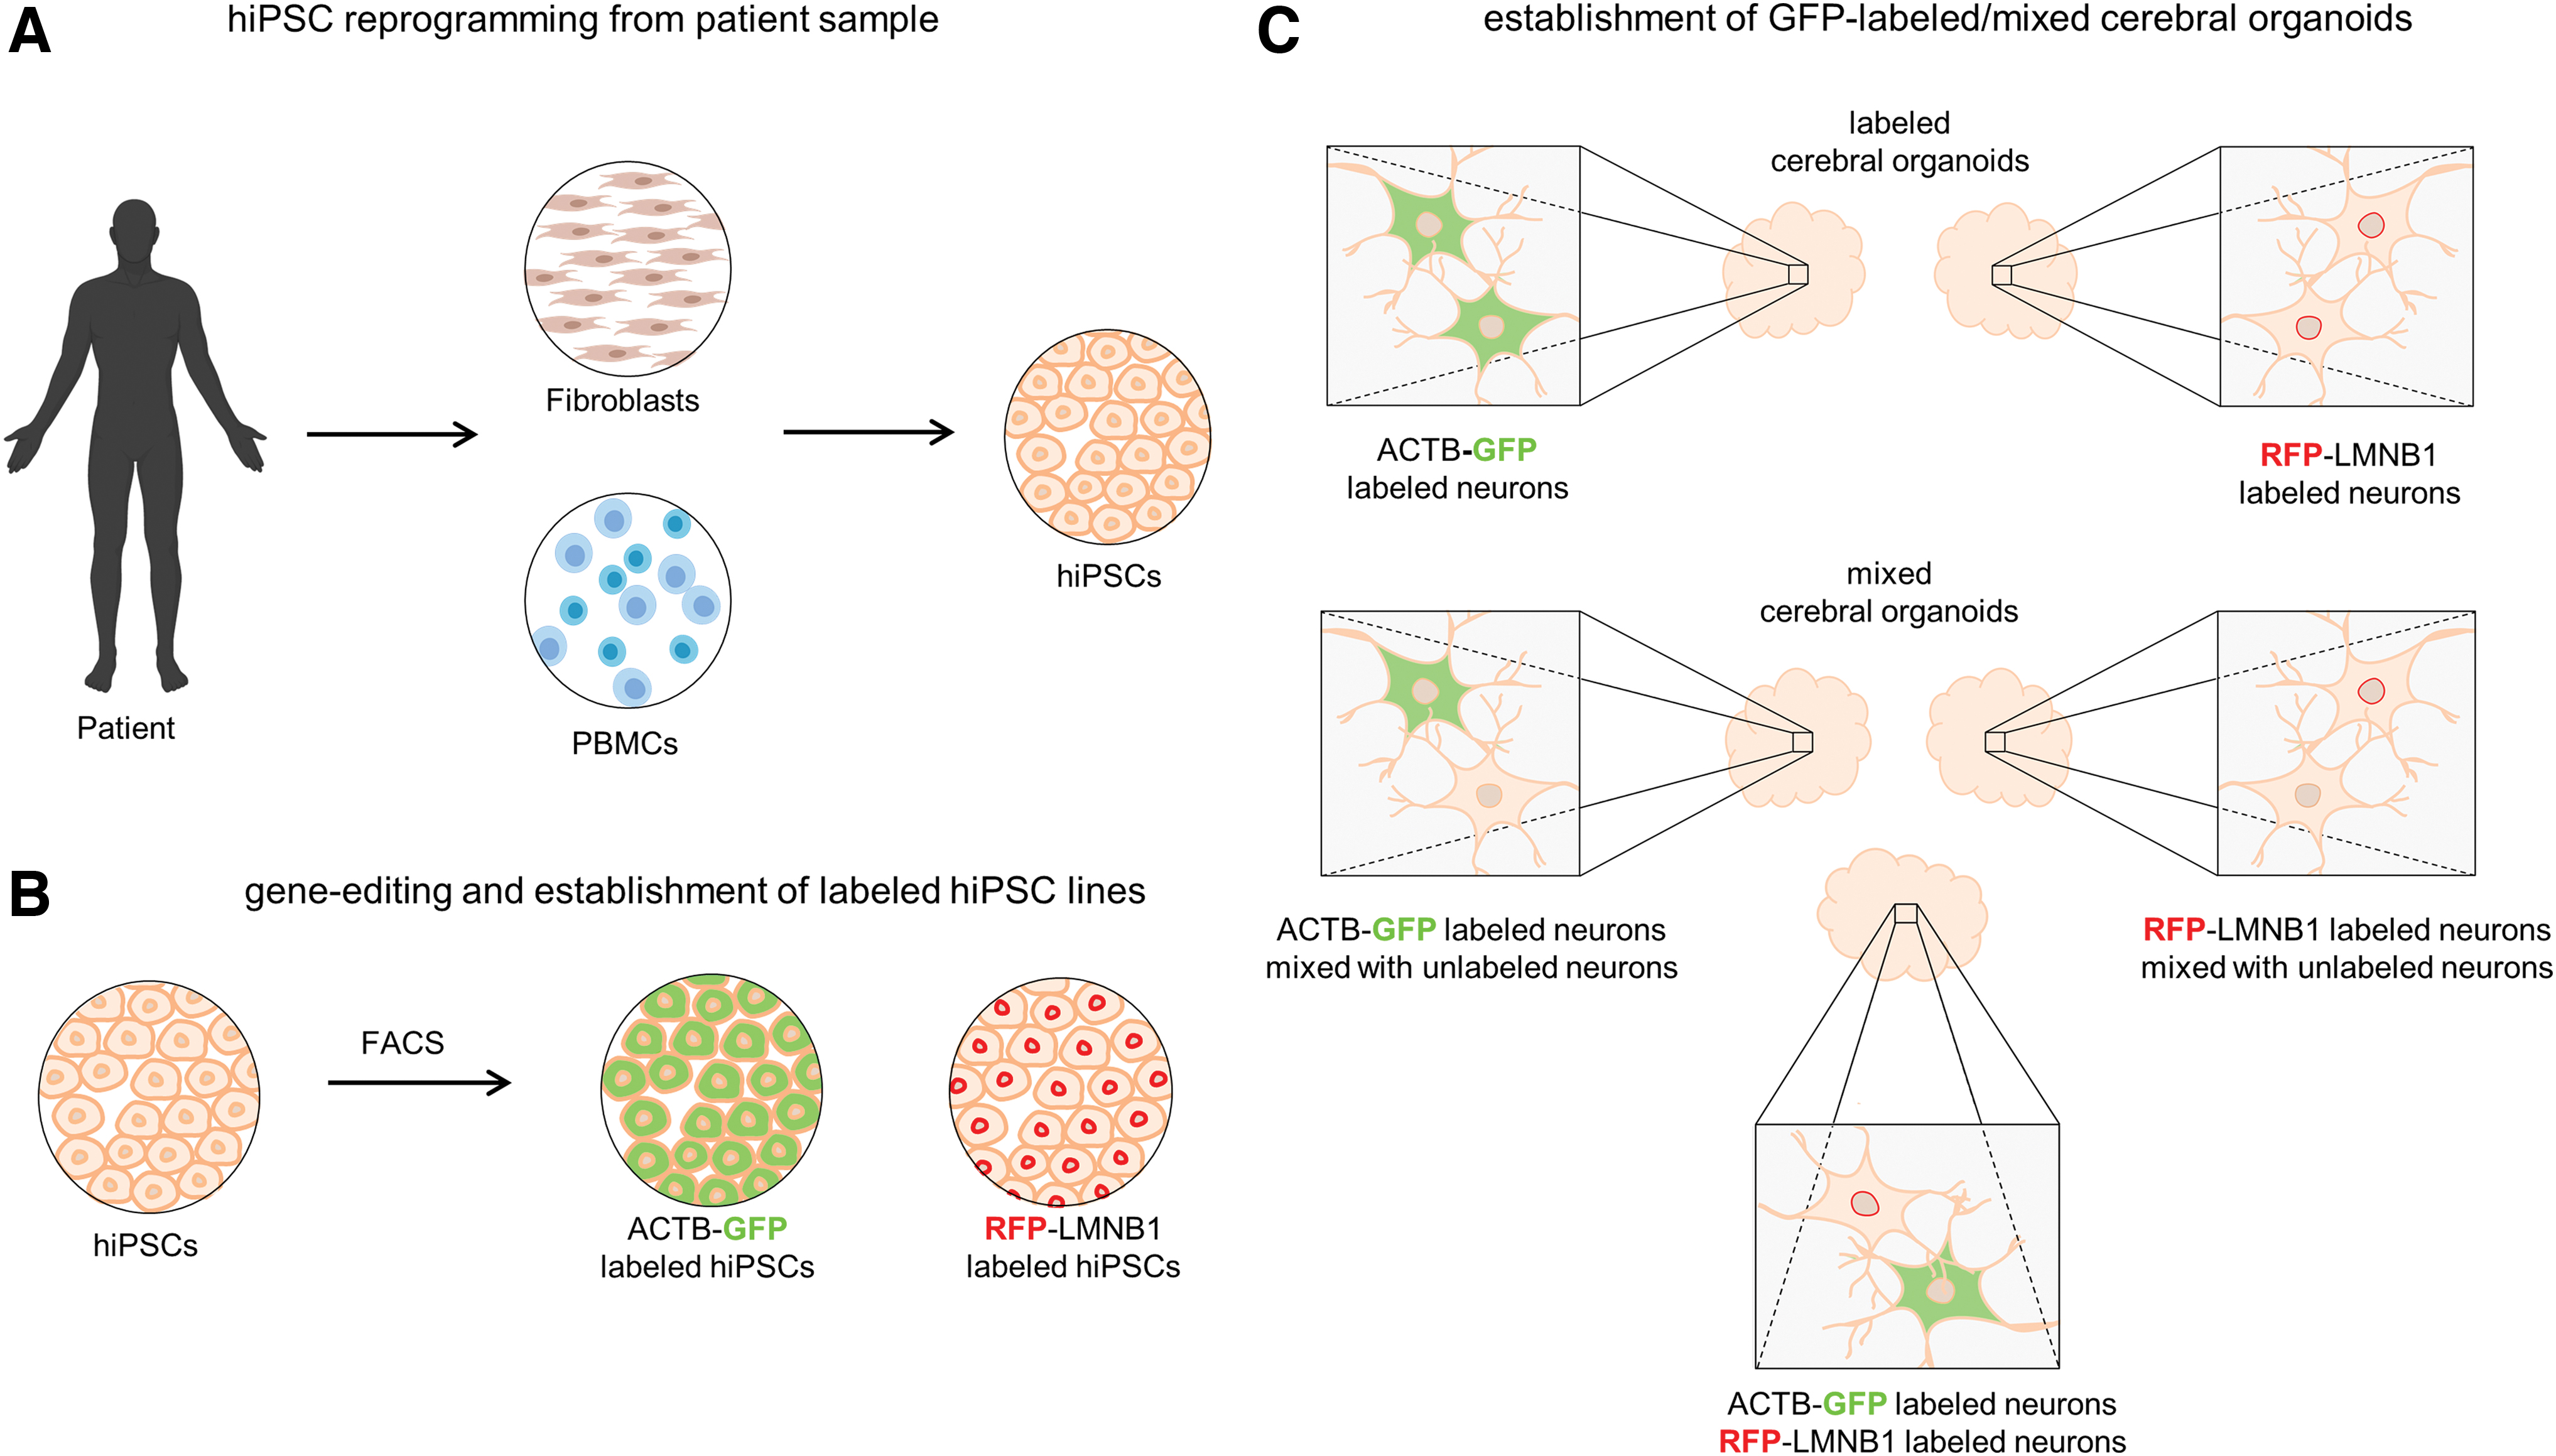
From patient-derived samples to gene-edited mixed cerebral organoids (COs).
To generate the latter, a CRISPR-Cas9 HDR approach was used, and RFP was fused N-terminally to the LMNB1 gene as shown previously. 18 Upon FACS, pure RFP-LMNB1 hiPSCs were obtained and subsequently used for CO differentiation (Fig. 1C). As an initial approach, we aimed to test the pluripotency of the edited cells to differentiate into COs. 3 Successful differentiation would result in a labeled CO with a GFP-positive β-actin signal in the cytosol or an RFP-positive outlined nucleus, respectively. Furthermore, mixtures of the fluorescently labeled cells were expected to result in COs, in which each cell is traceable to its original hiPSC line (Fig. 1C).
Gene-edited ACTB-GFP hiPSCs develop like regular COs
As an initial approach, we aimed to test the impact of the ∼25 kD GFP fusion tag on the potential of hiPSCs to establish COs. After seeding, ACTB-GFP hiPSCs demonstrated formation of EBs with sharp edges and a round shape (Fig. 2A). On day 6, when neural induction had started, the EBs had grown visibly in size and had lost their completely round form. On the day of embedding (day 12), the formation of epithelial buds was observed. The size and extent of the budding increased in the subsequent weeks, and an organized layering was evident (e.g., day 36).

Differentiation of ACTB-GFP COs. Gene-edited hiPSCs with an ACTB-GFP fluorescence label were seeded to form embryoid bodies (EBs) and cultured to develop into COs.
The endogenous ACTB-GFP labeling enabled us to study the development by fluorescence microscopy, revealing an evenly distributed GFP signal (Fig. 2B). Due to the increasing organoid diameter and a limited laser excitation penetration depth, fluorescence imaging was restricted to the first ∼14 days. However, preparation of living vibratome sections according to published protocols 19 enabled the study of older organoid sections in real time during cultivation (Fig. 2D). Live imaging revealed reorganization of some parts within the CO (Supplementary Video S1).
Within the whole period of differentiation, the size of the edited organoids was comparable to that of nonedited cell lines (CL1) with different genetic backgrounds (Fig. 2C). Late ACTB-GFP organoids (>30 days) tended to be smaller in size than CL1 organoids, although this difference failed to achieve significance.
Fluorescence microscopy using higher resolution (100 × ) demonstrated the development of CO substructures (Fig. 2E). The first two images show the development of a layered structure containing lumen, a ventricular/subventricular zone, and a cortical plate (corresponding Supplementary Videos S2 [z-scan] and S3 [time scan]). The third image demonstrates growth of the organoid layer by layer (Supplementary Video S4). The last image demonstrates the β-actin related cyto-architecture of the living organoid in high resolution (Supplementary Video S5).
Mixed organoids of two different nonisogenic hiPSC lines grow and differentiate like monocellular organoids
Seeding of ACTB-GFP hiPSCs mixed with unlabeled hiPSC lines with a different genetic background (CL1, CL2, CL3) in different ratios led to the formation of EBs with defined edges and a round shape comparable to monocellular derived organoids (Fig. 3A and Supplementary Fig. S1A). Compared with ACTB-GFP EBs, mixed EBs containing CL1 and CL2 had a less regular shape after seeding and exhibited a deformation of shape after neural induction (day 6). However, this did not affect successful development of the neuroectoderm, as is apparent from the translucent edges, or the formation of neuroepithelial buds after Matrigel embedding (day 12). Similar to pure ACTB-GFP COs, an increase in size and extent of budding could be observed.

Development of mixed COs. COs were generated from ACTB-GFP gene-edited hiPSCs mixed with different hiPSC lines (CL1; CL2 and CL3 in Supplementary Fig. S1A) in different ratios.
The endogenous label was observable by fluorescence microscopy imaging of whole EBs seeded from 75% ACTB-GFP and 25% CL1/CL2 hiPSCs as well as EBs seeded from 50% ACTB-GFP and 50% CL3 hiPSCs, whereby a difference from pure ACTB-GFP EBs was particularly evident in 50% ACTB-GFP EBs, revealing a more speckled-like distribution of the GFP marker, which is only visible in 75% ACTB-GFP EBs on day 1 (Fig. 3B and Supplementary Fig. S1B). Moreover, ACTB-GFP and mixed organoids were fixated at different time points of differentiation, cryosectioned, and immunofluorescently stained for neuronal marker β-tubulin III (Supplementary Fig. S2), which revealed progressive differentiation and preservation of the ACTB-GFP endogenous fluorescence.
Mixed EBs also showed progressive growth starting at ∼500 μm in diameter, with a rise after Matrigel embedding, and reached an average diameter of ∼2,500 μm after 40 days of cultivation (Fig. 3C and Supplementary Fig. S1C, shown for three different cell lines with different mixtures), which was in line with pure ACTB-GFP COs (Fig. 2C) and unlabeled controls. A significant difference in size development between COs seeded from different ratios of ACTB-GFP and CL1/CL2/CL3 hiPSCs was not discernable (Supplementary Fig. S1D), pointing to the applicability of the approach to comparative differentiation studies.
After 28 days of differentiation, COs were fixated and sliced in order to assess the GFP distribution throughout the whole organoid in more detail (Fig. 3D). Positive fluorescence of the whole 100% ACTB-GFP organoid slice was revealed, as expected, by 10 × overview confocal fluorescence microscopy imaging. Imaging of organoids differentiated with decreasing ratios (75%, 50%) of ACTB-GFP cells demonstrated a reduction in the overall fluorescence intensity (Fig. 3D). The distribution of the GFP signal within the organoid slices was further assessed by quantitative analysis of the GFP signal relative to the DAPI signal (Fig. 3E), which revealed a proportion of approximately 80% GFP-positive cells in initial 75% COs and approximately 60% in initial 50% COs, thus indicating that the GFP ratio varies only slightly during growth.
High-resolution imaging (100 × objective) demonstrated a patterned distribution of the GFP signal in 75% and 50% mixed COs (Fig. 3F), including GFP-positive areas as well as unlabeled areas within the same organoid. As a consequence, each single cell is assignable to its origin, to the GFP-labeled or the nonlabeled hiPSC line.
Mixed organoids demonstrate differentiation like monocellular organoids
As a next step, gene-edited monocellular and mixed cryosectioned COs were analyzed in respect to their cerebral differentiation in order to review the development and maturation of mixed COs in comparison with common COs. Immunofluorescence staining was utilized to assess cortical structures by using neuronal progenitor (PAX6) and neuronal (β-tubulin III, MAP2) markers. Imaging revealed ventricle-like structures, including a PAX6-positive layer of radial glia (Fig. 4B) forming the (sub-)ventricular zone (VZ/SVZ) that surrounds a central lumen (Lu) and migrates into a β-tubulin-III-positive layer of immature neurons (Fig. 4A) constituting a cortical-plate-like layer. Similar cortical structures could be observed in pure ACTB-GFP COs as well as in mixed COs (Fig. 4C and D).
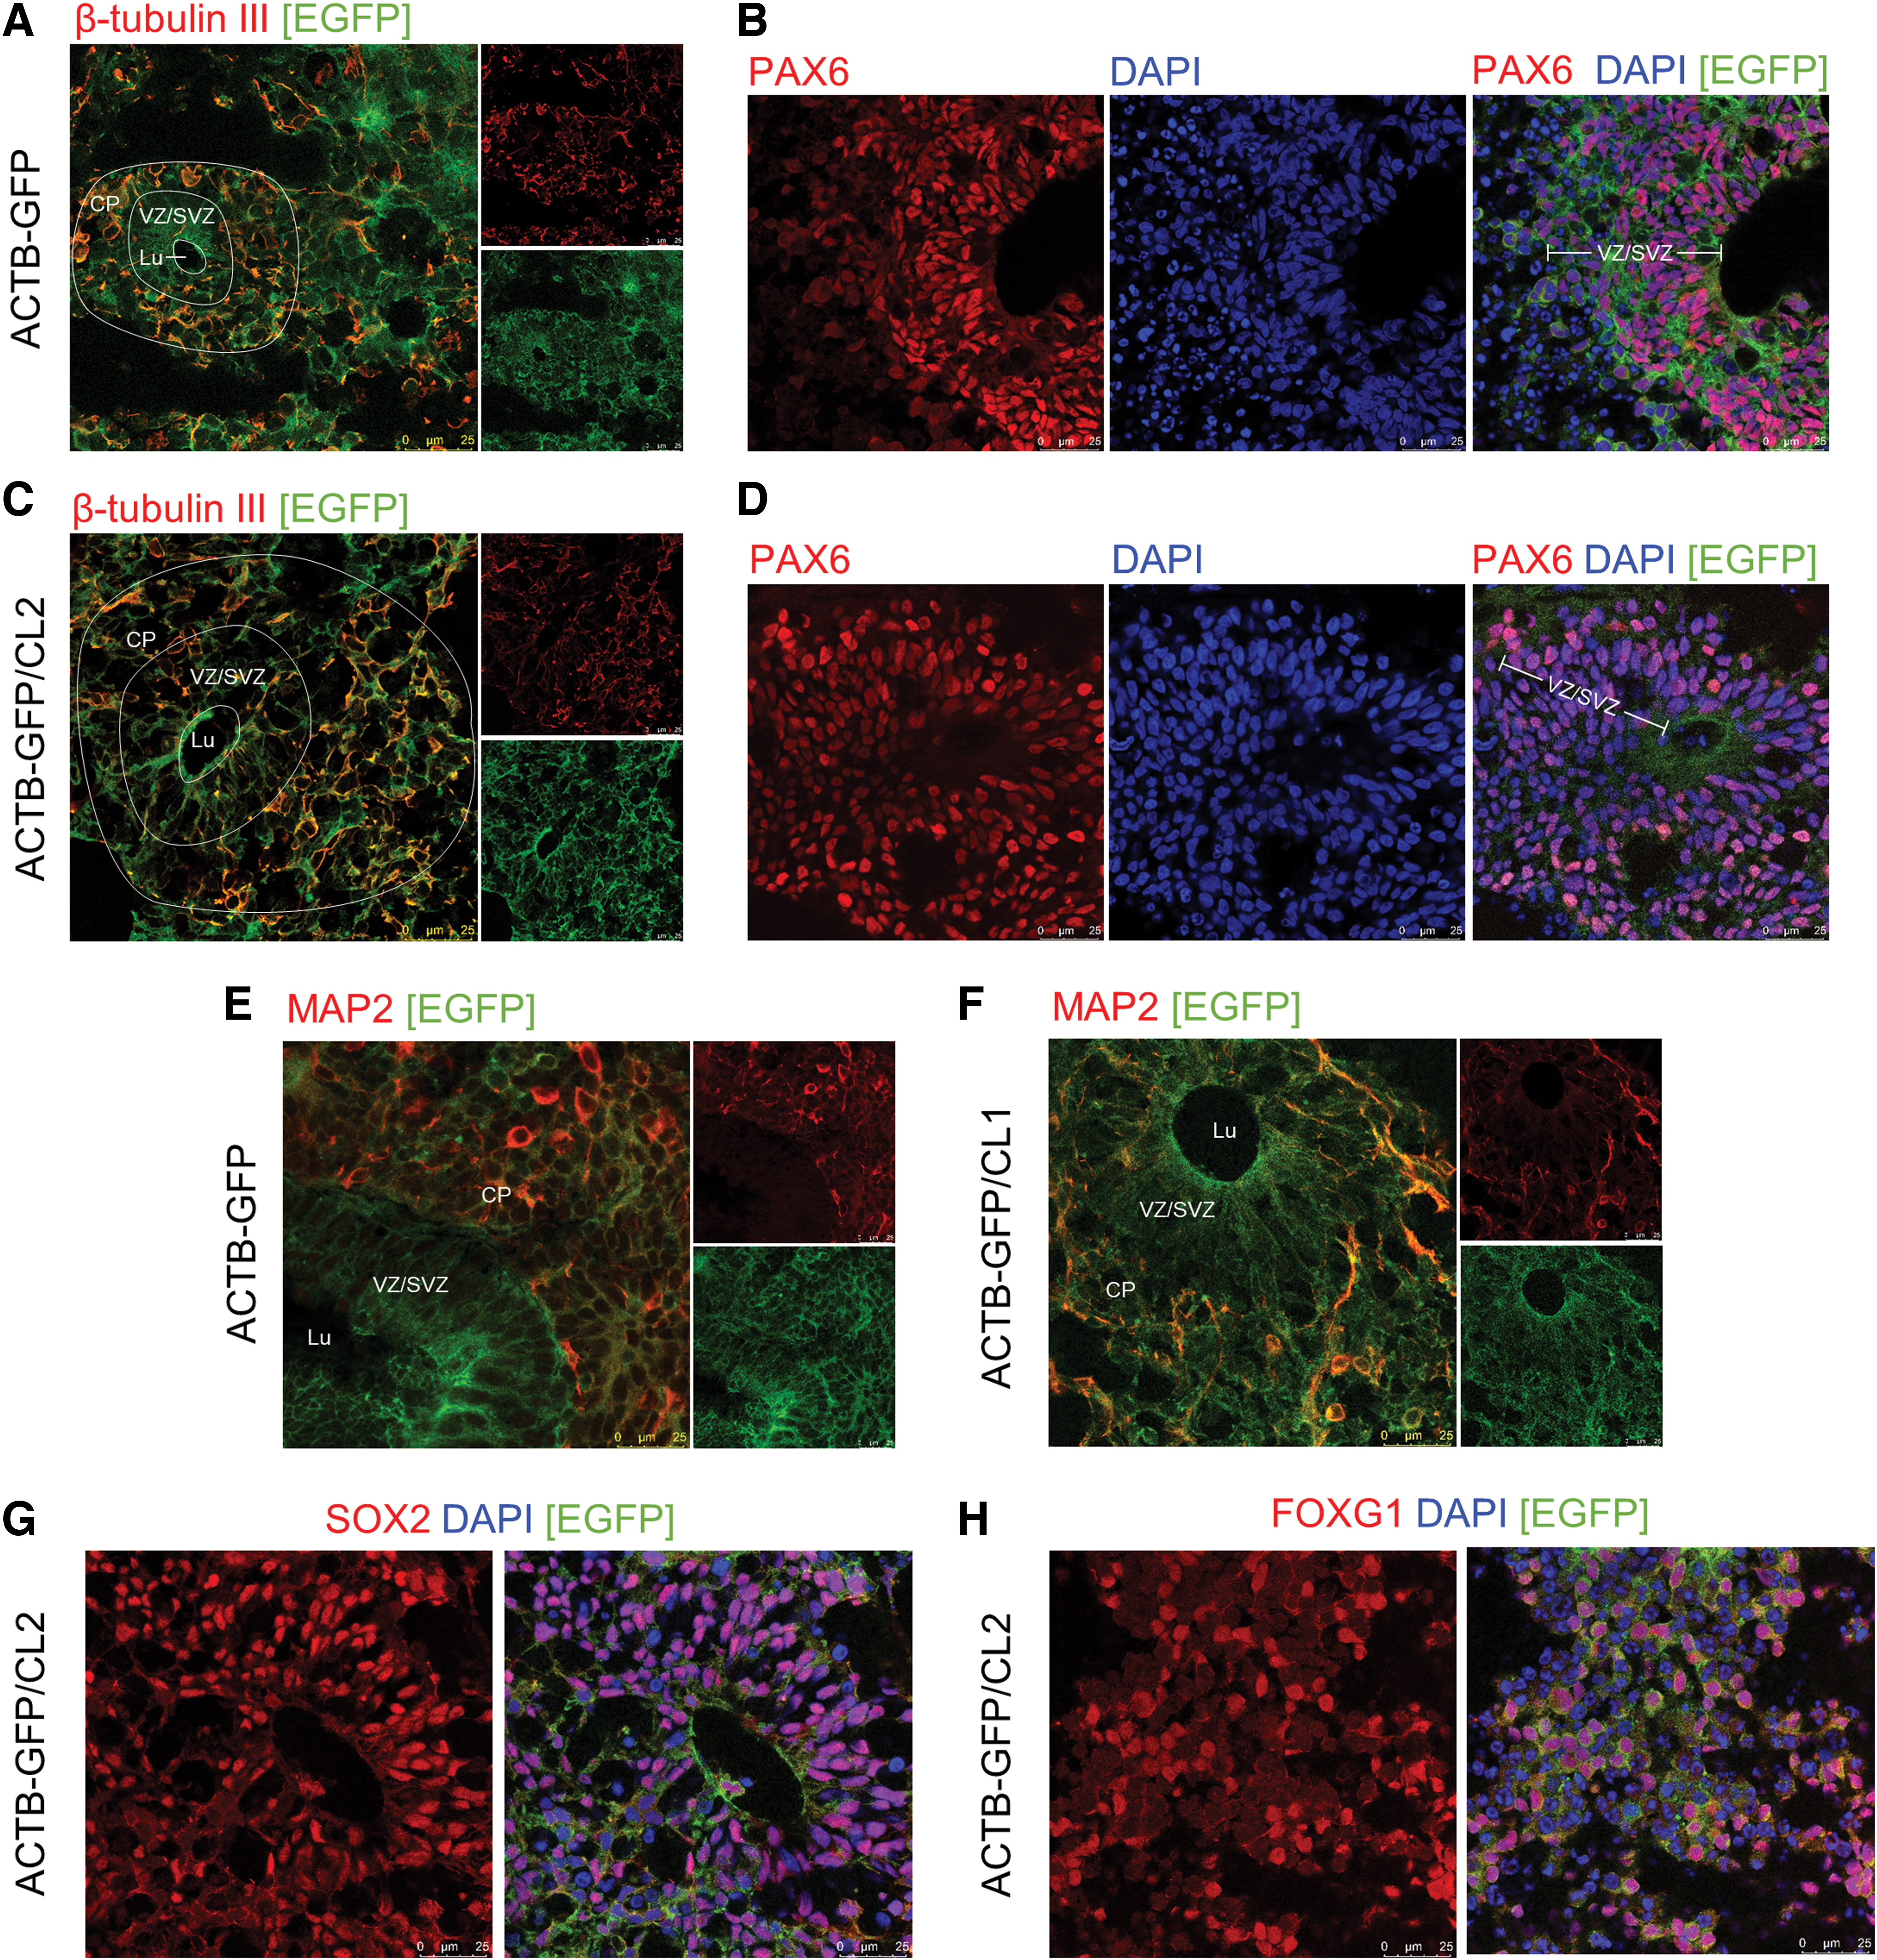
Differentiation of cortical structures in ACTB-GFP and mixed COs.
Additional staining against neuronal dendrite marker MAP2 showed the presence of mature neurons in the cortical plate-like layer surrounding the (sub-)ventricular zone and lumen in ACTB-GFP (Fig. 4E) and in mixed COs (Fig. 4F). Ventricular zones were additionally determined by SOX2-positive areas according to the positive PAX6 staining (Fig. 4G). Further, a number of organoids displayed forebrain differentiation as revealed by FOXG1-positive regions (Fig. 4H).
Taken together, immunofluorescence analysis indicates successful development of especially cortical structures in both uniform and mixed organoids. Thus, our results reveal that it is possible to create mixed organoids from two different cell lines and that these mixed COs differentiate and mature like common COs, despite the fluorescence tag.
Proof of principle: mixed organoids from RFP-LMNB1 hiPSCs
In order to validate the mixed organoid approach, the nuclear envelope protein lamin B1 was targeted, and an N-terminal RFP-tag was incorporated into the LMNB1 gene of the CL1 and CL3 cell lines using a CRISPR-Cas9 HDR approach (Fig. 5A). 18 KI cells were sorted by FACS in order to obtain uniform pools of LMNB1_mTagRFP-positive cells. Seamless and InDel-free KI was verified by Sanger sequencing for the endogenous backbone to homology arm transition as well as for the CRISPR-Cas9 sgRNA-driven cleavage site in LMNB1 (Supplementary Fig. S3).
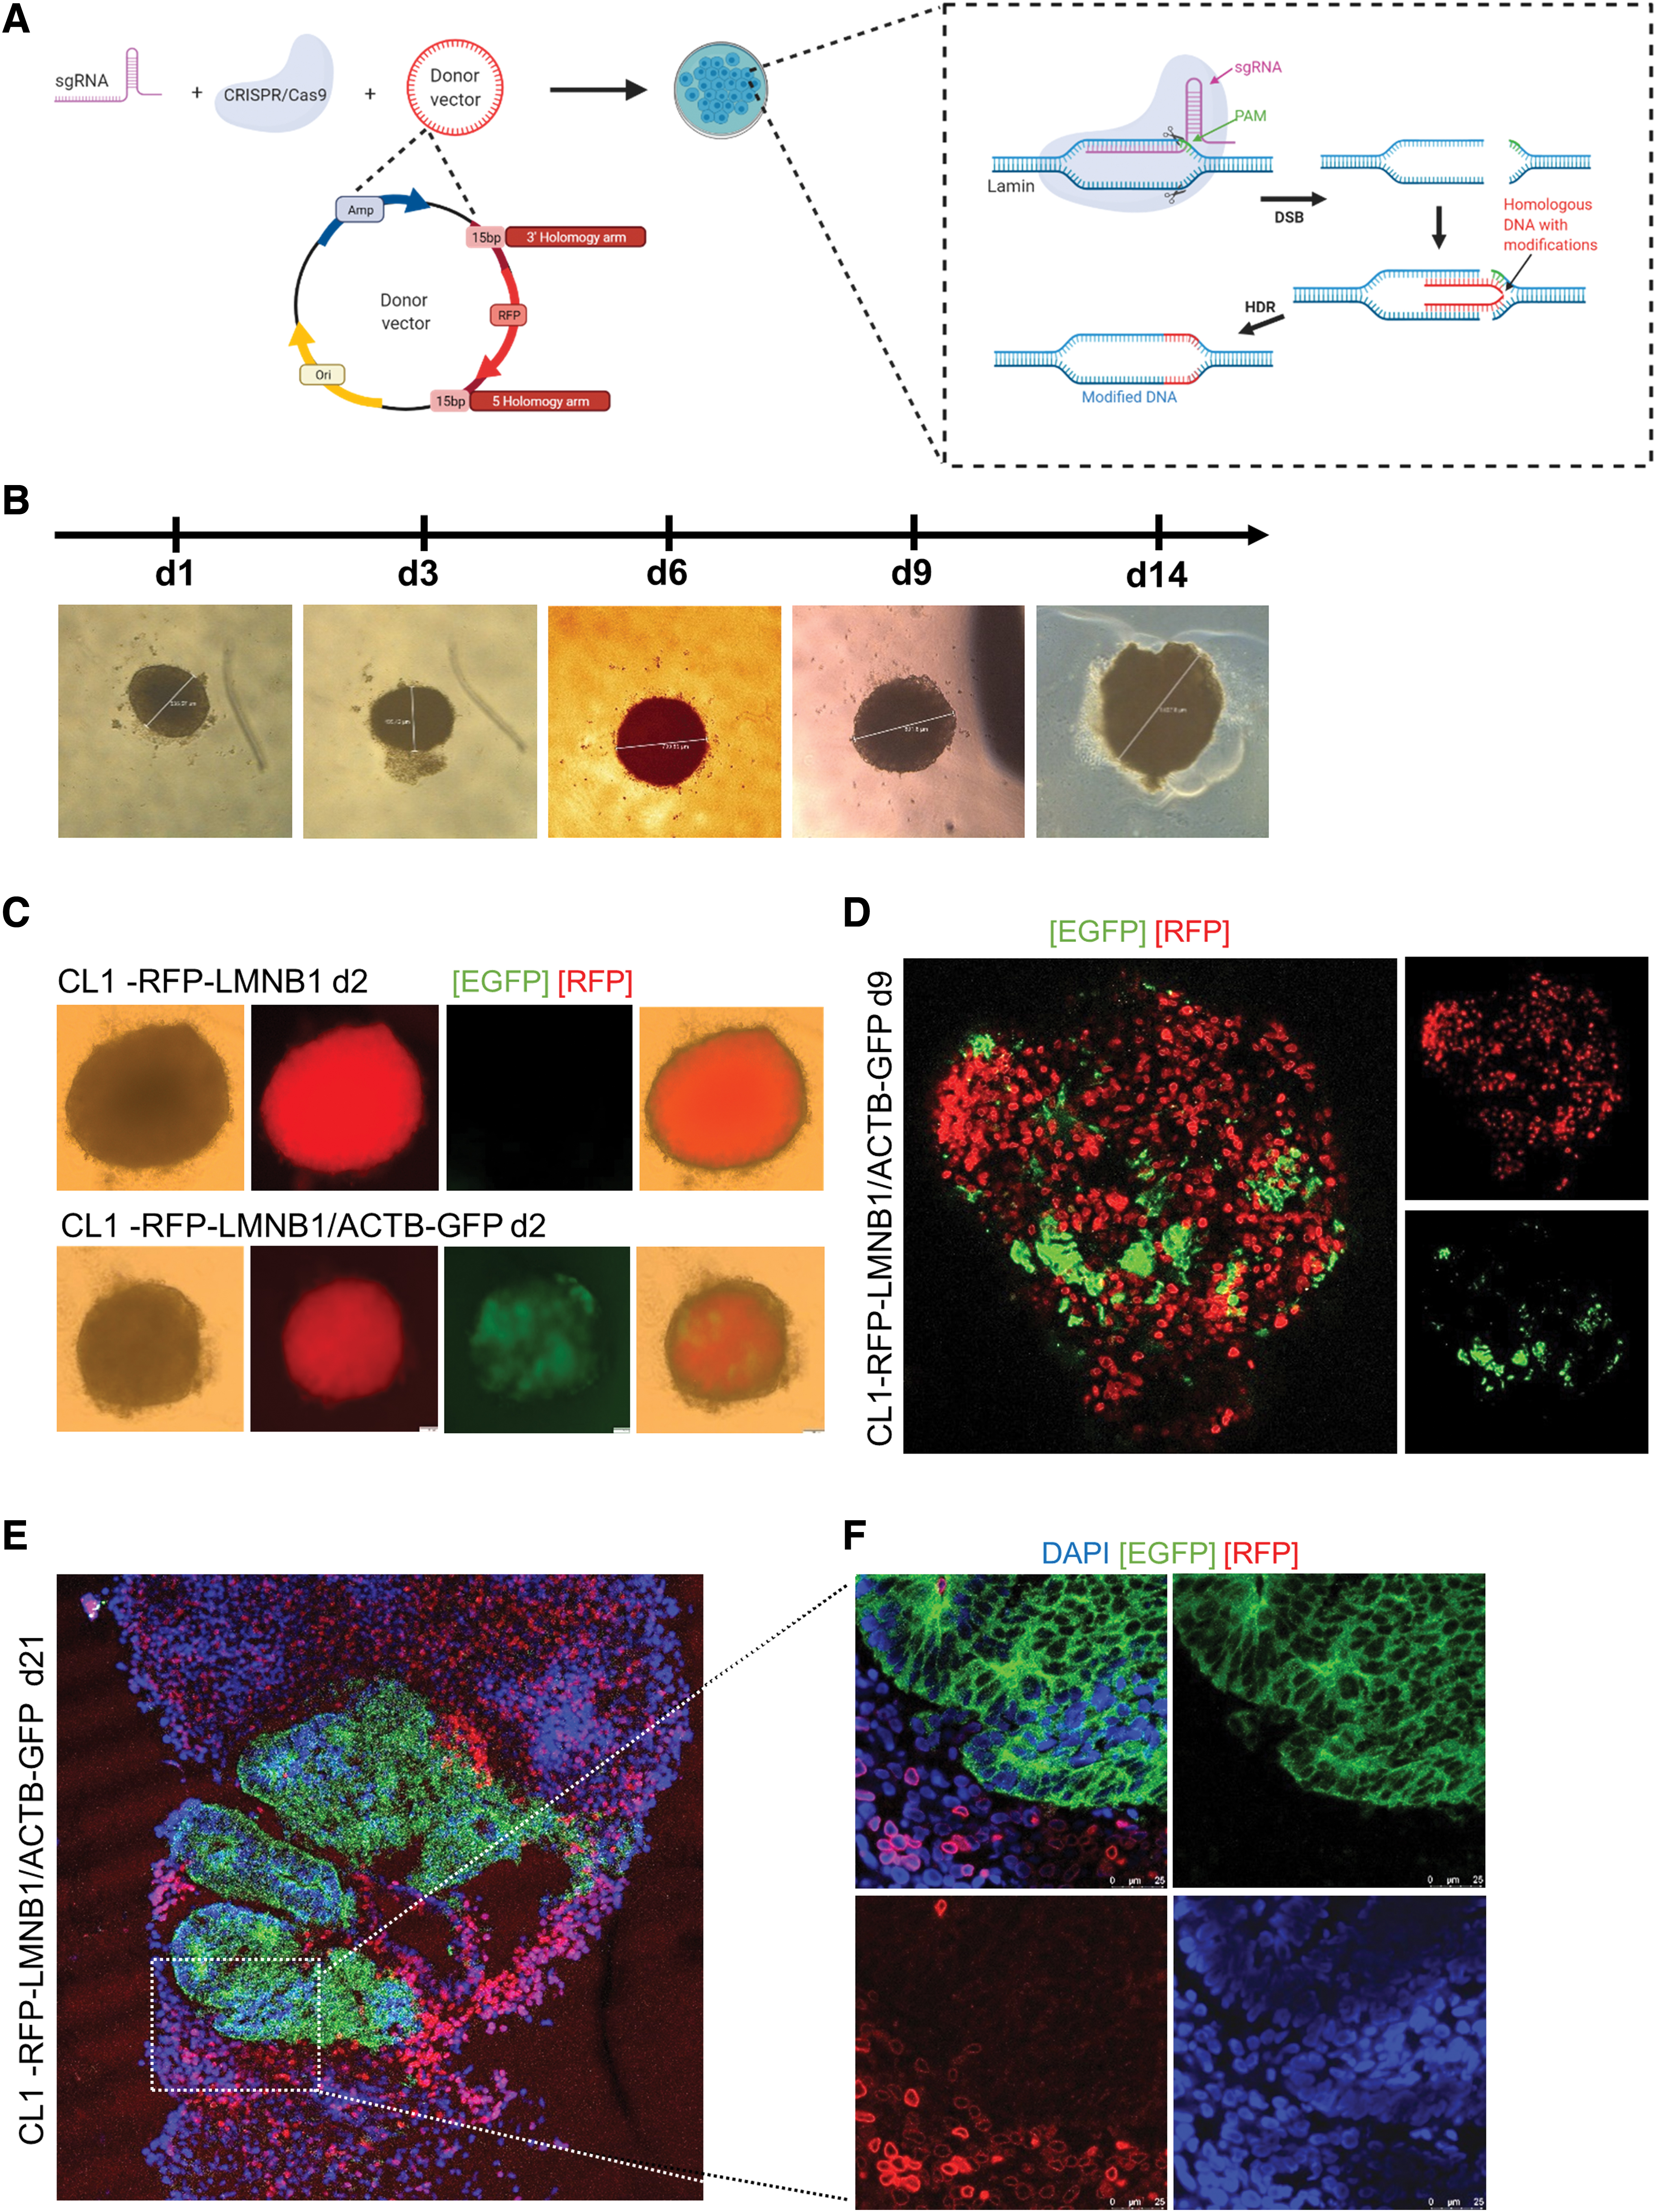
Gene-edited RFP-LMNB1 and related mixed organoids to validate the concept of mixed labeled organoids.
Edited hiPSCs showed a prominent fluorescent signal from the nuclear envelope. They were highly viable and proliferated similar to the parental line, as assessed by regular control of healthy morphology and growth of the cells. The LMNB1_mTagRFP-positive cell lines retained their pluripotency, as shown by their potential to develop EBs being similar to other EBs in respect of their roundish shape with defined edges and translucent edges from the age of 8 days (Fig. 5B).
When analyzed by fluorescent microscopy, EBs differentiated from RFP-LMNB1 as well as EBs from 50% RFP-LMNB1 and 50% ACTB-GFP showed normal development with an apparent pattern-like distribution of the fluorescence-labeled cells as early in development as day 2 (Fig. 5C and Supplementary Fig. S4A). Moreover, confocal fluorescence analysis of 9-day-old whole organoids generated from 50% RFP-LMNB1 and 50% ACTB-GFP demonstrated the uneven distribution of the different cell lines within the organoid (Fig. 5D).
These results have been further confirmed by confocal analysis of cryosectioned organoids (Fig. 5E), which demonstrated cell-line-specific areas within one mixed organoid comparable to the results obtained from ACTB-GFP and nonlabeled mixed COs (Fig. 3E). Fluorescence imaging of older organoids (day 63) demonstrated that this differential separation or pattern-like distribution was maintained over time (Supplementary Fig. S4B and C). High-resolution imaging of CO slices (Fig. 5F) revealed two populations: cells derived from RFP-LMNB1 hiPSCs with a distinct red fluorescence of the nuclear envelope, and cell patterns derived from the ACTB-GFP hiPSCs with green cytoplasmic fluorescence.
These results together highlight the feasibility of the mixed organoid approach, enabling the comparison of two different hiPSC-derived cell patterns within the very same organoid. This opens up a path to a new organoid model that allows incorporation of the control within the same organoid overcoming inter-organoid variability and offering a great improvement in comparability for a wide range of studies, including in particular the investigation of disease-underlying mutations.
Discussion
Mixed COs are hybrid tissues derived from two or more different hiPSC lines. In this work, we demonstrated the feasibility of the mixed organoid approach by developing COs from different mixtures of gene-edited hiPSCs with an endogenously expressed ACTB-GFP, an RFP-LMNB1 label, or without label. These COs exhibited normal growth comparable to nonedited COs, and they maintained their fluorescence signal during differentiation and cultivation at high endogenous levels, which are detectable using regular fluorescence microscopy available in most cell culture labs. Mixed COs developed cortical structures, including ventricle-like areas, indicating successful differentiation of brain-like features.
Since hiPSCs of different genetic background were used, it can be suggested that the genetic background is negligible in terms of the overall growth of mixed COs. However, these results are based on a limited number of cell lines for the mixed CO approach, and other combinations, especially with larger genetical differences or the use of cell lines with significant proliferation differences, might cause changes in terms of organoid development. Likewise, an identical genetic background could alter the results in terms of the distribution of cells with specific origin within the organoid.
We further demonstrated that individual cells within the mixed COs could be matched to their respective origin according to their specific label, which is true for all cells, including neurons, glial cells, neuronal precursors, and so on. Mixed COs generated from nonisogenic lines as shown in this work developed patch-like patterns with distinct areas originating from the two hiPSC lines.
Mixed COs are a promising approach because of the current limitation of normal COs that exhibit high inter-organoid variability, complicating the comparison among themselves, (e.g., of a patient-derived CO and a healthy control CO).10,13,21 The specific labeling of hiPSCs with different markers as shown in our approach overcomes this limitation because it allows the combination of two (or more) cell lines to differentiate a hybrid organoid containing both the patient- and control cells within the very same organoid, which allows a more reliable and direct comparison of both conditions.
This comparison can include cell-to-cell analyses (healthy cells could be analyzed among each other, as well as disease cells), but as a consequence of the patch-like differentiation, the comparison of patient-derived neuronal clusters with control clusters is feasible as well. Both cell-to-cell and cluster comparison could be helpful for the assessment of a disease phenotype and molecular pathway analyses or functional studies, including calcium imaging or electrophysiology.
An ideal experiment would include a patient-derived hiPSC line (diseased) and its isogenic (healthy) control, which might result in a completely mixed phenotype, in contrast to the patch-like phenotype in this work, corresponding to a mosaic analysis to study a specific mutation in a cellular three-dimensional wt background, which would correspond to a more convenient approach to study healthy versus mutant cells.
The use of an endogenous fluorescent marker enables the detection of changes on a cellular level in live organoids caused by morphological alterations or cell death. As COs are developing live tissues, the experiment might also benefit from the endogenous fluorescent marker in regard to the precise time point for downstream assays, for example the determination of the exact age when a mutation causes structural changes within the organoid in order to schedule drug treatment experiments.
To obtain the best results, the selection of a suitable fluorescent marker is crucial: the protein to be fluorescently labeled should be of high abundance and expressed in almost all cell types and should not correlate with the disease under investigation because large markers might affect the stability or cleavage of a protein. 15 To increase the reliability of the experiment further, vice versa labeled hiPSCs and derived organoids are indicated. A clear advantage is the direct visibility in the organoid with no need for further staining (e.g., with myc tag staining).
Long-term observations of developing organoids are possible using vibratome sections, which also allow drug treatment analyses, for example. Furthermore, the endogenously expressed fluorescent label enables easy establishment of a labeled hiPSC line or uniform pool of labeled cells, as the fluorescent activated cell sorting allows the fast assessment of the cell line purity.
Another strength of the novel mixed CO approach is its straightforward integration into downstream analytics. As an example, scRNAseq analyses from COs benefit from the prelabeled hiPSCs in the respect that expression profiles from the patient cells can be separated from that of the control by including the respective marker as a discriminator in the data analysis pipeline. While many replicates had to be studied in the past in order to achieve sufficient statistical power, the mixed CO approach is capable of significantly reducing the number of biological and technical replicates.
Future studies investigating human disease relevant mutations are indicated to unravel the potential of mixed COs completely. In addition to this, the approach is of relevance for personalized medicine. For example, a patient suffering from a psychiatric disorder is currently treated using a trial-and-error technique in order to find the most effective medication. In future, these patients might benefit from the mixed organoid method. Using low invasive blood sampling, PBMCs are derived and used for reprogramming into hiPSCs. Subsequent differentiation of mixed COs (using a [primary] relative sample as control) and pharmacological testing of hundreds of agents on mixed CO might significantly shorten the search for appropriate treatment.
Footnotes
Acknowledgments
We want to give our thanks to Prof. Dr. Andreas Faissner and Dr. Ursula Theocharidis (Department of Cell Morphology and Molecular Neurobiology, Ruhr University, Bochum) for instructing us on and giving us access to their nucleofector.
Author Disclosure Statement
We have no conflicts of interest to disclose.
Funding Information
This work was supported by funding from Deutsche Forschungsgemeinschaft (DFG) (MU3525/3-2), Mercur (Pr-2016-0010) and the Federal Ministry of Education and Research Germany (Bundesministerium für Bildung und Forschung; BMBF) (OrganSARS, 01KI2058). The instrument Leica TCS SP8 was supported by an instrument grant from the German Research Foundation (INST 213/886-1 FUGG) as well as the Beckman Coulter MoFlo Astrios Eq Cell Sorter (INST 213/950-1 FUGG).
References
Supplementary Material
Please find the following supplemental material available below.
For Open Access articles published under a Creative Commons License, all supplemental material carries the same license as the article it is associated with.
For non-Open Access articles published, all supplemental material carries a non-exclusive license, and permission requests for re-use of supplemental material or any part of supplemental material shall be sent directly to the copyright owner as specified in the copyright notice associated with the article.