




Abstract
Abstract
Since the hierarchical stages of a customer purchasing decision or innovation adoption process are interrelated, an analysis of all their stages, including awareness, want, and adoption, in relation to product or service diffusion, is urgently needed. Therefore, this study proposes the use of an awareness and want matrix, together with an adoption gap ratio analysis, to assess the effectiveness of innovation and technology diffusion for e-services. This study also conducts an empirical test on the promotion performance evaluation of 12 e-services promoted by the Taiwanese government.
Introduction
Governments throughout the world have formulated concrete actions and allocated a huge budget to promote Internet usage and ensure that their citizens are provided with digital opportunities for different kinds of services,13,14 such as the FCC strategy plan (United States),15,16 e-Japan and U-Japan,17,18 e-Korea and U-Korea,
19
e-Hungary,
20
and e-Taiwan,
21
M-Taiwan, and i-Taiwan.22–24
Making rational choices regarding funding allocations from the customer behavior viewpoint has become a serious issue that should be discussed and solved. Therefore, the two main aims of this study are as follows:
To propose an awareness and want matrix with an adoption gap ratio analysis (AWA gap analysis) for the comparison of different e-services, from a customer behavior viewpoint. To conduct an empirical study assessing the diffusion effectiveness of e-services promoted by the Taiwanese government.
Literature Review
E-service
The Internet is a new advertising medium, a big direct-mail catalogue, a commodity marketplace, a new sales channel, and a big encyclopedia. 25 When customer service is supplied over the Internet, it is referred to as “e-service.” 26 E-service has been defined as a web-based service 27 or an interactive service delivered over the Internet. 28 It has also been defined as deeds, efforts, or performances with delivery functions mediated by information technology (the Web, information kiosks, and mobile devices). 29 E-service includes the service element of e-retailing, customer support and service, and service delivery. 30
Voss
31
emphasized that e-service may be delivered separately or together with e-commerce. E-service can provide not only basic commerce functions, such as online catalogues, online transactions, and order fulfillment, but also a series of customer-oriented activities, such as online help, configuration, and customization, as well as security mechanisms.
9
E-services range from the electronic provision of traditional services, such as banking (e.g., E*TRADE), investing (e.g.,
As consumer behavior continues to expand in cyberspace, it is important to understand the role of e-service in this new arena. However, the theory and practice of e-service is still in its infancy. 34 Over the past 10 years, researchers have begun to discuss customer acceptance of e-service using TAM 8 and TPB,9,10 which are both adaptations of TRA. 7 TAM hypothesizes that system use is directly determined by behavioral intention to use, which is, in turn, influenced by user attitude toward the system and per unit of the system. According to TPB, the actual behavior of a person in performing certain actions is directly influenced by his or her behavioral intention and, in turn, jointly determined by attitude, subjective norm, and perceived behavioral control. 35 Due to the necessarily high involvement of customers in co-production of the service, TAM applied in market settings may not sufficiently explain the technology adoption behaviors of consumers. Taking individual differences into account, TRAM, 11 an integration of TR 12 and TAM, was established as a means to explain better the intentions of customers using e-services. However, these studies merely explored the adoption of a particular e-service, and simply discussed adoption from the system design and improvement point of view. Studies 36 that examine the adoption of e-services from a macro view, such as that of the government, have been rare.
Consumer purchasing and the innovation diffusion theory
A consumer purchasing decision is the outcome of a complex, multistage process. 37 The earliest and most well-known process, called attention-interest-desire-action (AIDA), was proposed in the late 1800s and early 1900s38,39 and theorized that sales people have to attract attention (cognition), maintain interest and create desire (affect), and obtain action (conation).40,41 Most research endeavors posited the hierarchical model to include the six hierarchical stages of awareness, knowledge, liking, preference, conviction, and purchase. 42 The process of arriving at a purchasing decision essentially entails that each step be conditional on the positive or favorable hierarchical outcome of the previous one. 43
From the view of customer retention and financial control, another hierarchical model referred to as the customer learning curve (CLC) with five basic stages (need, awareness, access, motivation, and purchase) was proposed in 1936. 44 In the CLC model, marketing managers can determine the penetration or number of customers who make it through all the stages by measuring the percentages of retained customers at each stage and multiplying the percentages. It guides managers in assessing progress. It enables the strategic marketer to select the best marketing program, defined as the one that increases revenue with the most per dollar of marketing expenditures. 45
One of the most often cited models for new technique adoption is the innovation diffusion theory (IDT) 46 proposed by Rogers in 1962. It consists of five stages, starting from having knowledge to being persuaded, to making the decision and implementing it, to the final stage of confirmation. This theory further involves four main interacting factors: innovation, communication channels, social systems, and time. 47
According to the willingness of the customer to adopt new products and the adopting time, the technology adoption life cycle of Rogers categorizes potential adopters into five types based on the adoption rate: innovators, early adopters, early majority, late majority, and laggards, with a bell-shaped distribution of adopters. 48 The adoption success of a new product depends mainly on the innovators and early adopters. 49 Customer initiators (innovators and early adopters) usually affect how a new product is perceived in the market through their level of satisfaction. 50 In general, adoption studies consider the impacts of innovation characteristics, such as the relative advantage, ease of use, risk, and complexity, as well as consumer characteristics, such as demographics and innovativeness.51–53 Recently, a few but limited number of studies have paid attention to the impact of marketing communication efforts on new products or service adoption. 54
Various models of consumer purchasing or new techniques of adoption decision making consist of a sequence of mental stages or levels that consumers experience throughout a purchasing decision.55–61 Previous studies40,43 have summarized the hierarchical stages of the consumer purchasing decision model into three main stages: awareness/cognition, want/interest, and adoption/decision. When evaluating diffusion effectiveness of products or services, the percentages or probabilities of awareness, want, and adoption corresponding to the three main stages of the purchasing decision should be measured.
From a new product or service promotion perspective, awareness of a new service or product does not necessarily translate to choice or usage if it is short of want. Therefore, want for new products or services should also be created typically through promotion and education. In general, the adoption rate rises when awareness and want are both spreading. The adoption rate of a product or service should be highly related to its awareness and want rates. Based on the above discussion, this study has three hypotheses as follows:
That is:
where U(x) represents the adoption of product x or service x; A(x) represents awareness for product x or service x; and W(x) represents want for product x or service x.
That is:
That is:
Then:
where Pr[U(x)] represents the adoption rate of product x or service x; Pr[A(x)] represents the awareness rate for product x or service x; and Pr[W(x)] represents the want rate for product x or service x.
Proposed Analytical Model
AW matrix analysis
This research proposes a model for evaluating the impact of marketing communication efforts on e-services promoted by the government or enterprises. Based on the technology adoption life cycle (bell curve), in combination with innovators and early majority stages, and using the three adoption life-cycle cumulative rates of 15%, 50%, and 85%, 62 awareness and want rates are divided into four levels: popular, high, middle, and low. In the AW matrix, the location of an e-service in this matrix indicates its awareness and want rates. The two-dimensional cross of the AW matrix is divided into 16 categories, shown in Figure 1.
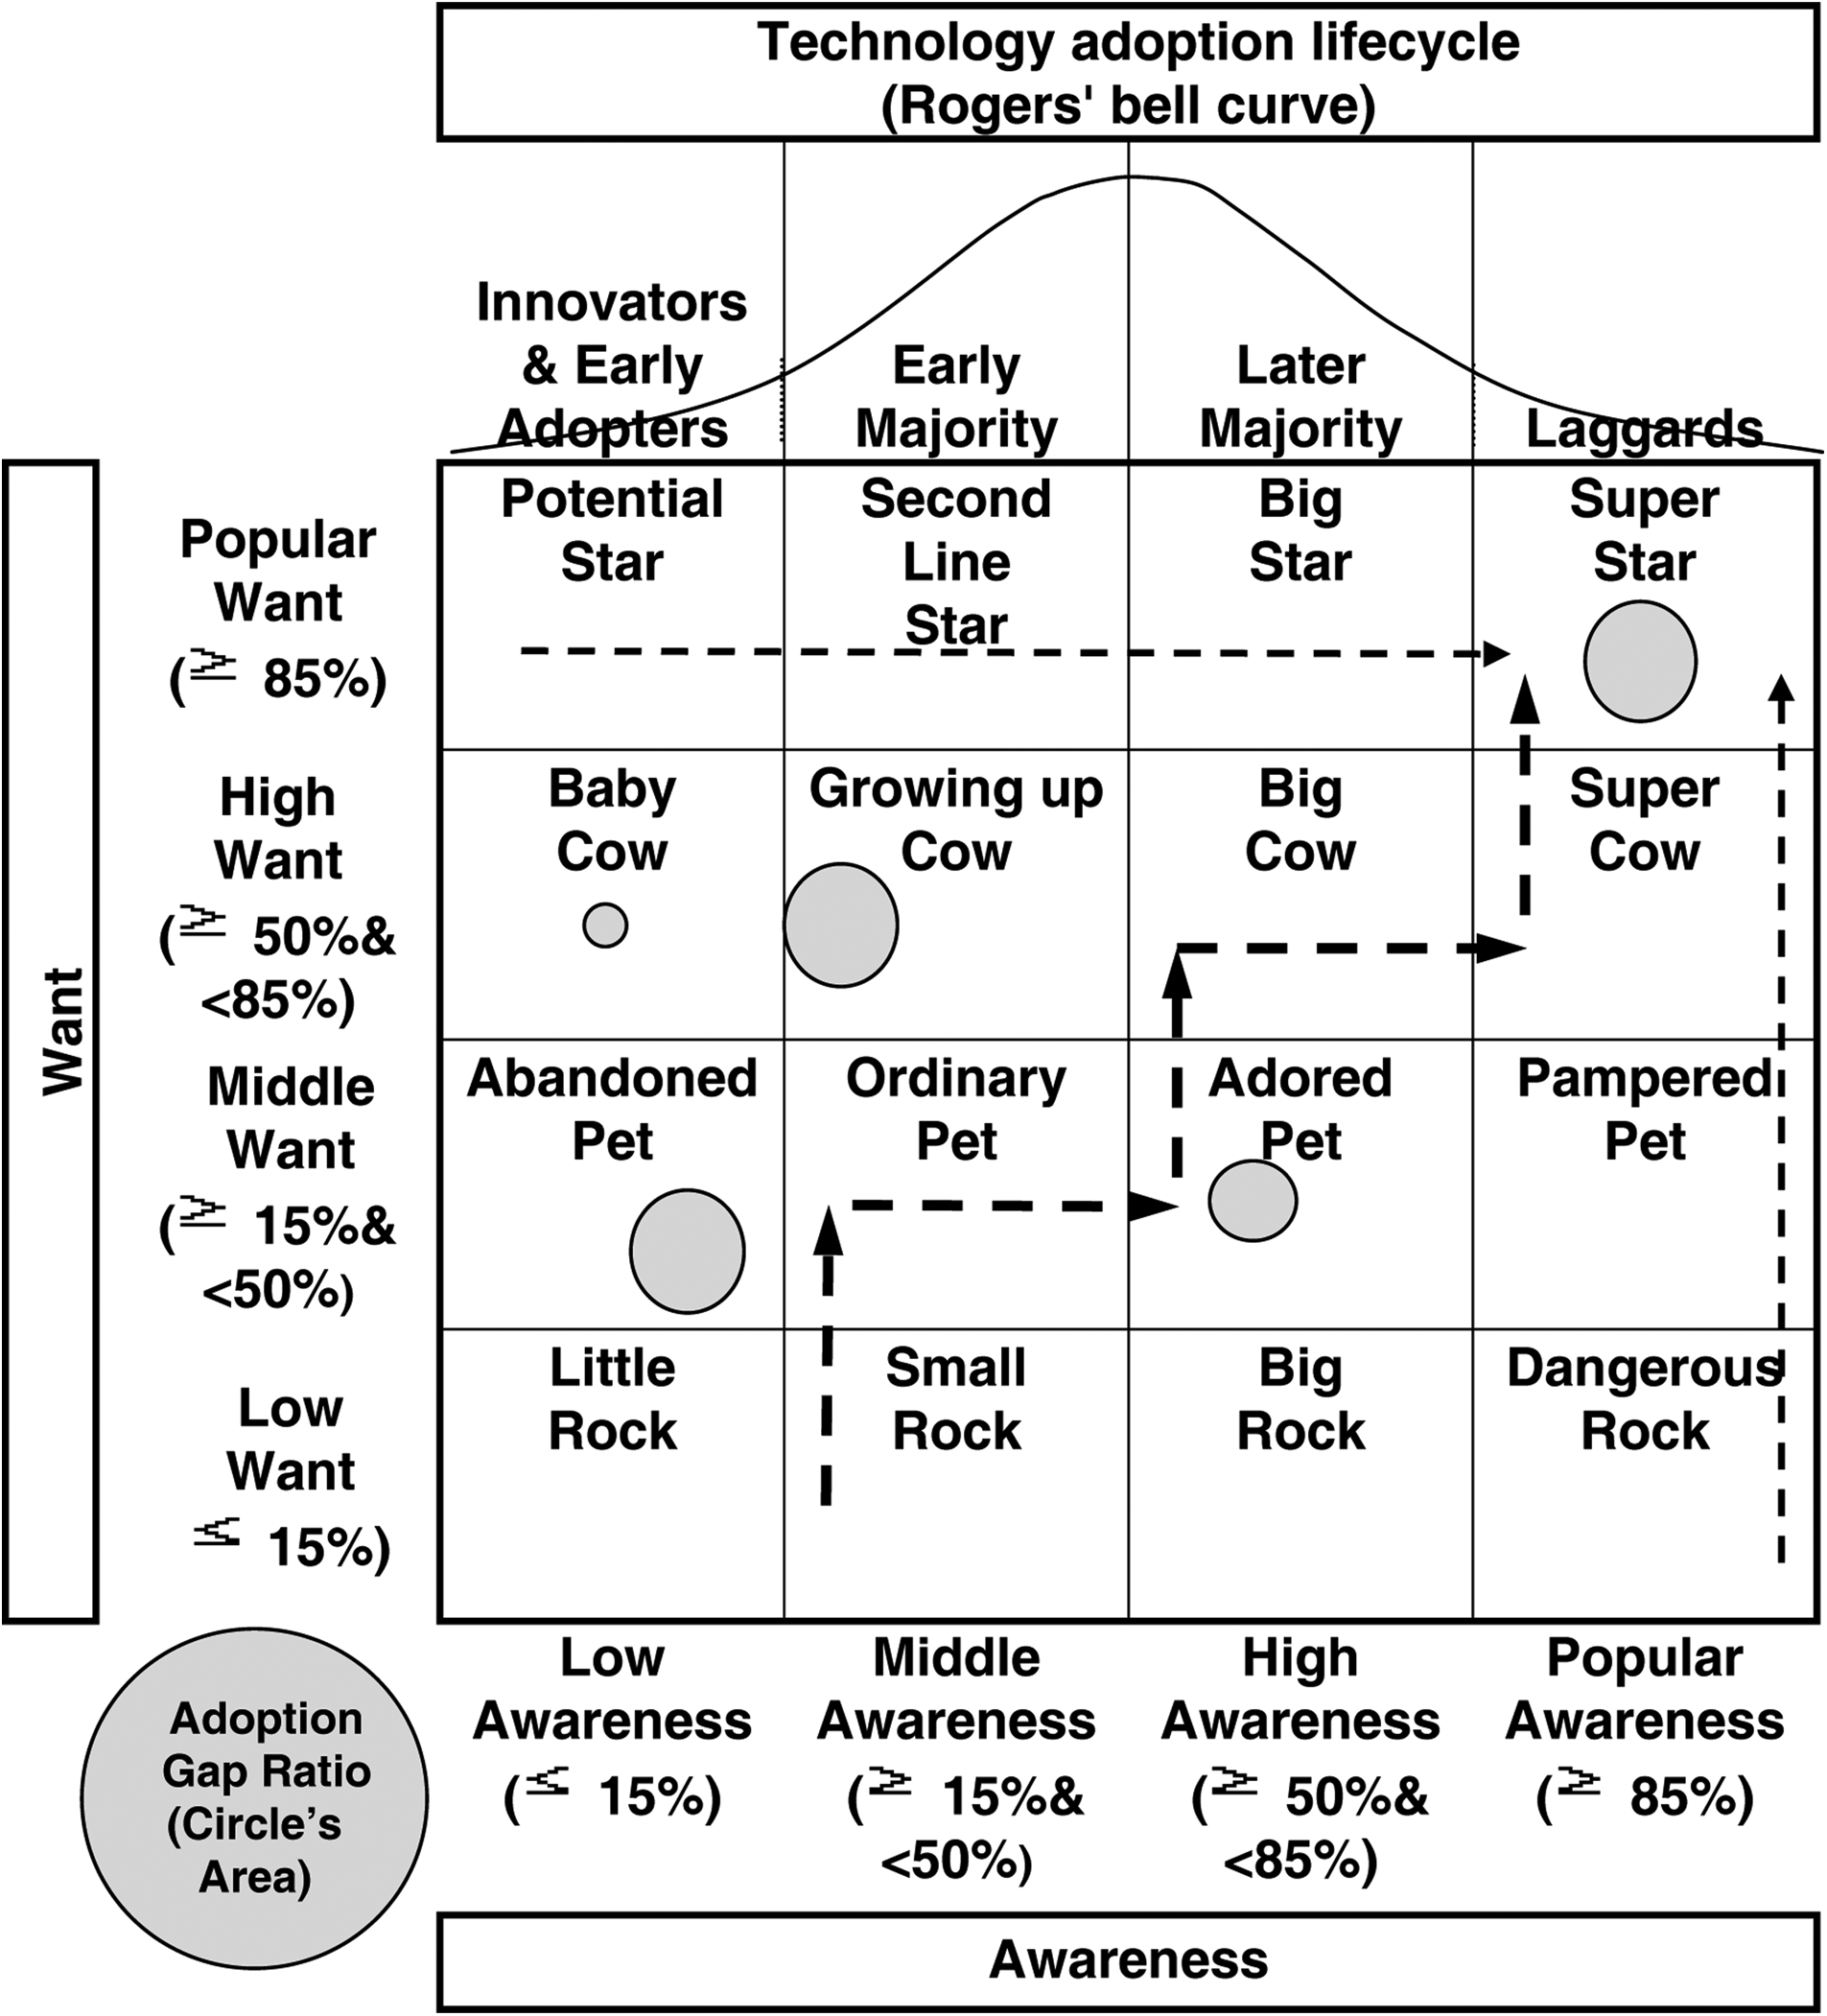
The AW matrix with adoption gap ratio analysis—based from technology adoption life cycle.
The four levels of want in this study are defined as star, cow, pet, and rock by a decreasing order of popularity. The star attracts the most number of customers. The allusion to a cow comes from its lack of star luster and its contribution (i.e., milk) to something essential like nutrition. In short, while the degree of want for this e-service may not be high, it is indispensable. The pet does not have the aforementioned popularity or indispensability, nor is it a necessity for daily life, but it does bring happiness. The rock is interesting to a few people. It is alluded to a precious mineral that requires carving and polishing to transform it into something more valuable. Moreover, by following the rising of the want rate, e-services will move stepwise from rock to star.
Based on the degree of awareness, star, cow, pet, and rock are each further divided into four levels (Figure 1). By following the rise in the awareness rate, e-services will move stepwise from the right to the left. If the want rate of one e-service is low (e.g., rock or pet) and does not increase gradually when the awareness rate keeps rising, this may cause more trouble for the management. In this case, the management should examine the promotion strategy and reallocate its promotion fund.
In the AW matrix, awareness and want are on the same level for the four regions, which are passed by the upward sloping 45-degree line, including super star, big cow, ordinary pet, and little rock. In these four regions, the promotional efforts are optimal, but the promotion performances are different. For example, an e-service in the super star area is similar to a superstar having a huge market and fan base, suggesting that the positioning strategy of e-service is right and the promotion effort is excellent. In contrast, an e-service in the little rock area may have a great need for increased want and awareness, or there might be no need to keep on promoting it.
The e-services located in the lower right, upward-sloping 45-degree line all have an awareness rate greater than the want rate, whereas the opposing e-services in the other way around have opposite results. The greater distance beyond the 45- degree line means that the promotional performance is less optimal, and more efforts are needed for promoting awareness or want. For example, e-services in the upper-most region pertain to the potential star area, which is similar to a new star with good potential and future. The potential star has a big chance of becoming a superstar after the awareness spreads. E-services in the dangerous rock area could be considered a waste of budget. They are well known but are used and wanted only by a few people. Thus, expenses should be trimmed. An overall evaluation of the e-service is also suggested.
This study defines five possible strategies: create (C), spread and raise (S), hold (H), review (R), and divest (D).63,64 The create strategy creates new or additional wants in the original market or develops a new segment market. The spread and raise strategy raises or spreads the awareness or wants in the original market. The hold strategy maintains the good work in the original market. The review strategy reevaluates wants, supervises the promotion strategy, or repositions the target market. The divest strategy divests the e-service by phasing it out or selling it, and then uses the resources elsewhere. Each region and its corresponding strategy suggested are shown in Table 1.
C, create; S, spread and raise; H, hold; R, review; D, divest.
Using the AW matrix, the manager should first reevaluate wants. If the e-service is found to be necessary to the people, then the e-services located in the lower area should be pulled up to the upper area, the left-area e-services should be pulled to the right, and the e-services in the lower-left area should be pulled up to the top-right area, step by step.
Adoption gap ratio analysis in the AW matrix
Based on the proposed hypotheses H1, H2, and H3, adoption promotion should be limited under the current awareness and want. Therefore, this study proposes an adoption gap ratio analysis to explore the gap between adoption and awareness or want. The adoption gap ratio g(x) is defined as follows:
The range of the adoption gap ratio is between 0% and 100%. Among those who are already aware of or in want of a strategic business unit (e-service), the adoption gap ratio represents the percentage of people who have never used it. Using the proposed adoption gap ratio, a researcher can thus evaluate the effectiveness of adoption promotion more accurately.
Empirical Design
This study applies the AWA gap analysis to evaluate the promotion performance of e-services promoted by the Taiwanese government.
Framework for ubiquitous e-services
The framework of e-services has eight pillars and 12 sub-pillars, 65 based on the “U-Taiwan Program” structure and integrated reports and research from Japan, 66 South Korea, 67 the European Union,68,69 the United Kingdom, 70 the United States,15,16 and other countries.71–75
Survey method and questionnaire
A stratified simple random sampling with a sample size allocation, proportioned by the population distribution of 23 cities/counties (strata), was used. According to the population distributions of gender and age, post-stratifications were also conducted during the interview process to control the sample structures of these two variables. All p values of the chi-squared homogeneity tests for cities/counties, gender, and age were all greater than 0.05, indicating that the sample distributions of the three characteristics are as homogeneous as the population distribution.
The respondents were asked to express their opinions using the following two statements on a binary scale (1 = yes and 2 = no): (1) Have you ever heard of this kind of e-service? (detailed items are described in Table 2); and (2) Do you want to use this kind of e-service in your daily life? The usage of the e-services (1 = user and 0 = nonuser) was also investigated to estimate the adoption rate of each service.
Data resource: Liang et al. (2009). 74 (Copyright © 2009 IEEE).
Sample structure
A total of 6,036 Taiwanese respondents aged 15 years and above were interviewed by telephone. The frequency table of the demographic variables is shown in Table 3. The penetration rate of computers at home and Internet access were all high in Taiwan; 84.2% have computers at home and 67.7% have access to the Internet.
Results
Adoption function of awareness and want
The awareness, want, and adoption rates of 12 e-services are shown in Table 4. The hierarchical stages of a customer decision process are correlated. Therefore, this study integrated awareness and want into one variable, AW(x), to deal with the collinear problem. All 12 logistic regressions were significant; that is, the adoption can be expressed as the function of awareness and want. Hypothesis H1 is proven true (Table 5).
p < 0.05.
In AW(x), 0 = neither aware of nor in want of; 1 = aware of but not in want of; 2 = not aware of but in want of; 3 = both aware of and in want of.
Adoption rate is positively related to the awareness rate and want rate
The values of exp(B) for 12 logistic regressions were between 2.72 and 9.63 and were all greater than 1. Thus, a one unit increase of AW(x) will result in a multiple-unit increase of use, and the adoption is positively related to awareness and want. Therefore, hypothesis H2 is also proven.
Adoption rate is bound to the awareness rate and the want rate
Except for “Internet and communication service,” all of the p values of the paired proportion test between adoption and awareness or want rates for the 12 e-services were all less than 0.05 (Table 6). This indicates that the adoption rates are significantly less than either the awareness or want rate. Although the difference between the adoption and want rates for “Internet and communication service” is not significant, the want rate is still larger than the adoption rate. Therefore, hypothesis H3 is also proven.
p < 0.05.
AWA gap analysis
In the AW matrix analysis, the 12 e-services were positioned in the super cow, big cow, and adored pet areas (Fig. 2). The awareness rates of all 12 e-services were all considered high or popular, indicating that the present government efforts in promoting awareness are effective. The values of the adoption gap ratios for 12 e-services range from 1.6% to 77.6% (Table 4). The adoption gap ratio analysis shows that while there is almost no room to promote the adoption of “Internet and communication service,” unless awareness and want are first raised, there is a huge room to promote the adoption of “digital living environment and public security information interactive service.”

The AW matrix with adoption gap ratio analysis for 12 e-services.
Discussion and Conclusion
According to the AWA gap analysis, three e-services, including “digital shopping and entertainment service,” “Internet and communication service and digital government service,” were located in the super cow area. The gap between adoption and awareness or want for “Internet and communication service” is small and not significant, indicating that the adoption rate nestled up against the wants of the people.
Eight of the e-services related to personal and family security, health care, e-transportation, and leisure activity were located in the big cow area with awareness and want rates at the same high level. This indicates that the promotional efforts of the government were optimal. It must be noted that “digital living environment and public security information interactive service” should be ranked first when establishing the order of priority for promotion activities because it had the highest gap ratio at 77.6%.
The “digital learning service” was located in the adored pet area. This service may cause budgetary waste. Hence, shifting the budget to other services should be considered if want rate does not rise. The gap ratio of “digital learning service” was also large at 46.9%, which indicated that the adoption rate also had room to rise.
This study proposed the AWA gap analysis and provided empirical evidence that it is workable. For managers in business, government, or any kind of institution, the AWA gap analysis provides a simple and clear method for exploring and comparing the strategic business units or projects. Moreover, it helps managers reallocate their budget given the limited resources from an objective and customer-oriented view.
Suggestions for Future Research
In future research, the AWA gap analysis could be extended to analyze gaps among different characteristics, such as gender, age groups, and education levels, or among different usage behavior groups and different segmentations. It could also be used to compare and explore digital divides thoroughly among generations.
Footnotes
Disclosure Statement
No competing financial interests exist.