
Abstract
Abstract
Reports about excessive Internet use, possibly amounting to an addiction, have increased. Progress with research and treatment of this phenomenon requires valid standardized assessment instruments. A frequently used questionnaire is the Internet Addiction Test (IAT) by Kimberly Young. The 20-item questionnaire is well established in a number of languages, but a German validation was lacking so far. An online (ON) sample (n=1,041, age 24.2±7.2 years, 46.7 percent men) completed an Internet version of the IAT and a student sample (offline [OF] sample, n=841, age: 23.5±3.0 years, 46.8 percent men) filled in a paper/pencil version. The participants also answered questions regarding their Internet use habits. A further sample of 108 students (21.5±2.0 years, 25.7 percent men) completed the questionnaire twice to determine the 14-day retest reliability. The internal consistencies were α=0.91 (ON) and α=0.89 (OF). Item-whole correlations ranged from r=0.23 to r=0.65 (ON) and from r=0.30 to r=0.64 (OF). Two-week retest reliability was rtt=0.83. Factor analyses with Varimax rotation yielded the same two factors in both samples, which explained 46.7 percent (ON) and 42.0 percent (OF) of the variance. The IAT score correlated with the time spent in the Internet in a typical week (ON: r=0.44; OF: r=0.38). The German version of the IAT was shown to have good psychometric properties and a stable two-factorial structure. Correlations with online time were in line with those reported for the IAT in other languages.
Introduction
At the same time, reports accumulate about persons who experience problems due to excessive use of the Internet. Problems described include low academic/work performance,2–6 loneliness, social and relationship problems,2,4,6,7 as well as psychiatric comorbidity. 8 Estimates of the number of people affected by Internet addiction vary from 1.2 percent9,10 to 15–20 percent,11,12 with a recent systematic review reporting a range of 0–26.3 percent for U.S. students. 13 Until its inclusion in the DSM-V,14,15 research is hampered by a lack of agreed terminology and diagnostic criteria. In their absence, the criteria for Internet addiction are often modeled on those for pathological gambling.16–19 One of the first questionnaires developed on this basis is the Internet Addiction Test (IAT) by Young. 16 The IAT consists of 20 questions, pertaining to problematic behavior regarding Internet use (e.g., staying online longer than intended), which are rated for the frequency of their occurrence on a 5-point Likert scale from 1 (not at all) to 5 (always). The maximum score achievable is 100 points. Mostly, the IAT is used as a dimensional measure; however, Young 16 suggested cut-off scores for average users, users who experience frequent problems, and users with significant problems. Although studies exist that using these cut-offs to distinguish between persons with and without Internet addiction,9,10,20,21 to the authors' knowledge, no validation study so far has investigated these cut-offs.
The IAT is widely used to assess Internet addiction,9,10,20,22 and validation studies for the English,23,24 Chinese, 25 Italian, 26 and French 27 versions exist. These versions were shown to possess good-to-satisfactory psychometric properties, although so far no agreement was reached concerning the factor structure: two different six-factor solutions,23,26 two different three-factor solutions,24,25 and a single-factor solution 27 were proposed.
These studies used different media to administer the IAT: the studies evaluating the original English version23,24 utilized Internet-based questionnaires, whereas the other studies used the traditional paper/pencil medium.25–27 In Internet-related research, researchers frequently might want to use questionnaires in both versions, the traditional paper/pencil format and as an Internet-based format. The International Guidelines on Computer-Based and Internet-Delivered Testing recommend that the equivalence of the traditional and the computer-based forms should be established before they are used for testing. 28 So far, no data are available directly comparing the psychometric properties of an Internet-based and a paper/pencil version of the IAT.
A German translation of the IAT was included in the translation of Young's book Caught in the net, 29 but not validated. The aim of the present study was to investigate the psychometric properties of the German version in an offline (OF) sample (paper/pencil version) and an Internet sample (online version), to ascertain its retest reliability and to explore the factor structure.
Method
Recruitment and participants
Offline sample (study A)
The OF sample, who filled in the paper/pencil version, consisted of 916 students of the University of Göttingen (Germany). They were approached on campus by final-year psychology students and invited to participate in the survey. Of the 916 returned questionnaires, 68 questionnaires were excluded, because German was not the respondents' native language. A further seven questionnaires were excluded, because the participants had left more than 50 percent of the items unanswered. The remaining questionnaires of 841 participants (mean age 23.5±3.0 years) were included in the analyses. Of these, 394 (46.8 percent) were men, and 447 (53.2 percent) were women.
Online sample (study B)
For the online (ON) study, the questionnaire was posted on the Internet in general forums and computer-related message boards. One thousand four hundred twelve participants followed the link and began the questionnaire; 263 of these left the questionnaire without filling in the relevant portions, that is, the IAT and the Generalized Pathological Internet Use Scale (GPIUS-2, 30 see section Instruments), and were excluded from the analyses. Of the remaining 1,149 participants, 59 were excluded, because German was not their native language, and 14 because they were aged 13 years and under. A further 35 had to be excluded, because the participants had made obviously false statements. The questionnaires of 1,041 participants (mean age 24.2±7.2 years) were entered into the analyses. Of these, 486 (46.7 percent) were men, and 555 (53.3 percent) were women.
Retest sample (study C)
For the retest sample (RS), questionnaires were distributed in the lectures of several subjects at the University of Göttingen (Germany). The same lectures were visited two weeks later to collect the retest data. One hundred eight students filled in both questionnaires; three had to be excluded due to too many missing data in the IAT. The final sample consisted of 105 participants (mean age 21.5±2.0 years), of which 27 (25.7 percent) were men, and 77 (73.3 percent) were women.
Instruments
In studies A and B demographic information, as well as self-reports of hours spent online in a typical week, the frequency of Internet use and the duration of individual online sessions were collected. All questions asked specifically about the use of the Internet for private (i.e., nonwork/nonacademic) purposes. In study C, only demographic information was gathered and the IAT administered.
The GPIUS230 consists of 15 items to be rated on a five-point Likert scale ranging from 1 (never) to 5 (always). The items form five subscales, namely Preference for Online Social Interaction (POSI), Mood Regulation (MR), Cognitive Preoccupation (CP), Compulsive Use (CU), and Negative Outcome (NO). This questionnaire was translated by one of the authors (A.B.) and retranslated by a bilingual speaker; the internal consistency of the translated version was good (Chronbach's α=0.86).
Statistical analysis
Item analyses to determine mean item scores and standard deviations and item-total correlations were carried out for the OF and the ON samples independently. Mean inter-item correlations, internal consistency (standardized Chronbach's α), and split-half reliability (odd vs. even items) were computed. Missing data were excluded on a case-wise basis.
For the retest-reliability (study C), the IAT-scores at t1 were correlated with those at t2.
To investigate the factor structure, exploratory factor analyses were carried out independently for the OF sample and the ON sample. The suitability of the data for factor analysis was tested with the Kaiser-Meyer-Olkin (KMO) measure of sampling adequacy and Bartlett's test of sphericity. The factors were extracted by means of principal component analyses, and rotated by Varimax. The number of factors to be extracted was determined through Horn's parallel analysis.31,32 Confirmatory factor analyses were conducted to test the fit of our factor structure and the one and three-factor solutions proposed in the literature.24,25,27 As measures for the goodness of fit, the χ2 test, the root mean square error of approximation, the root mean squared residual, the comparative fit index, and the corrected Akaike information criterion are reported.
Correlations between the IAT-score and age, sex, online-time in a typical week, duration of online sessions, the GPIUS2, and its subscales were computed. The correlations between sex and IAT-score are point-biserial correlations. All other reported correlations are based on Pearson's product moment coefficient.
To investigate the cut-off points suggested by Young, 16 the participants of the ON sample were subdivided according to the IAT group (Group I: IAT-score≤39, Group II: IAT-score between 40 and 69, and Group III: IAT-score>69). For each group, the means of the online time in a typical week and the duration on individual online sessions as well as of the GPIUS2 and its subscales were calculated and compared by means of one-way analyses of variances (ANOVAS). Post-hoc tests were based on the Tukey–Kramer test for unequal samples.
Results
Internet use
The majority of the participants used the Internet daily (86.55 percent ON and 71.94 percent OF) or five to six times per week (9.32 percent ON and 18.07 percent OF). In a typical week, the participants of the OF sample spent 11.2±9.9 hours online, the participants of the ON sample 21.0±17.8 hours; the duration of individual sessions was 2.8±2.6 hours (ON) and 1.2±1.4 (OF). The differences between the groups were highly significant (see Table 1 for a full characterization of the Internet use for the OF and ON samples).
p<0.001.
Item analyses
Separate item analyses were carried out for the ON and OF samples. The item-whole correlations varied in the OF sample from ritc=0.30 (item 7) to ritc=0. 64 (item 2) and in the ON sample from ritc=0.23 (item 7) to ritc=0.65 (item 15) (for details, see Table 2). The mean interitem correlations were ritc=0.30 (OF) and ritc=.33 (ON). In both samples, the item with the most missing data (20 of 841 [2.4 percent] in the OF sample and 28 of 1,041 [2.7 percent] in the ON sample) was item 3 (Do you prefer excitement of the Internet to intimacy with your partner?). We also compared the item means of the OF and ON samples by means of independent t tests. All items, except item 6, 7, and 8, showed significantly higher means in the ON sample than in the OF sample with effect sizes ranging from d=0.16 (item 17) to d=0.59 (item 4). For the means and standard deviations of the items in the ON and OF samples, as well as the Bonferroni-corrected results, of the item-wise comparison, see Table 3.
Items are ordered according to factor loadings for the offline sample. The higher of the two-factor loadings are printed in bold.
The Bonferroni-corrected threshold was p<0.0025. All t-values marked with three asterisks were significant after the Bonferroni correction.
p<0.05, **p<0.01, and ***p<0.001.
Reliability
The internal consistencies and the split half-reliabilities calculated according to the odd-even method ranged from α=0.88 to 0.91. We also investigated whether the internal consistency would increase if any item was removed. This was not the case (see Table 2 for the internal consistencies calculated without each item). The 14-day retest reliability was rtt=0.83. For the detailed results for all samples, see Table 4.
IAT, Internet addiction test.
Validity
Factor structure
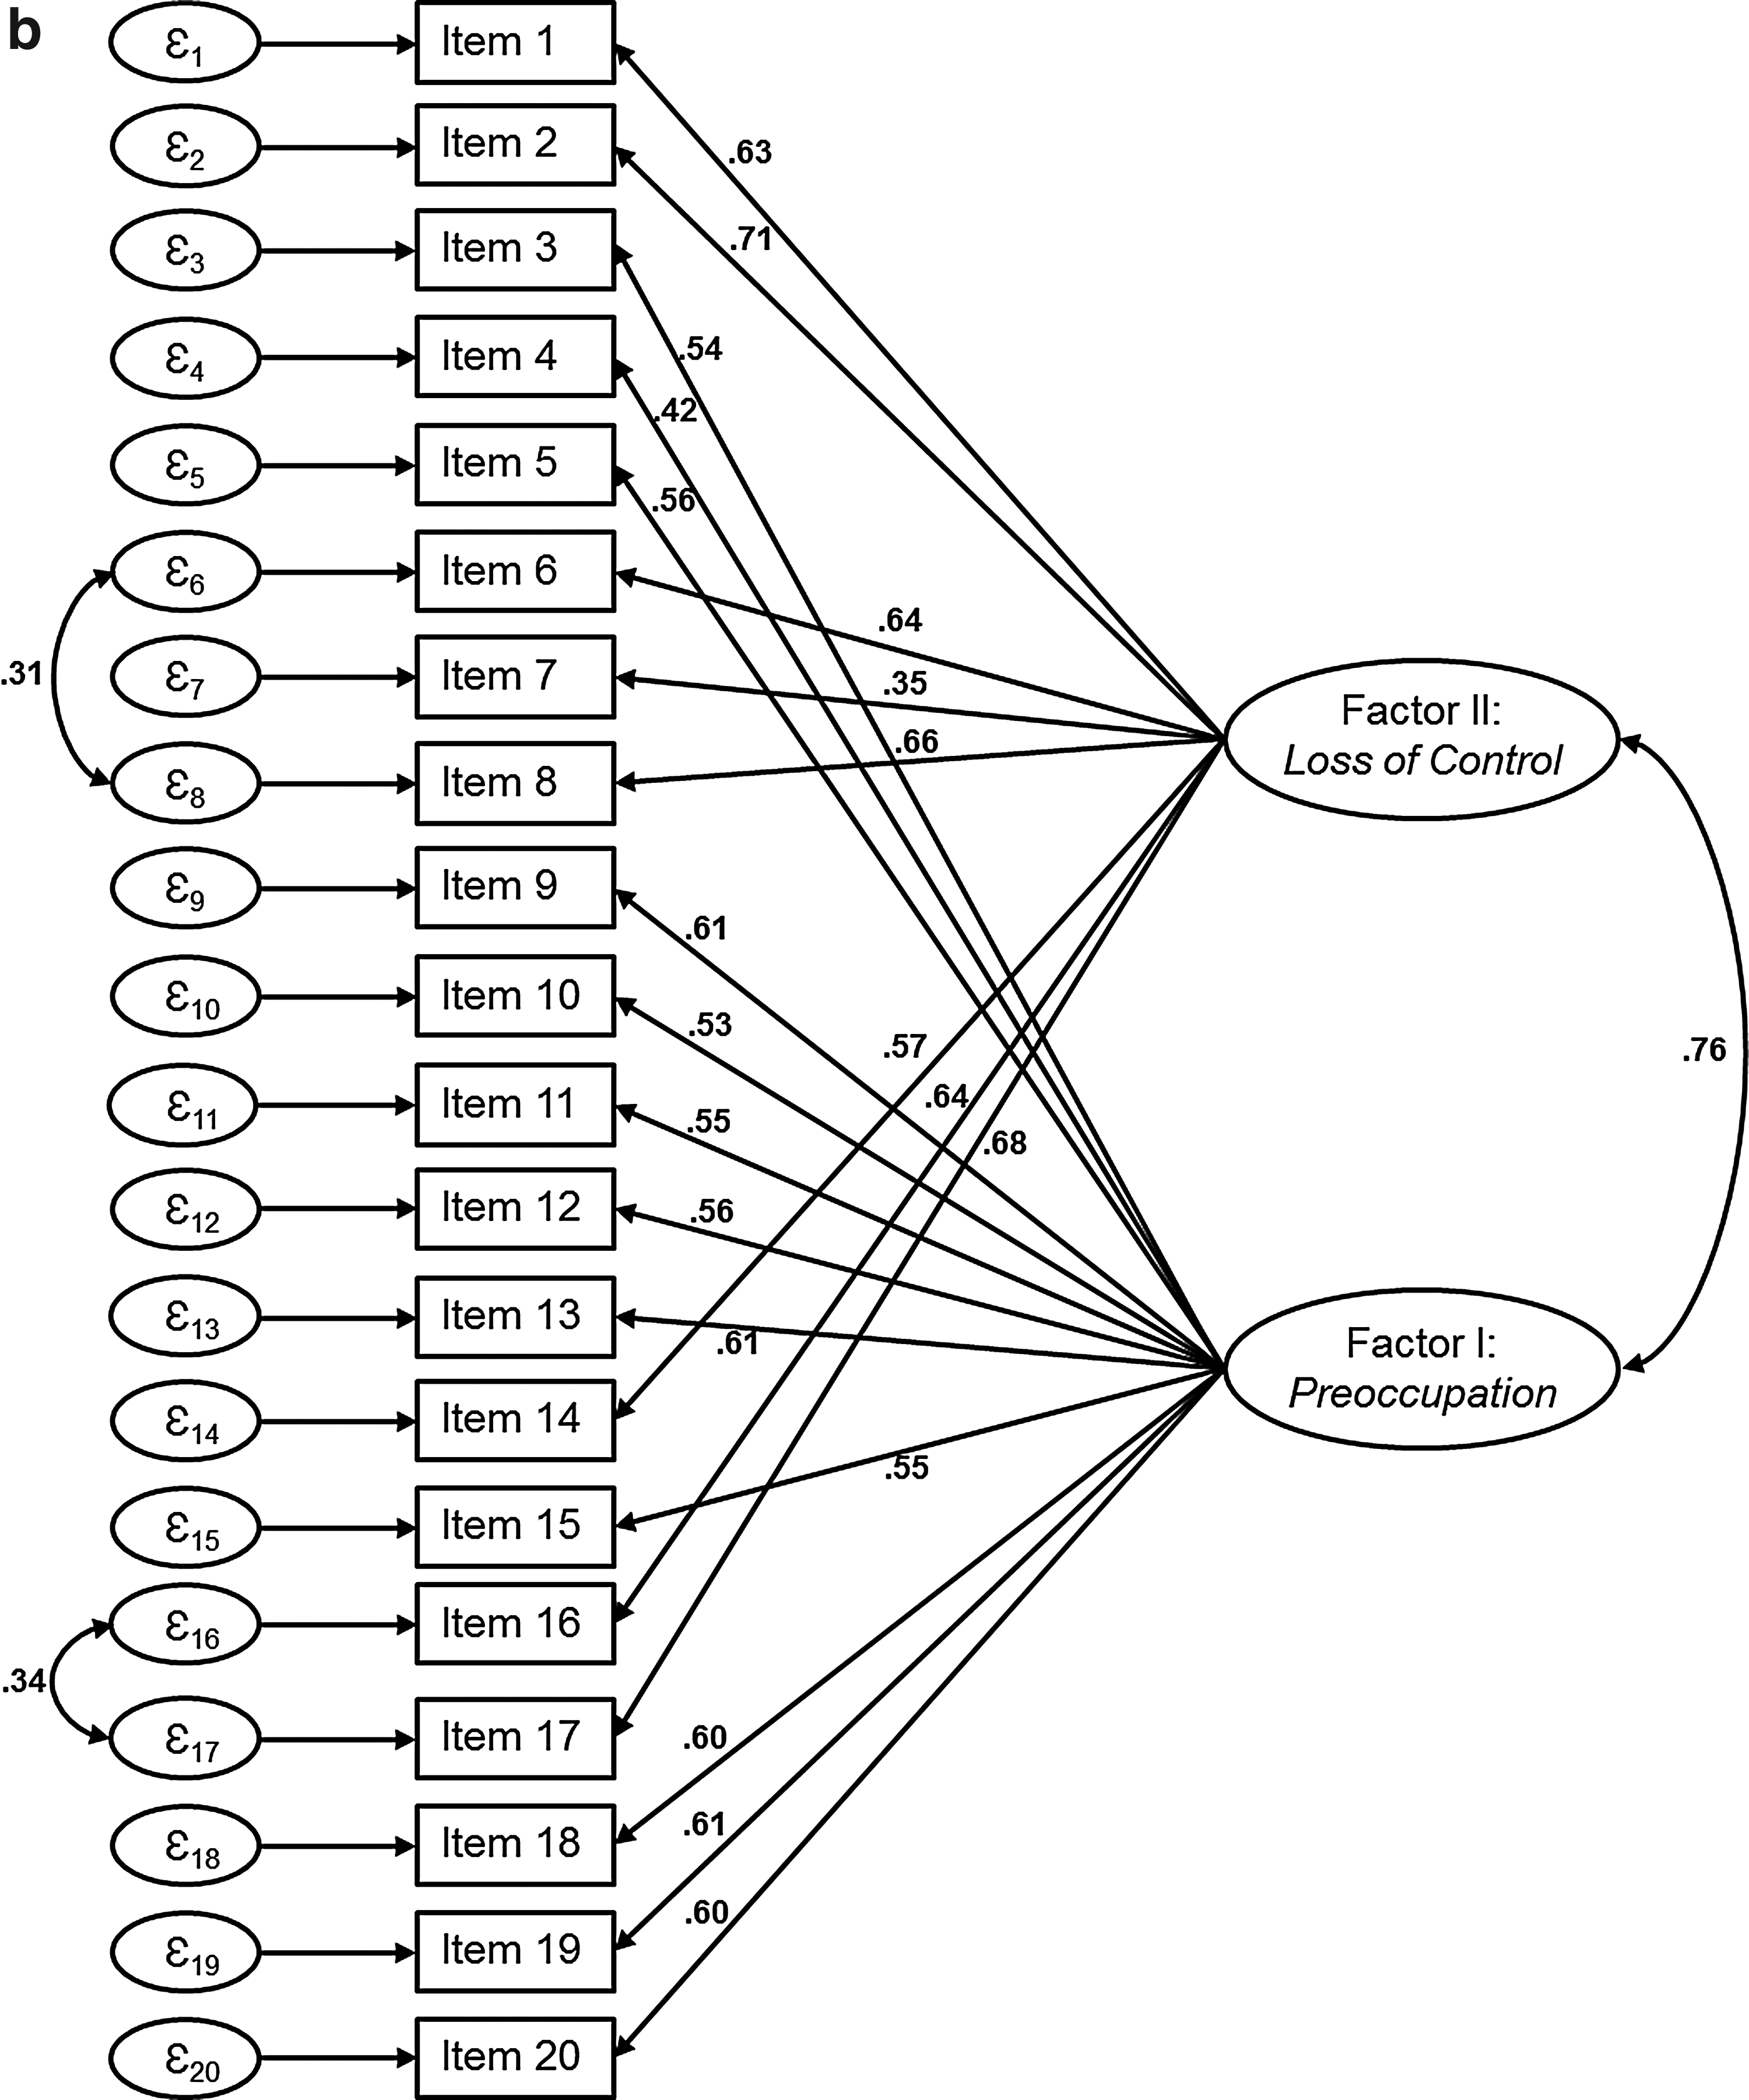
Exploratory factor analyses were carried out for the ON and OF sample separately. According to the Kaiser-Meyer-Olkin criterion, sampling adequacy was excellent in both samples with KMO=0.916 (OF) and KMO=0.937 (ON). Bartlett's test for sphericity showed that the correlation matrices were suitable for factor analyses (OF: χ2=5,270.58, df=190, p<0.0001; ON: χ2=7275.79, df=190, p<0.0001). For both samples, Horn's parallel analysis yielded two-factor solutions. After Varimax rotation, the factors loaded on the same items in both samples. Factor I loaded on the items 3–5, 9–13, 15, and 18–20 and explained 21.0 percent (OF) and 26.7 percent (ON) of the variance; the internal consistency of the factor was α=0.85 (OF) and α=0.89 (ON). This factor might be characterized as Emotional and Cognitive Preoccupation with the Internet. Factor II loaded on the remaining items and explained 21.0 percent (OF) and 20 percent (ON) of the variance. The internal consistency of the factor was α=0.83 (ON) and α=0.84 (OF). Factor II might be called Loss of Control and Interference with Daily Life. The total variance explained by the factors was 42.0 percent (OF) and 46.7 percent (ON). See Table 2 for the factor loadings. Confirmatory factor analyses comparing the one-factor structure proposed by Khazaal et al., 27 the two different three-factor solutions suggested by Widyanto et al., 24 and Chang and Man Law 25 with our two-factor solution showed that the two-factor solution achieved the best fit in both samples (for diagrams of the two-factor solutions with path coefficients, see Fig. 1a, b, and for details of the comparisons, see Table 5).

Path diagrams for the confirmatory factor analysis showing the factor structure and the standardized path coefficients for the online sample
Comparison of our two-factor solution with the factor structures suggested in the literature. Indices are listed for each sample from best fit to least fit.
RMSEA, Root Mean Square Error of Approximation; RMR, Root Mean Squared Residual; CFI, Comparative Fit Index; CAIC, Corrected Akaike Information Criterion.
Convergent validity
In both samples, the IAT-score correlated highly with the GPIUS2 score (OF: r=0.78; ON: r=0.82). Regarding the GPIUS2 subscales, the highest correlations were found for the subscale compulsive use (OF: r=0.66; ON: r=0.75), and the lowest correlations for POSI (OF: r=0.46; ON: r=0.54). For the details of all correlations, see Table 6.
Due to the large sample size, all correlations r>0.06 are significant. According to Cohen, 35 r=0.30 should be classed as a medium effect, and r=0.50 as a large effect.
Point-biserial correlation.
GPIUS2, Generalized Pathological Internet Use Scale.
Correlation with Internet use parameters
The time spent online in a typical week correlated with the IAT-score with r=0.44 (ON) and r=0.38 (OF). We also found correlations with the duration of individual online sessions of r=0.35 (ON) and r=0.34 (OF). For all correlations with indicators of the Internet use, see Table 6.
Correlation with sex and age
The IAT-score correlated weakly with sex (r=−0.16 OF; r=0.10 ON) and with age (r=−0.07 OF). See Table 6 for the details.
Cut-off scores
To investigate the cut-off scores proposed by Young, we compared the number of online hours in a typical week, in the last week, and the duration of the individual online sessions, as well as the scores of the GPIUS2 test and its subscales across the three groups in the ON sample. Of the 1,041 participants, 600 participants achieved scores≤39 (57.6 percent), 420 between 40 and 69 (40.3 percent), and 21 participants (2.0 percent) scored≥70 points. One-way ANOVAS showed highly significant differences for all variables (all ps<0.0001) and all post-hoc tests (all ps<0.0001). The participants classed by the IAT as suffering from Internet addiction spent more time on the Internet per week, and their individual online sessions lasted longer than those of the other participants. The analyses of the GPIUS2 subscales revealed that they used the Internet more frequently for the purpose of mood regulation, experienced stronger cognitive preoccupation with the Internet, and a strong compulsion to be online. They reported more negative outcomes, that is, neglecting other important activities, such as professional and family commitments than the other groups. For a summary of the results, see Table 7 and Figure 2.
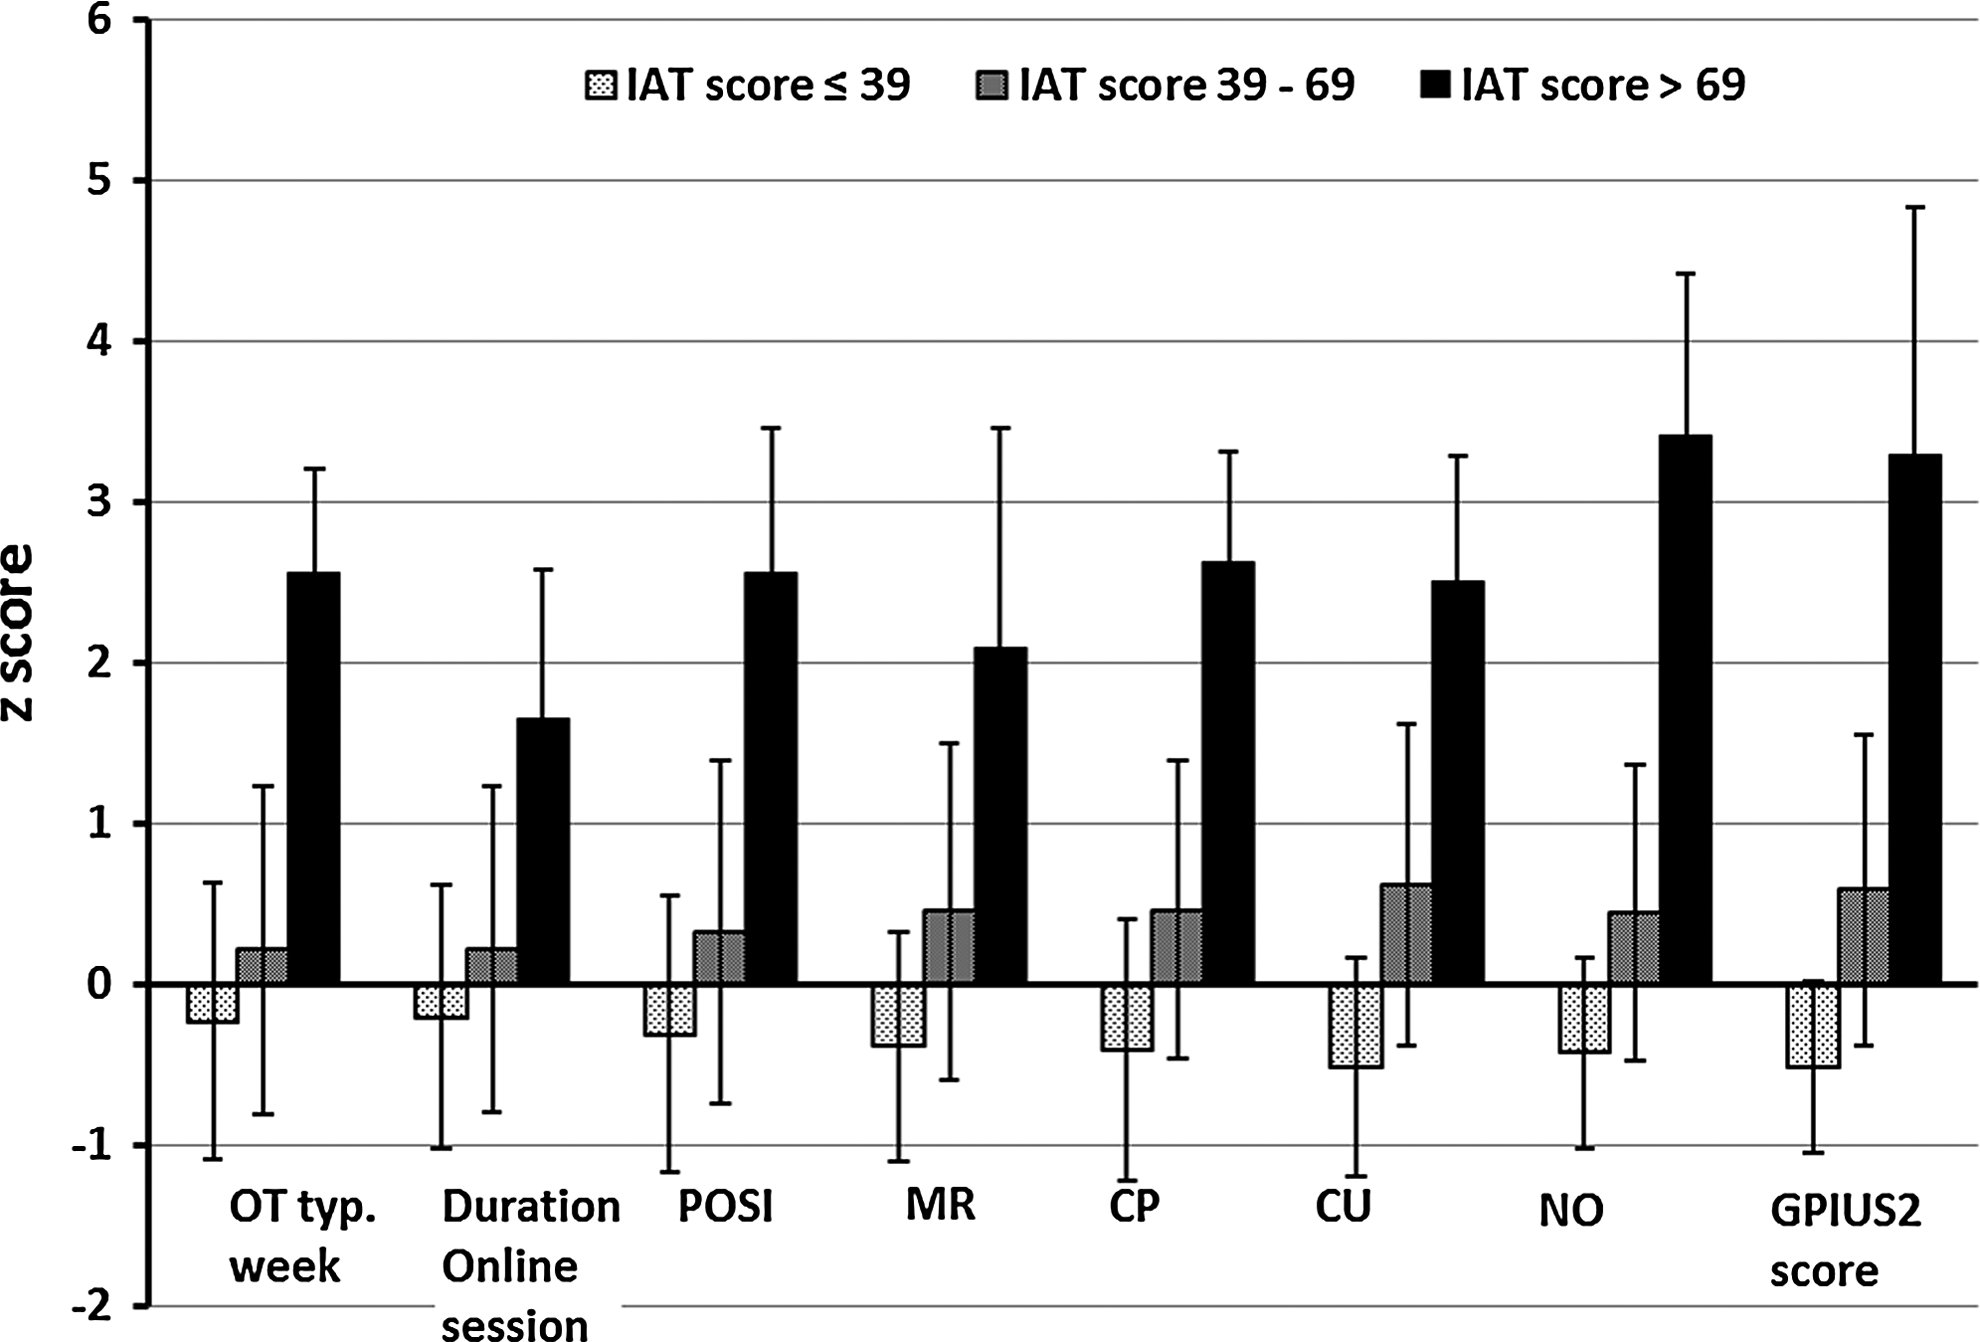
Comparison of the Internet use habits and GPIUS2 scores across the groups normal users (IAT-score≤39), users with some problems with Internet use (IAT-scores between 40 and 69), and Internet addicted users (IAT-scores>69) as defined by Young. To facilitate the comparison, z-scores are shown. IAT, Internet addiction test; GPIUS2, Generalized Pathological Internet Use Scale; OT, online time; POSI, preference for online social interaction; MR, mood regulation; CP, cognitive preoccupation; CU, compulsive use, NO, negative outcome.
Normal Users (IAT≤39), users with some problems with Internet use (IAT 40–69) and users with Internet addiction (IAT>69).
The Bonferroni-corrected threshold was p<0.0056. All t-values marked with three asterisks were significant after the Bonferroni correction. For all variables, Tukey–Kramer post hoc tests for unequal samples showed significant differences (all ps<0.001) between all groups.
p<0.001.
POSI, Preference for Online Social Interaction (as opposed to face-to-face interactions).
Discussion
We investigated the reliability and validity of the German version of the IAT in an ON and OF sample and conducted a two-week retest in a further sample. The German version of the IAT was demonstrated to have good psychometric properties.
The IAT possessed good reliability—the split-half reliability was high in all samples, and the internal consistency was high and would not have benefitted from removing any item from the questionnaire. The two-week retest-reliability was satisfactory; to the best of our knowledge, retest-reliabilities have not yet been published for the IAT in any language.
Item 7 was the item with the lowest item-whole correlation, probably because this item refers to a common behavior, which does not discriminate between persons with Internet-related problems and other users. With the exception of item 7, the majority of the item-whole correlations were high (ritc>0.50), the remainder medium (ritc=0.30–0.50). It would be instructive to compare this with the item-whole correlations for the English, French, and Italian versions. Unfortunately, none were reported in the respective studies. It should be noted that the formulation of item 3 (Do you prefer the excitement of the Internet to intimacy with your partner?) might have presented a problem to users—it was more often left out than the other items, perhaps because people who did not have a partner did not know how to answer it.
We found a stable two-factor solution for the German version in both our samples with the factors Emotional and Cognitive Preoccupation with the Internet and Loss of Control and Interference with Daily Life. Exactly the same items loaded on the factors in both samples and explained 46.7 percent and 42 percent of the variance, respectively. The first factor encompasses items relating to the emotional and cognitive importance of being online, such as feeling depressed, nervous, empty, or aggressive (e.g., items 10, 11, 12, 13, 15, and 20) when the person cannot be online, and items concerned with social aspects of the time spent online, such as preferring online activities to social interactions with others (e.g., items 3, 4, 5, 9, 18, and 19). The second factor contains items concerned with (unsuccessful) attempts at curbing online time (e.g., items 1, 16, and 17) and detrimental consequences of the Internet use for daily functioning (e.g., items 2, 6, 8, and 14). In the literature, wide disagreement as to the factor structure prevails. For the English version, a six-factor solution 23 (n=86) and a three-factor solution 24 (n=225) were suggested. The three-factor solution differs from the other three-factor solution of the bilingual (Chinese/English) version 25 (n=410). The six-factor solution also differs from the other published six-factor solution of the Italian version (n=236).22,26 Khazaal et al. 27 conducted a confirmatory factor analysis and arrived at a single factor for the French version, which he calculated had a superior fit to the six-factor version. Comparing our two-factor model with the factor structures found in other countries, the greatest agreement was found between Chang and Man Law's. 25 Only four items (7, 10, 12, and 14) were grouped into a different third factor compared to our solution. This was also borne out by the confirmatory factor analyses we conducted. In both, the ON and OF samples, the two-factor solution proved itself superior to the one-factor solution 27 and the two three-factor solutions.24,25
The IAT correlated highly (r=0.78, r=0.82) with the scores of the GPIUS2, a further instrument measuring pathological Internet use, thereby indicating good convergent validity.
Regarding external criteria, the IAT-scores showed medium correlations (ON sample r=0.44; OF sample r=0.38) with the time spent online for private purposes in a typical week. These correlations were within the range reported in the literature. Widyanto and McMurran 23 found a correlation of r=0.30, Widyanto et al. 24 of r=0.20, and Khazaal et al. 27 of r=0.53. In addition to the absolute time spent online, the IAT-scores also moderately correlated with the length of the individual sessions.
The ON sample spent more time online in a typical week (d=0.68), and their individual online sessions lasted longer (d=0.72) than those of the OF sample. According to Cohen, 33 this should be classed as a medium effect. The ON sample also scored higher with regard to the individual items of the IAT with small-to-medium-effect sizes (except item 7, for which no difference was found). Such a difference between an ON and OF sample was observed before. 34 It could be due to a higher readiness to disclose a potentially embarrassing behavior in an Internet medium, which may be perceived as more anonymous; a phenomenon known from other contexts. 35 The observed difference might also be due to a sampling effect, since if people are recruited via the Internet, those who spend the most time in the Internet are most likely to come across the questionnaire. However, despite this, the psychometric properties were the same in both samples. This is in accord with the findings of Riva and coworkers, when comparing an online and offline version of an Internet-attitude questionnaire. 34
Applying Young's cut-off scores resulted in 21 persons in the ON sample (2 percent) classed as Internet addicted. With more than 65 hours per week, these participants spent much more time online for private purposes than the other users (as a comparison: an average working week in Germany is ∼40 hours). Their individual sessions lasted on average nearly a working day, indicating that they possibly had difficulties to disengage from the Internet once they were online. For a full evaluation of the cut-offs, independent diagnostic criteria, as may perhaps be forthcoming with the DSM-V, would be required to conduct ROC analyses. However, in the meantime, the elevated scores in all categories, including negative outcome, point to a small subgroup whose Internet use differs markedly from that of the general population and who experience a strong negative impact of their online activities.
This study is not without limitations. First, the RS was recruited in addition to the online and the OF sample and contains more women than men. Secondly, it would have been desirable to test the questionnaire in a group of persons independently diagnosed as Internet addicted.
To sum up, the German version of the IAT showed good psychometric properties in an online and an offline version and had a stable two-factor structure across both samples.
Footnotes
Acknowledgments
We are grateful to Scott E. Caplan who kindly made the GPIUS2 available to us ahead of publication and to Bettina Adamietz, Sarah Alhabbo, Anna Gast, Christine Hofheinz, Tatiana Katzeishvili, and Katharina Kube, who collected the data for the offline sample, Katharina Müller, who collected the data for the online sample, and Inga Meyhöfer and Lars Reichler, who collected the data for the retest sample.
Author Disclosure Statement
No competing financial interests exist.