
Abstract
Abstract
Even though video game players frequently report losing track of time while playing, few studies have addressed whether there are long-lasting effects of such activity on time perception. We compared the performance of chronic and occasional video game players in sub- and multi-second time perception tasks. Temporal Discrimination and Temporal Bisection tasks, in the range of 100 to 1,000 milliseconds, and Time estimation and Time production tasks, in the range of 5 to 60 seconds, were used to assess sub- and multi-second time perceptions, respectively. Chronic video game players performed significantly better than occasional players on sub-second tasks, but no group difference was found for the multi-second tasks used. Sub- and multi-second time perceptions are associated to different underlying systems: automatic and cognitive controlled for sub- and multi-second tasks, respectively. We argue that video game use seems to induce more efficient implicit, rather than cognitive controlled, processing of time.
Introduction
Few studies have addressed the effect of video game usage on time perception and most of them have done so by means of an estimation task in which participants should estimate how long they have been playing a game for. Gamers tended to underestimate time while playing for the following intervals: 15 seconds 4 ; 60 minutes 5 ; 8 and 24 minutes 6 ; and 13, 37, and 45 minutes. 7 Some studies have found the opposite result, with gamers overestimating intervals of 60 and 300 seconds, 4 and 30 minutes. 5
Even fewer studies have investigated time distortions among video game players in more traditional time perception tasks, which consider situations when gamers are not playing. Within the multi-second range, inconsistent results were found for a time production task, 8 with gamers overproducing a 10-second interval, but under producing a 60-second interval. In the sub-seconds range, video game players show more precise multisensory temporal processing abilities, which was accessed by their ability to distinguish whether simple visual and auditory stimuli occurred at the same moment or slightly offset in time. 9
Our aim in this study was to investigate whether time perception of video game players is altered for sub- and multi-second ranges. We compared the performance of a group of chronic video game players, who reported playing more than 30 hours per week, with occasional players (OP), who played less than 5 hours per week, in commonly used time perception tasks.
Methods
Participants
The sample comprised eighteen male adolescents, divided equally between two groups. The chronic players group (CP) was formed by individuals who reported playing video games for more than 30 hours per week within the last month (33+3.16 hours) and the OP group who reported playing for 5 hours or less per week (2.6+1.62 hours).
Groups were similar in age (CP 16.13+0.35 years and OP 16.30+0.48 years) and years of education (9.88+0.64 years for CP and 10.4+1.3 for OP).
Apparatus
An Intel Core 2 duo laptop and the e-prime® software (Psychology Software Tools,
Time Perception Tasks: Sub-Seconds Range
Temporal discrimination task
Participants had to judge if the presentation of two visual stimuli were of equal or different duration. Stimuli were black squares presented consecutively in a gray background. A Test Duration (TD), ranging from 100 to 1,000 milliseconds, in increments of 50 milliseconds, was compared to a Reference Duration (RD) of 500 milliseconds.
Each trial was preceded by a 1,000 milliseconds screen containing a fixation point in its center. Both TD and RD were randomly presented either at the left or at the right side of the fixation point (never at the same side within each trial). The squares were presented consecutively and there was a 500 milliseconds interstimus interval screen containing only the fixation point. Participants were instructed to press the S key on the keyboard if they perceived the pair of squares as of equal durations or the N key, if they perceived them as of different duration.
The task comprised four blocks containing 46 trials each; from which 10 trials were composed of a TD with duration of 500 milliseconds, which would require a positive response; and in the other 36 trials, TD varied from 100 to 1,000 milliseconds with increments of 50 milliseconds (except for the 500 milliseconds interval). The order of presentation of each block and of each trial within the blocks was random.
Temporal bisection task
Participants were trained to identify two standard durations, short (200 milliseconds) and long (800 milliseconds). The stimuli used to present the durations were dark gray squares presented in the center of a light gray background.
During the training phase, participants were exposed to the standard stimulus durations until they could consistently identify each of them as short or long. In the test phase, participants were shown durations other than the standard ones, and were asked to judge whether they were more similar to the short- or to the long-standard duration. They should press the X key of the keyboard for durations similar to the short-standard and the N key, for the ones more similar to the long-standard duration.
In the test phase, the dark gray square was randomly presented nine times in each of the following durations 200, 300, 400, 500, 600, 700, and 800 milliseconds. The task comprised one block with 63 trials in total.
Time Perception Tasks: Multi-Second Range
In the time estimation task, participants had to verbally estimate intervals in seconds. Three intervals—10, 30, and 60 seconds—were randomly presented, three times each, comprising nine trials.
In the time production task, participants had to produce intervals of 5 and 45 seconds by pressing the spacebar on the keyboard to start the interval and again to end it. There were three repetitions for each interval duration.
Intervals for both tasks were filled by a reading aloud digit task. Digits were presented in the middle of the screen in random presentation rates (1, 2, or 4 seconds), which made it hard for participants to use it as a track of the passing time. To assure subjects had understood the instructions, there was a training phase for both tasks using two different intervals.
Procedure
All participants signed an informed consent form before starting the experiment. The testing session lasted approximately 45 minutes and participants were tested individually in a quiet room. The time perception battery followed a fixed order (temporal discrimination task, temporal bisection task, temporal estimation task, and temporal production task) and for all tasks, the seat was adjusted so that participants were approximately 57 cm from the computer monitor.
Data Analysis
Temporal discrimination task
Initially, the percentage of correct answers for each TD: from 100 to 1,000 milliseconds in increments of 50 milliseconds was computed for each individual subject (Fig. 1). Two ranges of points were, then, used to find the best fitting line, corresponding to TD smaller (100 through 400 milliseconds) and longer (700 through 1,000 milliseconds) than the RD. The line fit was made in Matlab (Mathworks) using the least-square method.
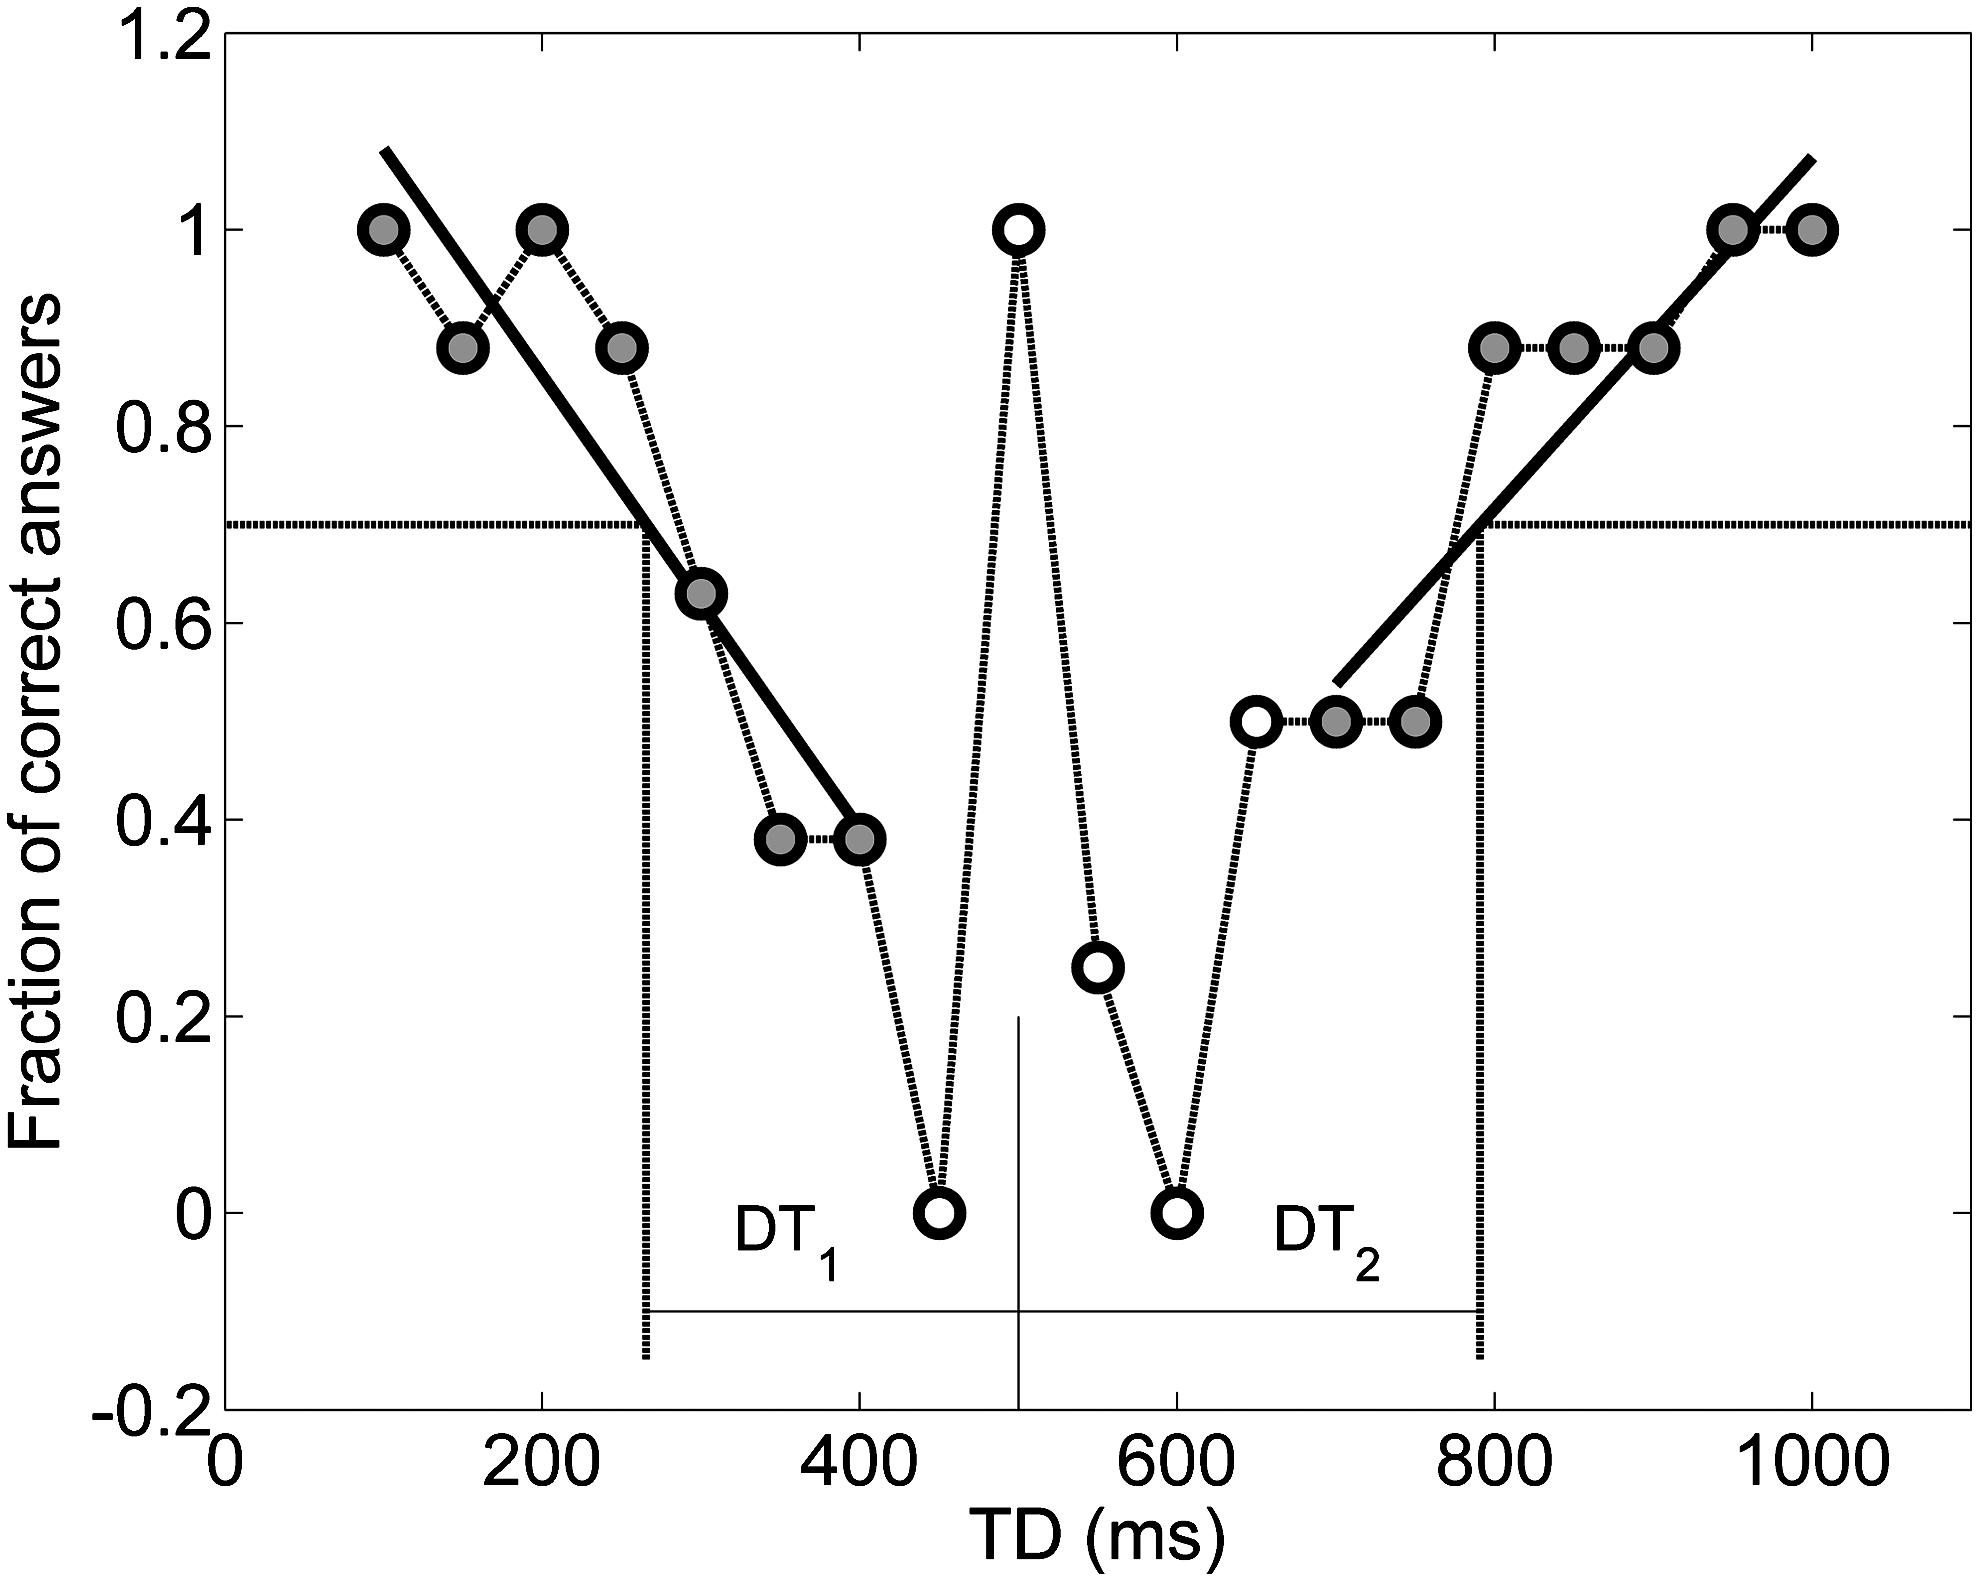
Percent of correct answers in the temporal discrimination task for one subject. The figure shows how the individual analysis was performed. The gray-faced data points were used for fitting the thick continuous lines, one at each side of the Reference Duration (RD) (500 milliseconds). The distances between the points, where the fitted lines crossed the 0.7 level and the RD defined the discrimination thresholds DT1 (on the left) and DT2 (on the right).
The two points where the fitted line crossed the value of 0.7 were computed as the discrimination thresholds (DT), which can be interpreted as the duration difference in which the subject can correctly discriminate TD from RD on 70% of the trials. The two thresholds, DT1 (for shorter intervals) and DT2 (for longer intervals), were computed for each participant and their means were compared with an analysis of variance in the Statistics package (Stat Soft, Inc.).
Temporal bisection task
Data from the probability of responding that the interval was more similar to the long-standard duration (P) were fit to a sigmoid function
Multi-second time perception task
Results for the time estimation and time production tasks were expressed in terms of rates; registered intervals divided by the real interval. Two-tailed independent-samples t-tests were used to compare group's performances on both tasks.
Results
Temporal discrimination task
The fraction of correct answers was plotted as a function of TD for each group (Fig. 2). As expected for both groups, when TD is exactly the same as RD (500 milliseconds) the fraction of correct answers is high (∼0.9). The same thing happened when TD was very different from RD (lowest and highest values of TD). It is noticeable from Figure 2 that the CP group data points were above the OP group for almost all TD's, suggesting a better performance of the former group.
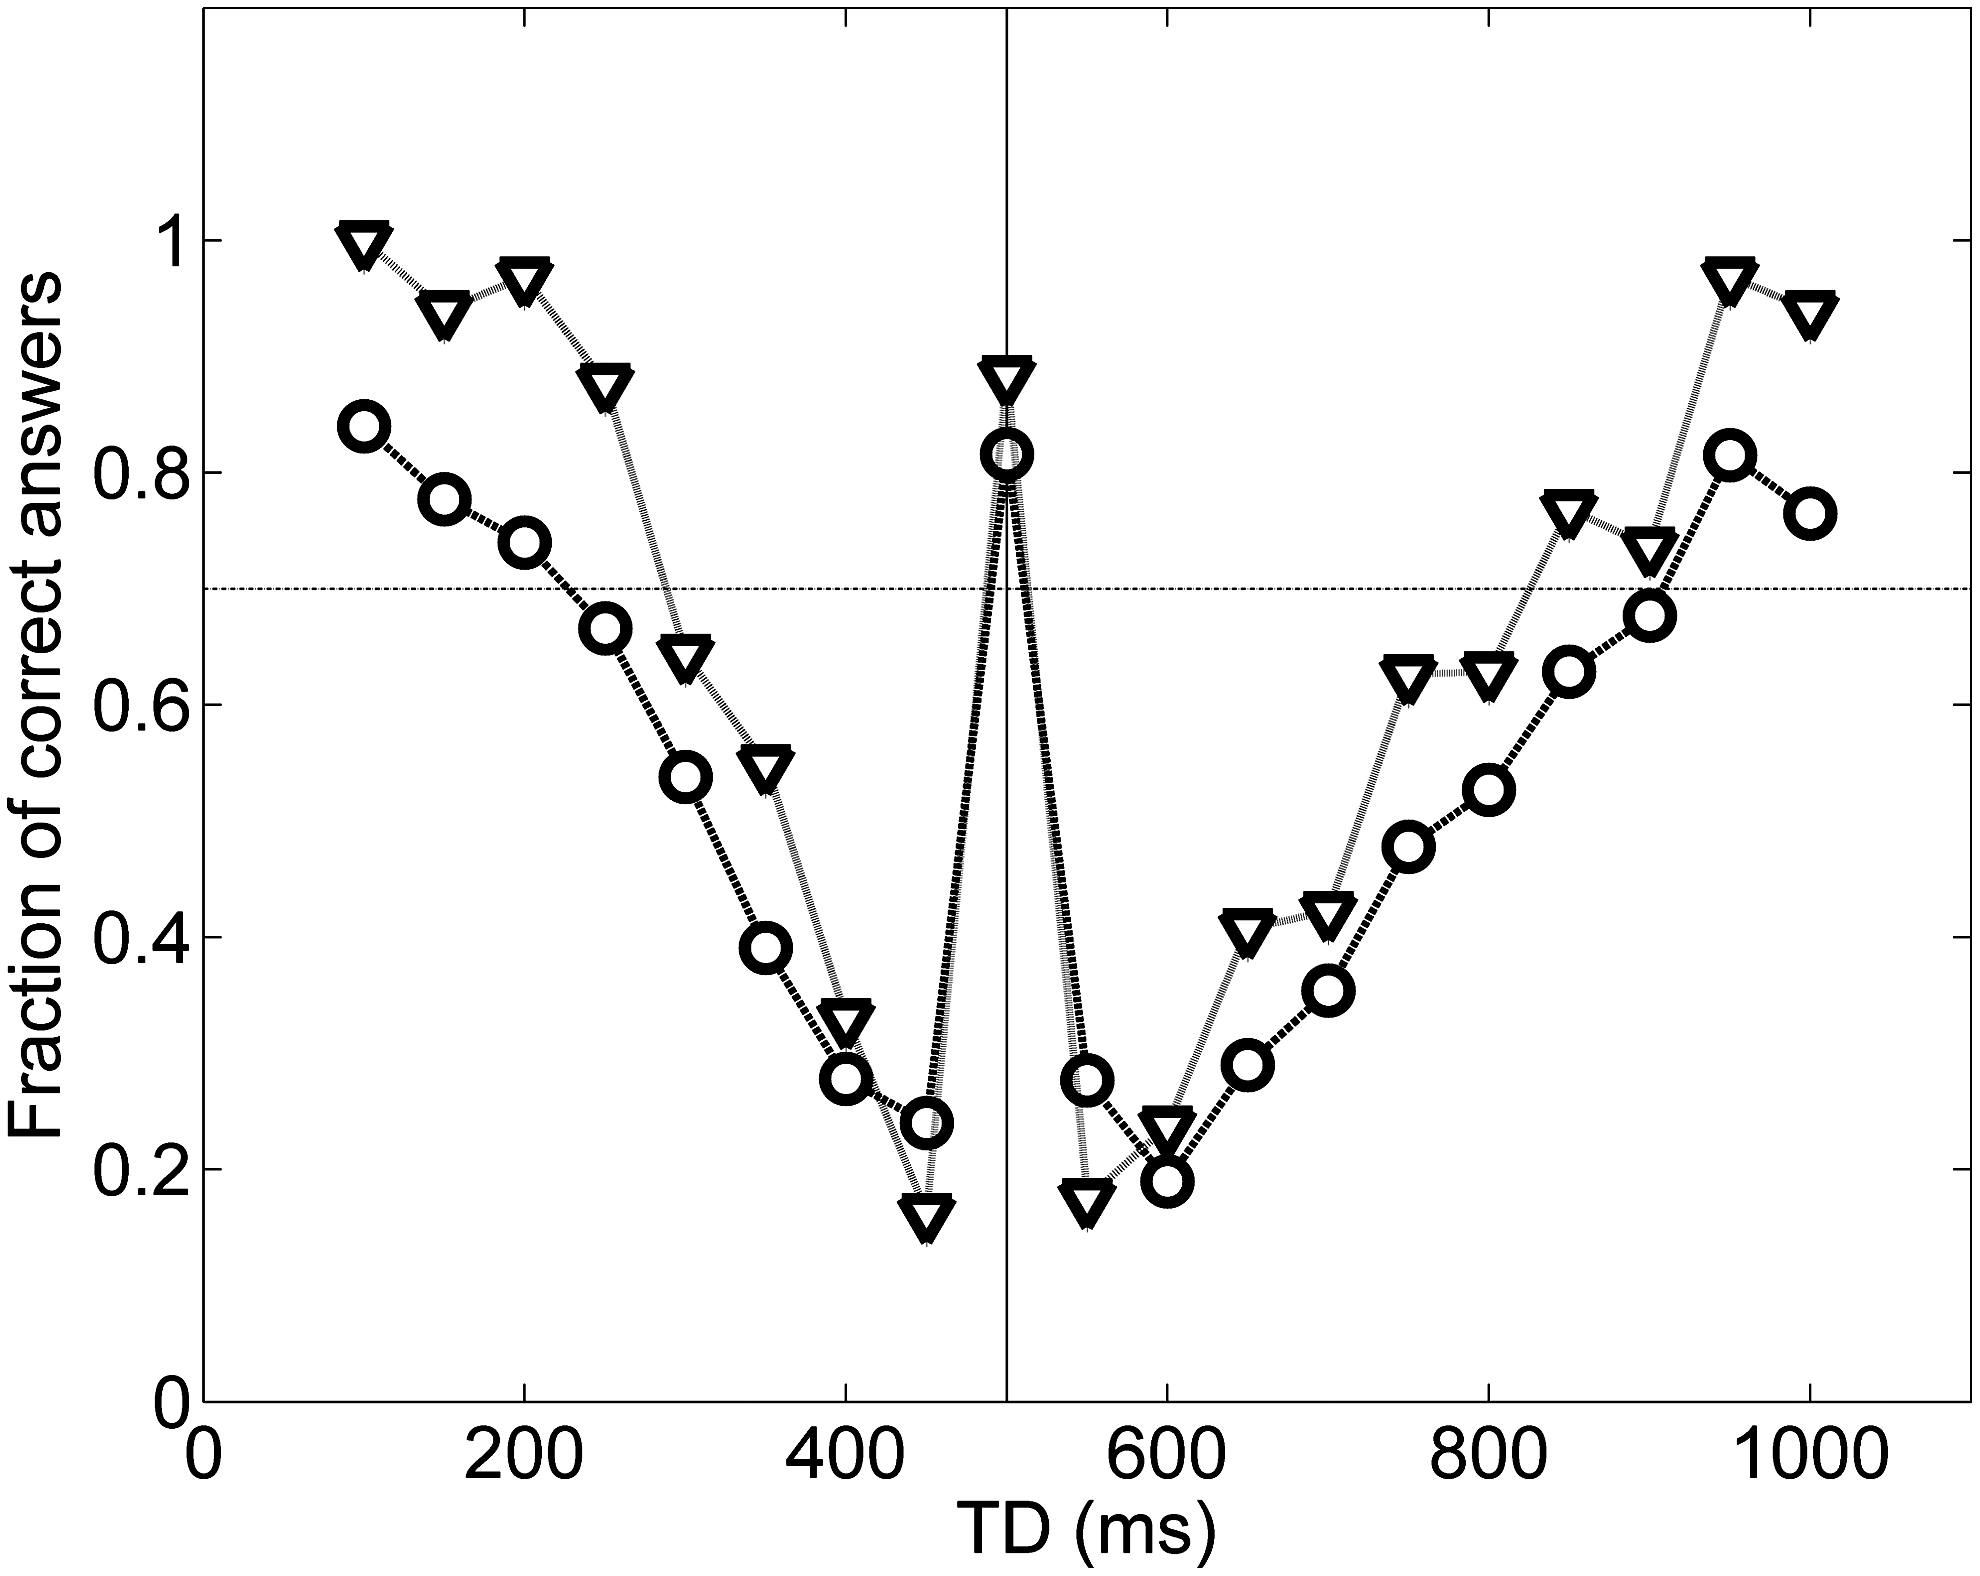
Group average plot for the temporal discrimination test. The data points represent the fraction of correct answers as a function of the test duration (TD) for the occasional players (circles) (OP) and chronic players (CP) (triangles).
To assess the significance of the difference in performance of both groups, we determined the discrimination thresholds (DT1 and DT2; see Fig. 1) for each individual and compared group averages (Fig. 3). There was a strong difference between groups (F(1, 16)=26.98; p<0.0001 between-group ANOVA). These results showed that DT was smaller for the CP group, suggesting that these subjects were able to distinguish more similar intervals when compared to the control group (OP). There was also a difference between DT1 and DT2 (F(1, 16)=21.97; p<0.001), which shows that the DT were not symmetrically distributed around RD; thresholds are longer for longer intervals, than for shorter intervals. There was no significant interaction between DT and group factors (F(1, 16)=0.09; p=0.77).

Group comparison of the discrimination thresholds DT1 and DT2 for both groups. There was a significant difference for the group and for between DT1 and DT2, and no significant interaction between these factors. *p<0.0001, **p<0.001.
Bisection task
Figure 4A illustrates P(L) as a function of the probe durations (Ti) for both groups for the Temporal Bisection task. The figure also shows the sigmoid curves that were fit to the data. Figure 4B shows the fitting parameters bisection point (BP) and τ for each group; there was no significant difference for BP (T(16)=0.66; p=0.52), while τ was significantly smaller for the CP group (T(16)=p<0.03; one-tailed test).

Results from the temporal bisection experiment.
Time Estimation and Time Production tasks
Results for time estimation and time production tasks are illustrated in Figure 5. For the time estimation task, there was no significant group effect for any of the tested intervals: 10 seconds (T(16)=0.603; p=0.55; Cohen_d=–0.31), 30 seconds (T(16)=–0.54; p=0.957; Cohen_d=0.00), and 60 seconds (T(16)=–0.233; p=0.82; Cohen_d=0.11). For the time production task, both groups produced time intervals close to the target intervals, and there was no statistical difference between groups for five (T(16)=–1.715; p=0.11; Cohen_d=0.88) and 45 seconds (T(16)=–0.365; p=0.720; Cohen_d=0.19).
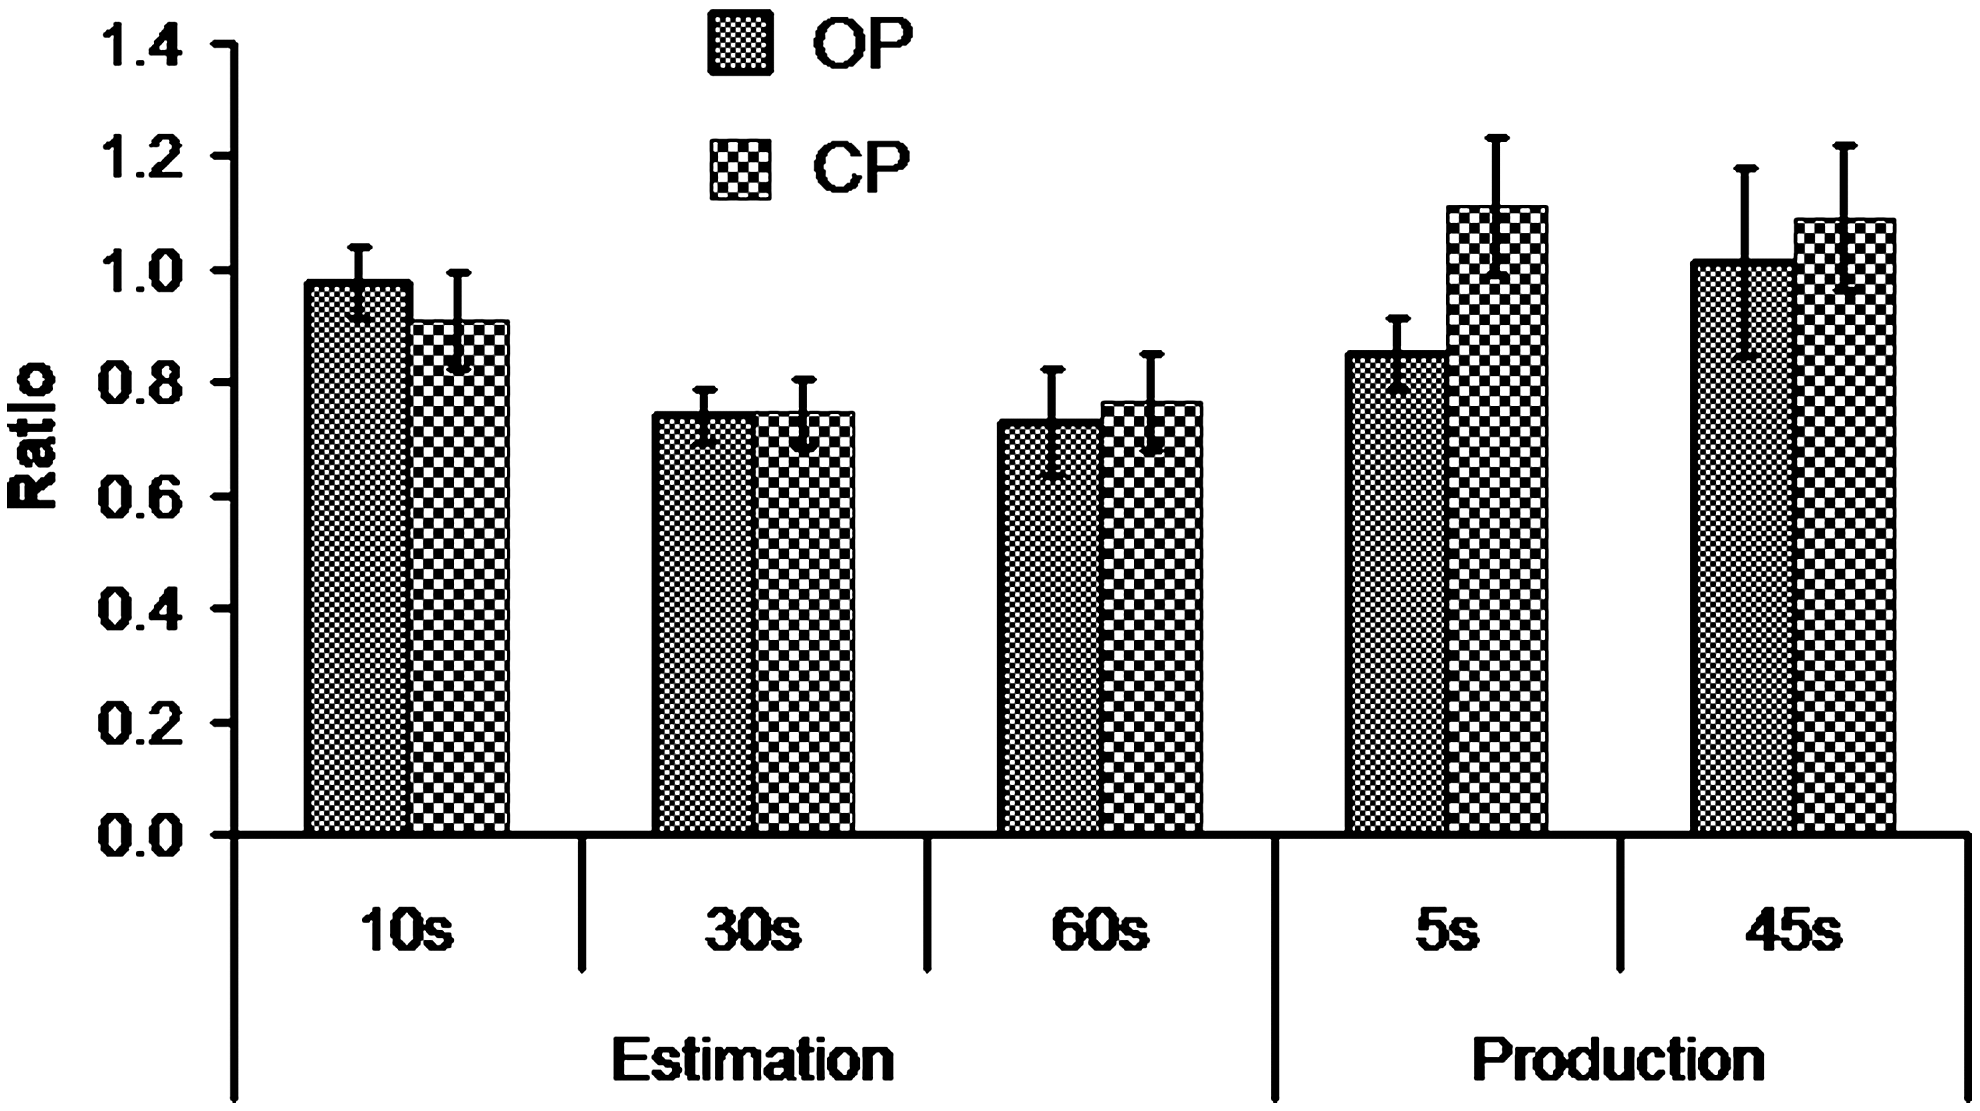
Time estimation and time production values expressed in rates (interval estimated or produced/real interval).
Discussion
This study aimed to investigate whether time perception of video game players is altered for sub- and multi-second ranges. When compared to OP, chronic video game players showed more precise time perception in the milliseconds range tasks, but no difference was found for the multi-second tasks.
The better performance for the sub-second intervals agreed with the finding that video game players have more precise multisensory (visual and auditory stimuli) temporal processing abilities. 9 Although the present study's protocol was not set to test casual links between video game use and cognitive abilities, our results might be interpreted in the context of several previous researches that demonstrated that video game use can enhance cognitive skills.10–15
The fact that we found an effect for sub-seconds, but not for the multi-second range also corroborates this argument. As sub-seconds intervals are associated to an automatic brain system, which draws mainly upon motor circuits, while multi-second intervals involve a cognitively controlled system. 3 Motor circuits and motor systems of the brain respond much better to training than frontal cognitive control systems. Therefore, it is more likely that the group differences found here represent enhanced timing perception skills that are trainable by video game play, than due to a consequence of self-selection sampling bias.
Regarding the multi-second tasks, previous studies that have investigated time estimation during game playing, have found mixed results.4,5 The estimation of a given duration is related to the number of new, unusual, or remarkable events that take place in that given period. 16 Different games vary in these elements, which could explain the mixed results. In our study, we controlled for this issue by using classic time perception tasks; we found no effect of video game usage for this time range.
Footnotes
Acknowledgments
We would like to thank the Department of Psychobiology and also thank Associação Fundo de Incentivo à Pesquisa (AFIP), Coordenação de Aperfeiçoamento de Pessoal de Nível Superior (CAPES), and Conselho Nacional de Desenvolvimento Científico e Tecnológico (CNPQ).
Author Disclosure Statement
No competing financial interests exist.