
Abstract
Abstract
The telephone survey is a common social science research method for capturing public opinion, for example, an individual's values or attitudes, or the government's approval rating. However, reducing domestic landline usage, increasing nonresponse rate, and suffering from response bias of the interviewee's self-reported data pose methodological challenges to such an approach. Because of the labor cost of administration, a phone survey is often conducted on a biweekly or monthly basis, and therefore a daily reflection of public opinion is usually not available. Recently, online sentiment analysis of user-generated content has been deployed to predict public opinion and human behavior. However, its overall effectiveness remains uncertain. This study seeks to examine the temporal association between online sentiment reflected in social media content and phone survey poll results in Hong Kong. Specifically, it aims to find the extent to which online sentiment can predict phone survey results. Using autoregressive integrated moving average time-series analysis, this study suggested that online sentiment scores can lead phone survey results by about 8–15 days, and their correlation coefficients were about 0.16. The finding is significant to the study of social media in social science research, because it supports the conclusion that daily sentiment observed in social media content can serve as a leading predictor for phone survey results, keeping as much as 2 weeks ahead of the monthly announcement of opinion polls. We also discuss the practical and theoretical implications of this study.
Introduction
Social media can enable individuals to express and share personal opinion publicly, via a variety of channels such as writing a personal blog or creating online forums, replying to other people's blog or forum posts, twittering their updates and re-tweeting other users' messages, or engaging in social networking sites. These modes of civic participation appear to broaden the conventional meaning of public opinion, which has generally been reflected in newspaper opinion articles, editorials, or letters to the editor, or in radio or television phone-in programs, written submissions to the government's public consultations, or responses to opinion polls. Recently, online opinion expression has become a new model of delivery of public opinion and is recognized as opening up a new avenue for enriching public discussion and societal debates and promoting pluralism. 4
However, since online users create posts on social media self-selectively, online opinion expression is by nature not representative of the population, and only those online contributors who choose to participate are represented. Studies have found that social media posts about a government and its policies are often written by well-educated, upper-class, and politically engaged citizens,5,6 and consequently, the view of the majority population is disproportionately under-represented in the social media.
Nevertheless, many researchers attempt to use online sentiment of the virtual sphere to reflect the collective opinion in the real world. Sentiment analysis is one of the major applications deployed in the field of information science. 7 The algorithms of sentiment analysis can computationally classify a set of opinionated content into specific categories by tone, usually positive, negative, and neutral. According to a review of various sentiment analysis techniques, accuracy rates of sentiment analysis techniques often range between 70 percent and 80 percent. 8 Sentiment analysis has been used in identifying online user's sentiment in the social media9,10 and in political user-generated content on web forums. 11 Some preliminary studies have deployed sentiment analysis to evaluate the correlation between sentiment of the social media content and the public opinion12,13 as well as to predict stock prices. 14 However, the overall effectiveness of using sentiment analysis to predict public opinion remains uncertain.
By deploying sentiment analysis techniques, this study aims to find out whether the sentiment of the social media content in Hong Kong is useful for making predictions of opinion survey results concerning government approval ratings. Our primary research question asks whether an online sentiment score can serve as a leading indicator to predict phone survey results in Hong Kong. If supported, we seek to examine the extent to which the computed online sentiment score can predict the phone survey results ahead of time.
Methods
A set of online posts in Hong Kong was collected and classified using computer-based sentiment analysis into whether or not they were presented as negative sentiments. The process of classification was then validated by making comparisons to the ratings assessed by human coders. Using the validated sentiment classifier, a time series of sentiment scores was computed. Phone survey results were collected from two Hong Kong pollsters' websites. Finally, statistical analysis was deployed to test the correlations between the sentiment scores and the phone survey results.
Sentiment classifier
A data archive of social media content in Hong Kong was systematically and automatically collected by computer-programmed crawlers. The information sources included four major online discussion forums, personal blogs, and microblogs in which the bloggers self-identify Hong Kong as the origin. The methodology of data collection has been reported elsewhere. 15 All data collected were publicly available online information and were not treated as personal data. Indirect identifier data fields, for example, a user identification code or user display name, will be changed to unidentifiable pseudocodes after all data are collected at the end of the project. The study was approved by the Human Research Ethics Committee for Non-Clinical Faculties, The University of Hong Kong.
A corpus of government-related posts was retrieved from the data archive in the period of April 1 to June 30, 2011, by keyword searching a list of government-related terms (a full list of terms is available upon request). In all, 66,468 posts were collected. A human rater was then assigned to classify these posts into two categories: negative sentiment or not a negative sentiment (others, hereafter). A negative-sentiment post is defined as the content that portrays a critical stance toward the Hong Kong government or social policies in Hong Kong or explicitly identifies at least one public body to which responsibility for a social policy or a public incident is attributed. Otherwise, the post was classified as other, representing a neutral or positive tone. Once the human classification was completed, quality check on a small random sample collected from the corpus was conducted by the first author. Finally, 1,468 negative-sentiment posts and 1,468 randomly selected other posts were identified.
Open-source Chinese-language processing software Nlpbamboo (
After that, 1,000 samples were randomly selected from each of the two sets of posts, that is, negative sentiment and others. The combined 2,000 samples were used as the training set for supervised machine learning. We used the R version 2.12.1 16 to conduct support vector machine analysis. 17 Support vector machine analysis is a statistical technique used to train a model for predicting categorical outcomes. After weighed by the inverse-document frequency, using R text mining package, 18 and deleting low-frequency terms, a term document matrix was generated and was used as the feature vector for support vector machine analysis. The size of the feature vector was 4,500 Chinese tokens.
The remaining 468 negative-sentiment posts and 468 other posts were combined to be a testing set. Three indicators were used to assess the performances of the sentiment classifier: accuracy, precision, and recall. The accuracy rate is calculated by dividing the number of correct predictions by the total number in the testing set. Precision is the percent of negative-sentiment predictions that were correct. Recall is the percent of negative-sentiment test items that were correctly predicted.
We tested the accuracy of the sentiment classifier. Accuracy of negative-sentiment prediction was found to be 79 percent. Precision, which is the level of correctly predicted negative sentiment, was 78 percent, and recall, which is the extent to which negative-sentiment test items were correctly predicted, was 80 percent. The results confirm that the sentiment classifier developed in this study yielded a fair level of accuracy comparable with some advanced techniques used in the field. 8
Online sentiment score
By deploying the sentiment classifier, we constructed a sentiment score to represent the extent to which daily negative-sentiment contents are manifested in the Hong Kong online opinion. We ran the sentiment classifier to evaluate an aggregate score on each day in the study period. With a sufficiently large sample, this approach has an advantage in that an aggregation of all posts' scores can potentially minimize the errors in the measurements, that is, false positives and false negatives, and may obtain a better estimation. 13
Sentiment score is devised by the following formula. The negative logarithm of the ratio of the predicted negative sentiment over the total is a conversion to make a lower sentiment score representing a more negative sentiment.
In the time period from July 11, 2011, to June 30, 2012, online posts were retrieved from the data archive by using the government-related keyword search. The obtained online contents were analyzed by the sentiment classifier, and as a result, daily sentiment scores were computed. The sentiment score time series was smoothed by evaluating its 30-day moving average for comparison to monthly survey data.
Telephone surveys
We obtained the phone survey results from the website of the University of Hong Kong's Public Opinion Programme (in short HKUPOP; website
In the study period, the first phone survey result was published by the HKUPOP on July 25, 2011. We therefore set a base point of 100 to represent the sentiment score on July 25, 2011. All sentiment scores and poll results were adjusted by dividing by the unadjusted score on July 25, 2011, and multiplying by 100.
Time-series analysis
To examine whether the online sentiment of the online media content analysis may have led the phone survey results (HKUPOP and HKIAPS) in time, cross-correlation analysis was performed to evaluate the temporal association between the time series of the online sentiment score and the phone survey results (HKUPOP and HKIAPS). The Box and Jenkins 19 autoregressive integrated moving average (ARIMA) method was used. First, we prewhitened all three time series by removing their temporal autocorrelations and identifying their ARIMA structures, 20 that is, ARIMA (p,d,q), where p, d, and q are the orders of the autoregressive, integrated, and moving average terms of the model, respectively. Plots of autocorrelation function, partial autocorrelation function, and the Ljung-Box χ2 tests were undertaken to confirm the absence of autocorrelation in the model residual. After these procedures, the residuals of the prewhitened time series were examined by cross-correlation analysis. Specifically, the residual of the online sentiment score was cross-correlated with the residuals of the phone survey results over the time range of 25 days before and after each time point. R package's TSA library 21 was used for the analysis. The 5 percent significant level was set for all statistical tests.
Using multiple regression models, the HKUPOP and HKIAPS were finally regressed with two models. Model 1: Only one independent variable is used. It is a 30-day lagged series of the phone survey result (last month's finding). Model 2: Two independent variables are used. They are a 30-day lagged series of the phone survey result and the corresponding time-lagged sentiment score. We hypothesize that Model 2 should be more efficient than Model 1 in predicting the HKUPOP and HKIAPS time series. If this hypothesis is supported, a time-lagged sentiment score can add value on time-lagged phone survey data in better prediction of the future phone survey results. Original scores along with predicted values of Model 1 and Model 2 were plotted and compared.
Results
Figure 1 displays the three time-series plots: smoothed daily online sentiment scores time series (upper panel, sentiment score, in short), daily interpolated HKUPOP polling result time series (middle panel, HKUPOP, in short), and daily interpolated HKIAPS polling result time series (lower panel, HKIAPS, in short). Visually speaking, the sentiment score line appears to follow the rise-and-fall trends of the lines of the HKUPOP and the HKIAPS quite well in the first 220 days (dashed line). However, that was not the case in the last 100 days, especially the spike found between day 220 and day 250 in the HKUPOP.
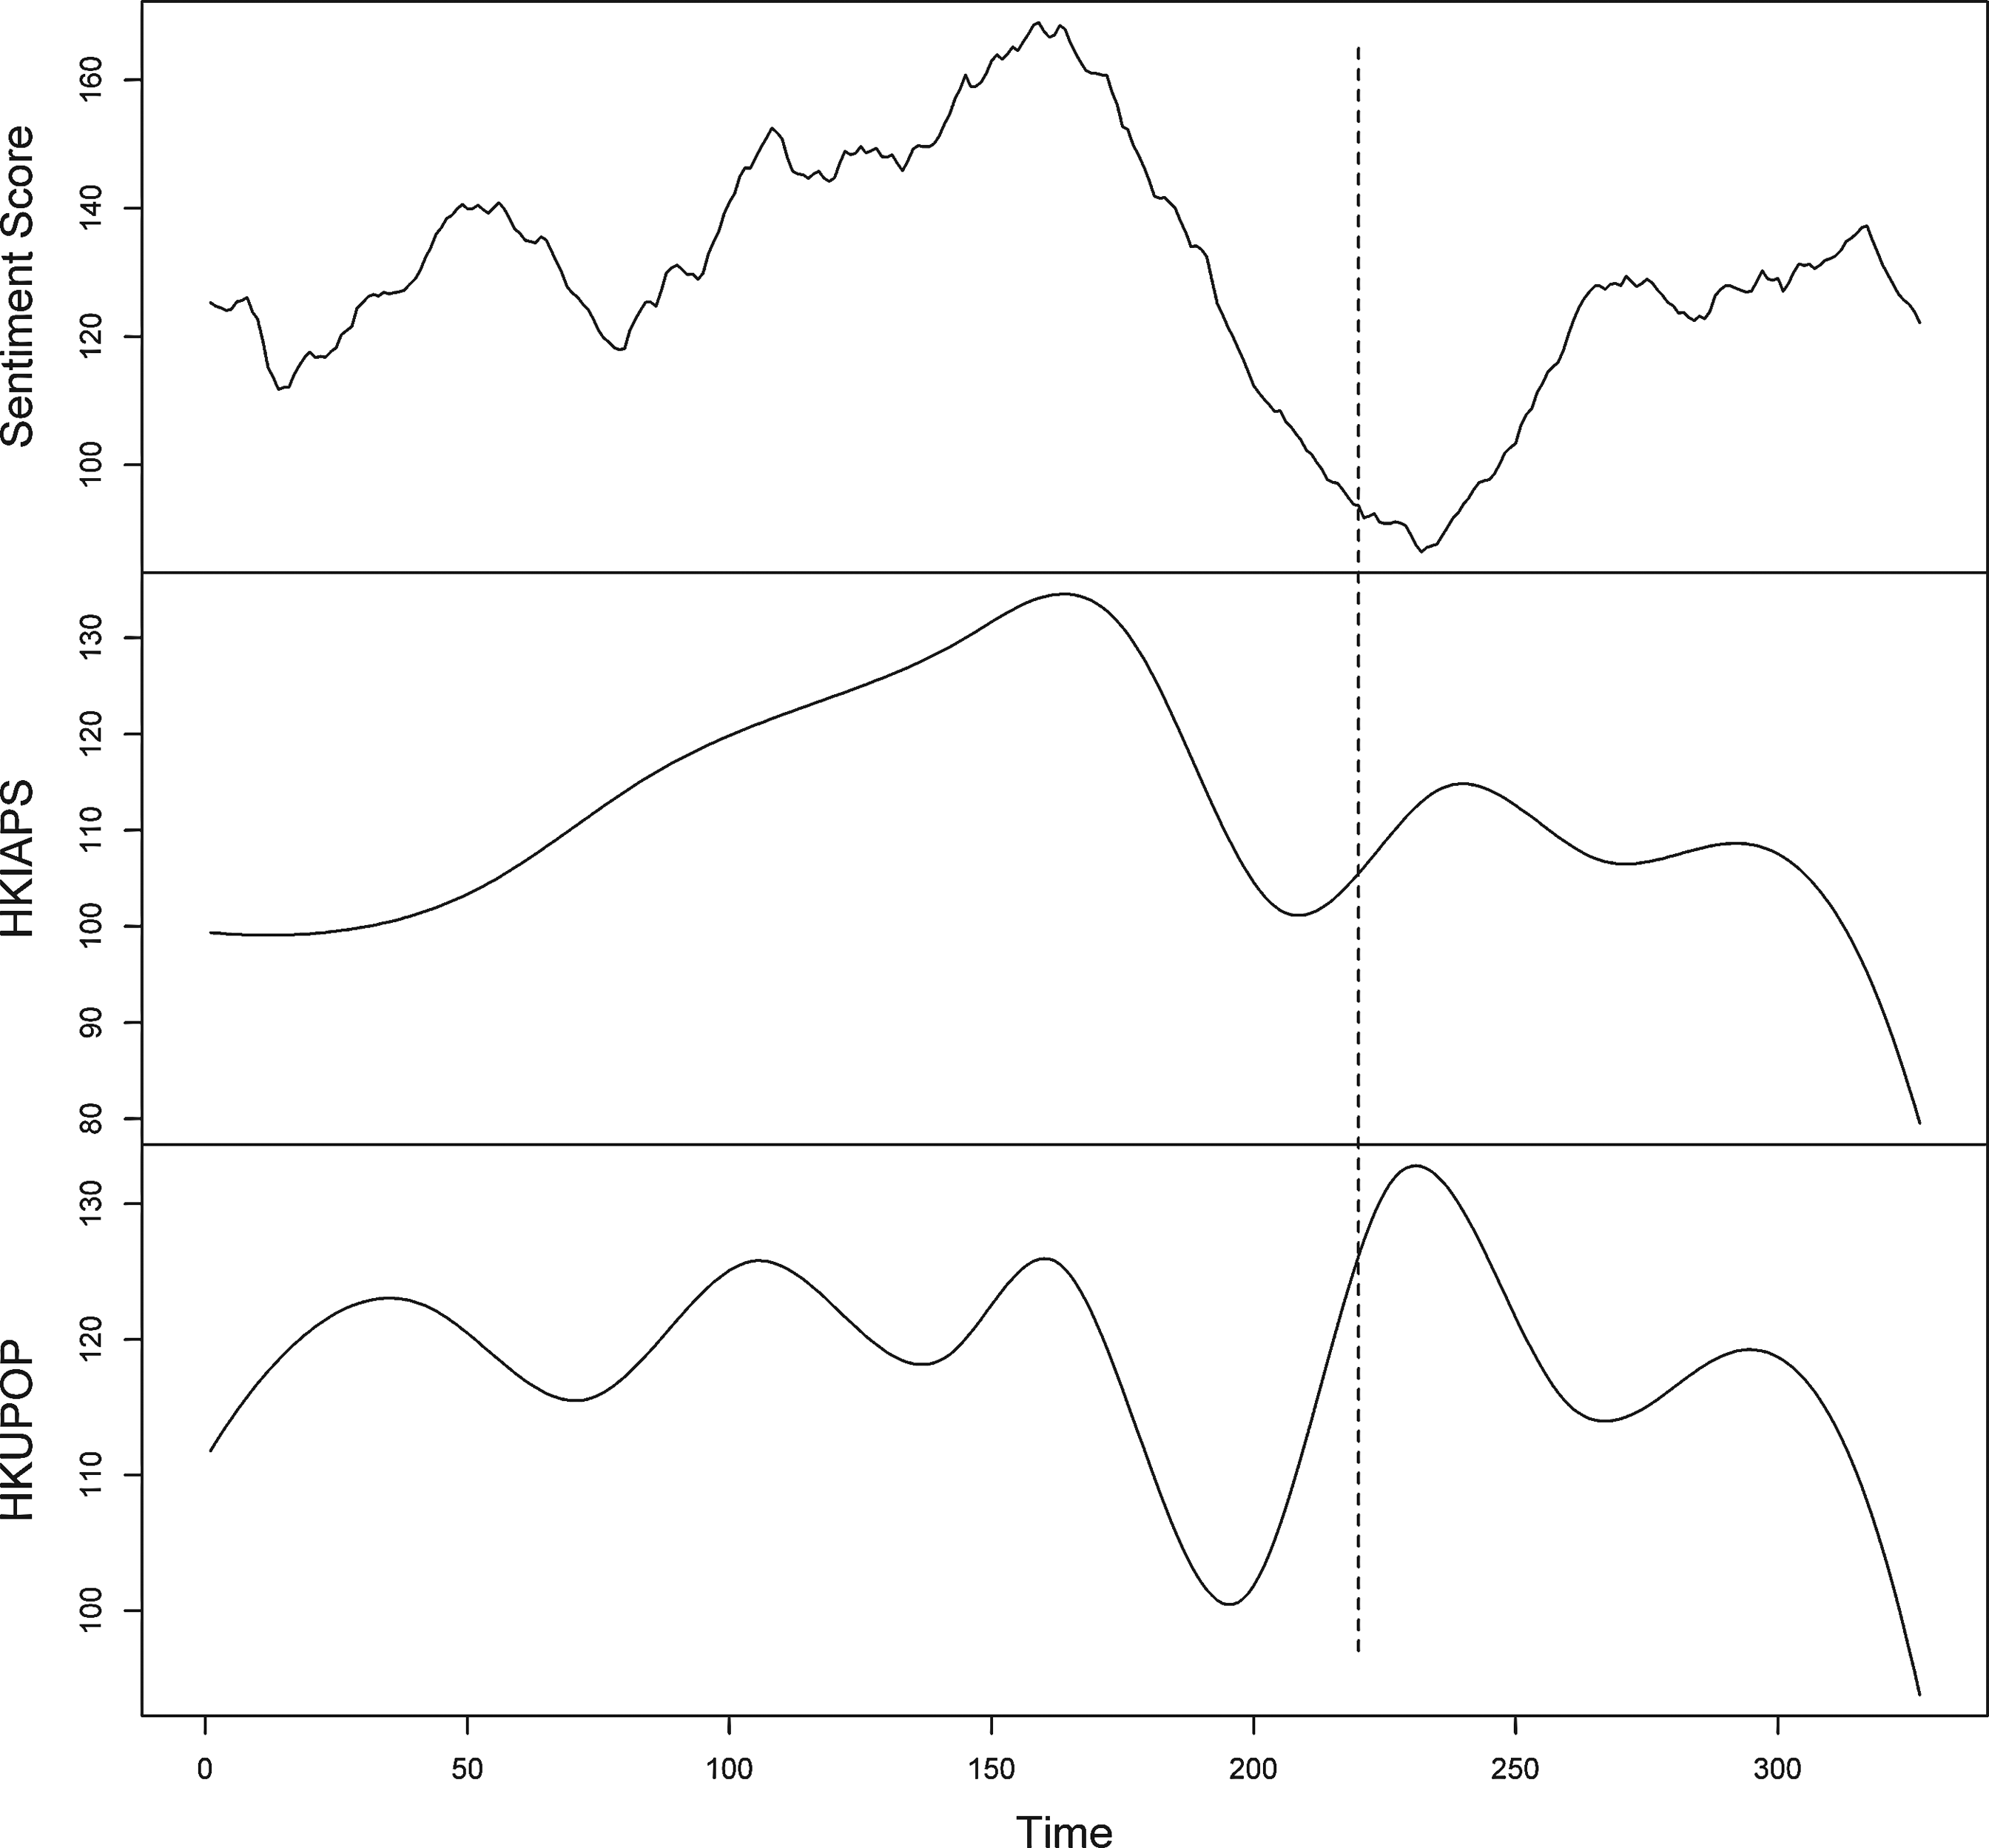
Time-series plots of smoothed daily online sentiment scores (upper panel), daily interpolated HKUPOP polling result (middle panel), and daily interpolated HKIAPS polling results (lower panel). Remark: Day 220th is indicated with a vertical dashed line.
The three time series were differenced to become stationary and were then fitted with separate ARIMA models. The sentiment score was fitted with ARIMA (1,0,1) model; the HKUPOP was fitted with ARIMA (0,0,1) model; and the HKIAPS was fitted with ARIMA (0,0,1) model. Three residual time series of the models passed the time-series diagnostic tests in which all autoregressive terms were statistically nonsignificant.
Figure 2 shows the cross-correlation functions between the sentiment score residual time series and the HKUPOP residual time series (upper panel) and between the sentiment score residual time series and the HKIAPS residual time series (lower panel). A significant correlation was found at lag=−8 (upper panel) and at lag=−15 (lower panel), and the correlation coefficients were 0.161 (95 percent confidence interval (CI) [0.05, 0.27], p=0.004) and 0.166 (95 percent CI [0.06, 0.27], p=0.004), respectively. The significant lag values are highlighted in bold in Figure 2. As a result, the sentiment score seems to lead the HKUPOP time series by about 8 days and was ahead of the HKIAPS time series by about 15 days.

Cross-correlation functions between the sentiment score residual and the HKUPOP residual (upper panel) and between the sentiment score residual and the HKIAPS residual (lower panel). Remark: Significant lag values are highlighted in bold.
Figure 3 presents predictions for HKUPOP and HKIAPS with Model 1 and Model 2. Results show that, in the whole range of the time points of the HKIAPS and the time points from 0 to 200 of the HKUPOP, the Model 2 lines were seen to be a time-lagged version of the Model 1, suggesting that the Model 2 was more sensitive than the Model 1 to predict the changes of the HKUPOP and HKIAPS. However, in the upper panel, there was an exception at the time period between 200 and 230, in which the HKUPOP line moved up, but the predictions went down. The R-squared values of the Model 1 and Model 2 were 18.7 percent and 19.3 percent (HKUPOP)/24.9 percent and 32.4 percent (HKIAPS), respectively. Model-fits statistics indicate that the model fitness for Model 2 was statistically more significant than Model 1 in the HKIAPS case (p<0.05). For the HKUPOP case, there was no significant difference between the two models (p=0.15). However, when considering that the time points ranged from 0 to 200 in the HKUPOP case, the R-squared values for Model 1 and Model 2 increased to 21.0 percent and 34.0 percent, respectively, and Model 2 was significantly better fitted than Model 1 in this shortened time range (p<0.05).
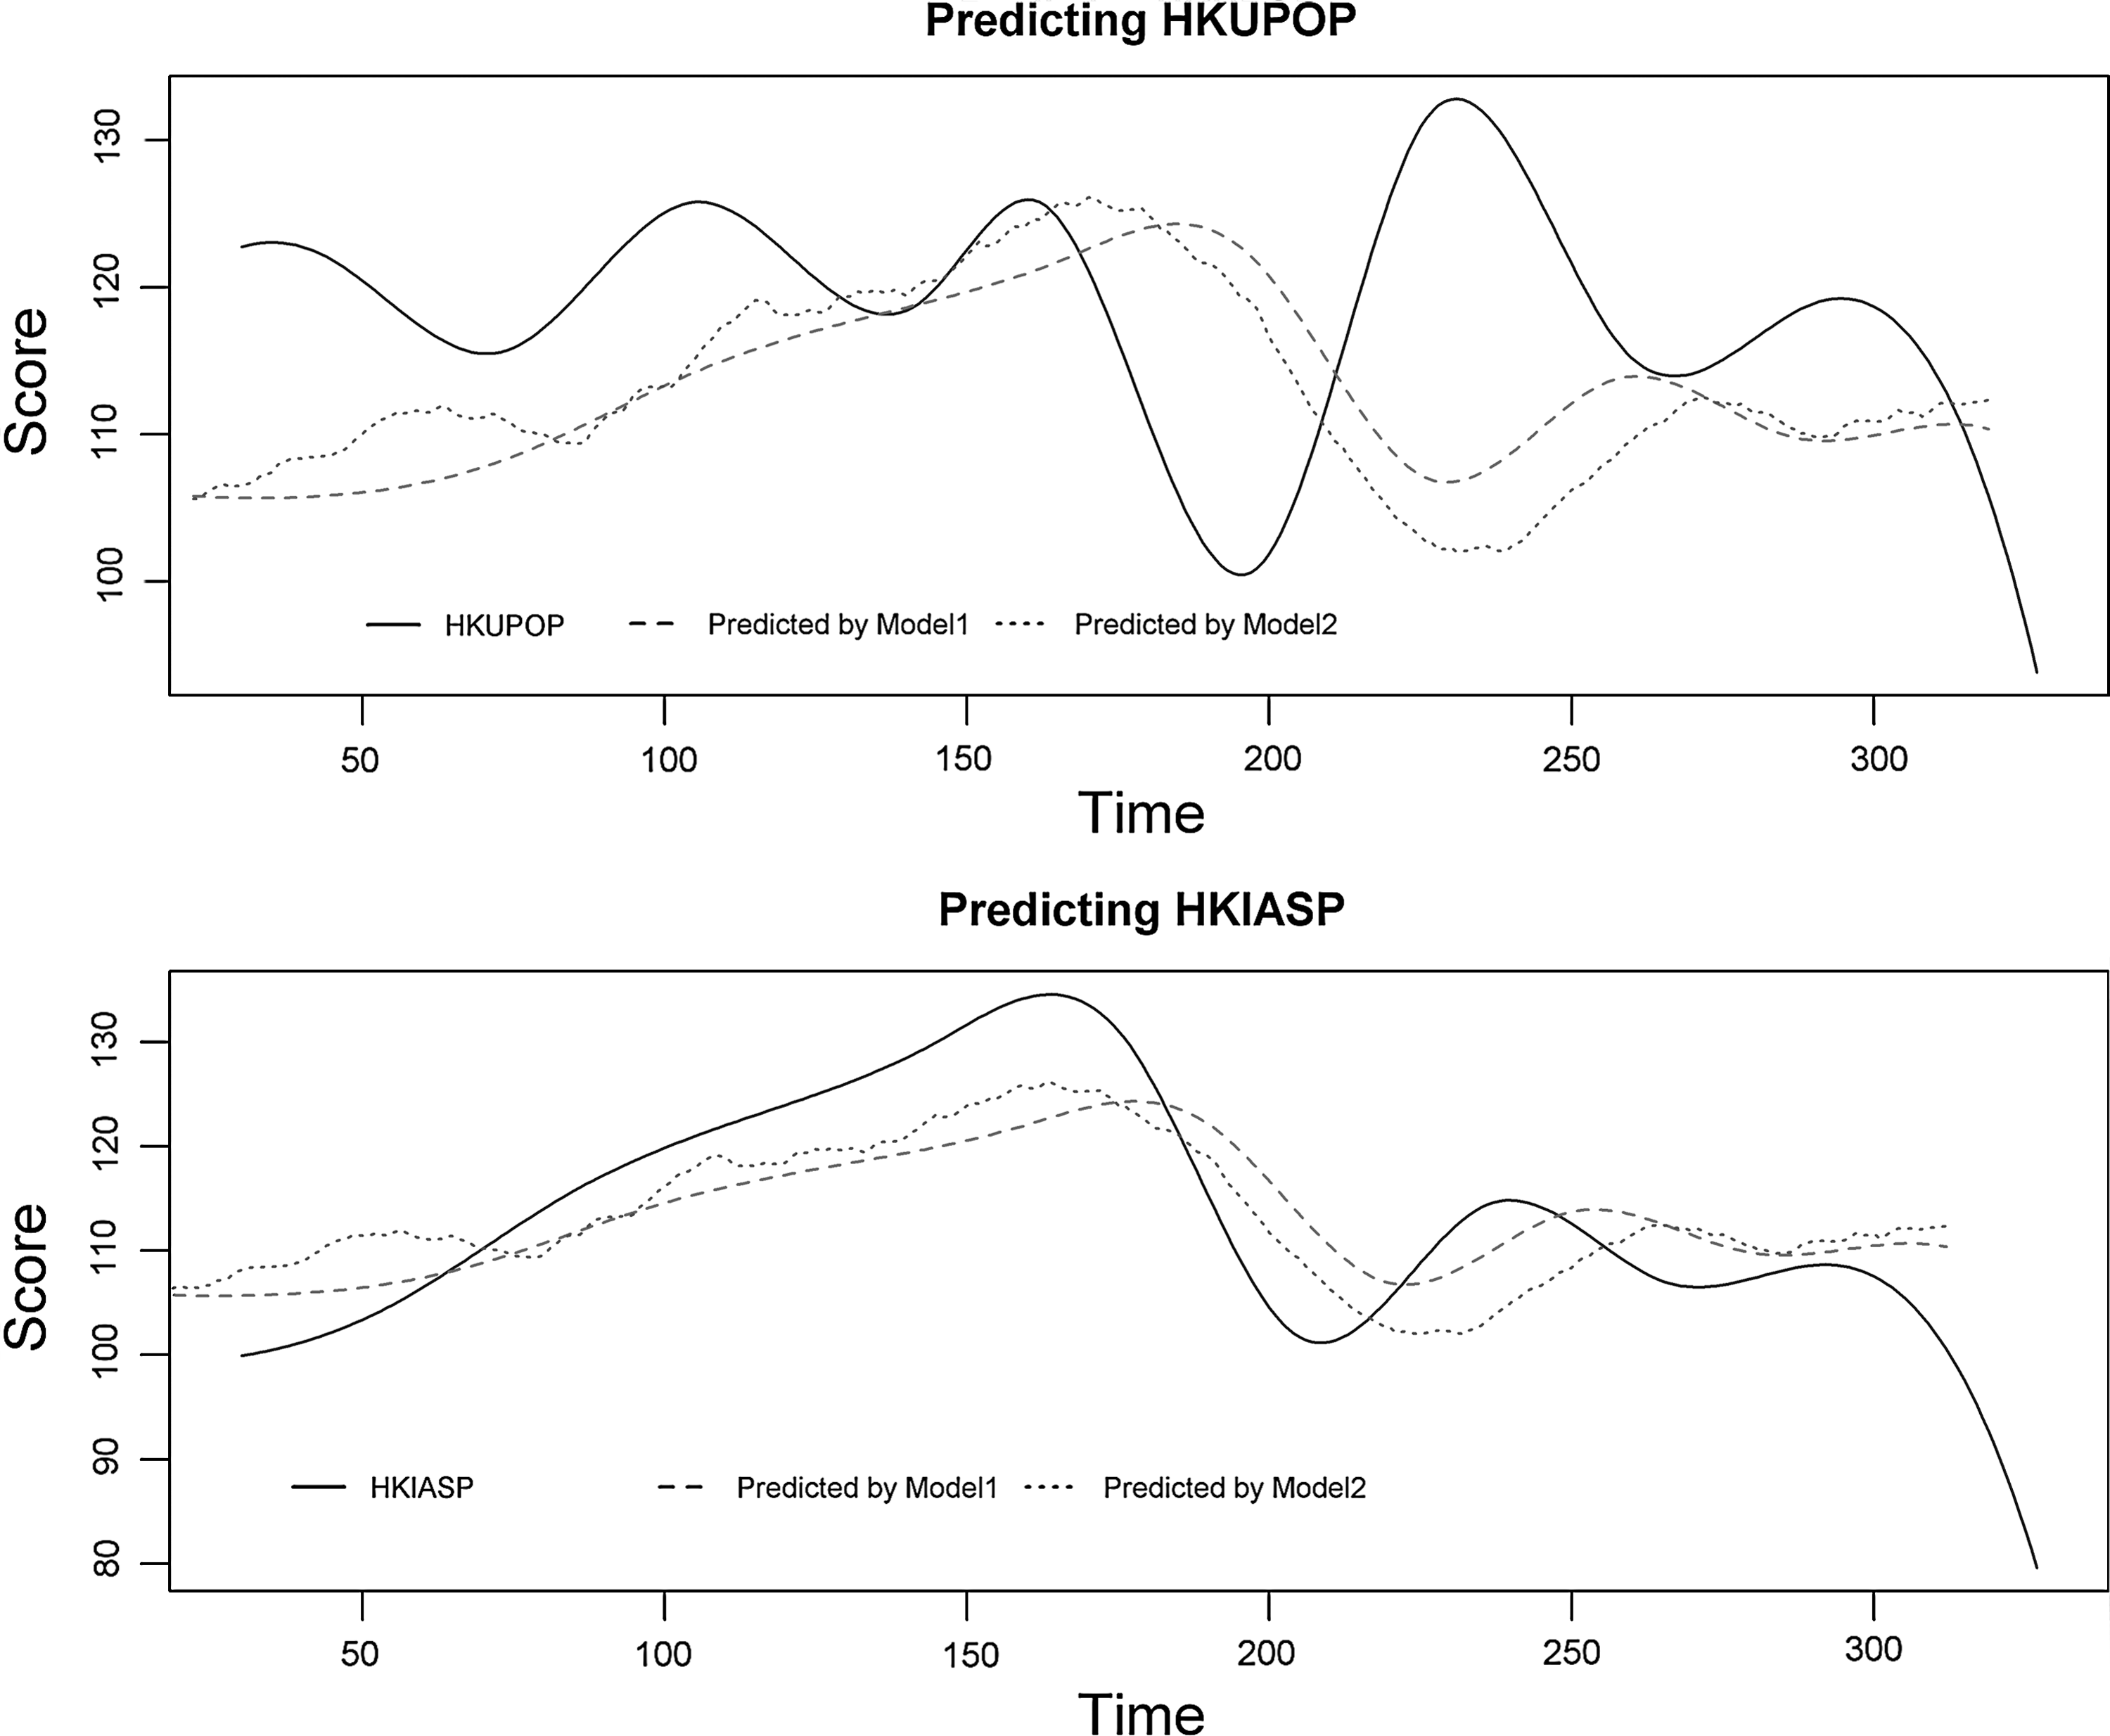
Predictions for HKUPOP (upper panel) and HKIAPS (lower panel) with Model 1 and Model 2. Remarks: HKUPOP: R2 (Model 1)=18.7 percent, R2 (Model 2)=19.3 percent; HKIAPS: R2 (Model 1)=24.9 percent, R2 (Model 2)=32.4 percent (HKIAPS). Model-fits statistics indicate that HKIAPS: Model 2>Model 1 (p<0.05); HKUPOP: Model 2=Model 1 (p=0.15).
Discussion
Public opinion survey aims, by definition, to select samples randomly from the general population, whereas online opinion is primarily elitist driven. 5 As a subset of the general population's views, online opinion does not seem to be a representative of overall public opinion. Nevertheless, this study and others12,13 support the conclusion that online sentiment of user-generated contents can serve as a leading predictor for public opinion. Following on previous findings, this study deployed time-series statistical analysis techniques and successfully identified the exact time lags between daily online sentiment and two distinct monthly released public opinion survey results in Hong Kong. Our finding supports that the daily online sentiment index can serve as a leading indicator for the interpolated monthly opinion poll results, such that the predictions can be observed 8–15 days ahead of the announcements of the monthly result of opinion poll.
The practical significance of such findings is apparent, because online sentiment analysis of user-generated contents is empirically supported to be a time-lagged predictor of offline phone survey findings. As mentioned, the reliability and validity of the traditional phone survey methodology are being challenged. Pollsters are finding it increasingly difficult to recruit phone survey participants and to maintain high quality and reliable data collection. Further, the phone survey methodology is not an effective approach to measuring rapid response from the public. Despite these limitations of the survey methodology, a phone survey is still a widely used social science method. To provide an alternative approach, this study asserts that sentiment analysis of social media content would be a reliable, feasible, and relatively low-cost solution. This approach may not be only applied to measuring public opinion, but can also be extended to assess other social indicators such as an individual's values, attitude, or cognition. We suggest more studies to explore additional applications of using social media data in measuring social science indicators.
Besides its practical implications, this study also raises an interesting theoretical question: How can we account for the correlation between the population-based opinion survey result and the elitist-driven online sentiment? There are at least three plausible explanations. First, according to the theory of the two-step flow of communication, 22 opinion leaders make comments on the social agenda publicly and appear regularly in radio, television, newspaper, and magazine content. Their opinion is an important ingredient in the formation of public discourse, and consequently has profound impacts on the general population's opinion. This group of elites can extend this opinion formation process from offline to online environments and reinforce their influence across offline and online media. Their online opinions can therefore be deployed as a proxy to represent the overall population. Future study is warranted to compare the profiles and the impacts of the opinion leaders between online and offline environments to test this proposition. The second explanation is that the correlation of opinion surveys and online sentiment is confounded by mass media impact. Extensive research has been established in supporting the notion that public opinion is profoundly shaped by news media. 23 News sources are also found to be one of the major references of the posts on the social media. 15 Therefore, if normal citizen and online netizens are both strongly influenced by news media, we argue that both phone survey results and online sentiment may be solely reflections of the same underlying factor: the attitude of the news media. This explanation can be tested by adding news media content as a covariate in the future research.
The third explanation involves the methodological and sampling biases. Both phone survey results and social media content may be imperfect indicators in measuring the true value of public opinion. The biases may be caused by a systematic error. For example, more enthusiastic respondents to phone surveys are more likely to create posts on social media, and respondents who tend to self-report their critical attitude toward government have a higher likelihood of making negative comments online. As a result, both time series are spuriously found to be correlated.
These three explanations are not mutually exclusive. Future empirical studies are required to examine and confirm these explanations.
To conclude, the phone survey is and will be an important social science research methodology, despite its well-known limitations. We suggest that the quantitative techniques we have developed to represent sentiment found in social media content in Hong Kong would be a promising and reliable leading predictor for public opinion and can serve as an alternative and complementary solution for social science researchers.
Footnotes
Acknowledgments
This study was funded by the University of Hong Kong HKU Seed Funding for Basic Research and the Central Policy Unit, Hong Kong SAR Government. The authors wish to acknowledge the contribution made by Mr. Cedric Sam and Mr. Ben Wu in developing the computer programs for data collection.
Author Disclosure Statement
No competing financial interests exist.