
Abstract
Abstract
Two widely used scales of Internet addiction (IA), the Internet Addiction Test (IAT) and the Chen Internet Addiction Scale (CIAS), were compared and a new scale of IA was assembled from their items with improved reliability in terms of classification consistency. A total of 467 Chinese college students participated in the study. Items were calibrated using the Muraki's Generalized Partial Credit Model. Most items had higher item information on medium levels of addiction, but much lower item information on the two ends of the latent trait continuum. The average item information of the CIAS was significantly larger compared with IAT on most of the latent trait levels. A new scale assembled using the cutoff points of IAT had a larger classification consistency than the original IAT. It was shown that the classification consistency of the IA measurement could be improved by selecting items to optimize test information around cutoff points. Implications for test and item development of IA were discussed.
Introduction
The term Internet addiction (IA) originally coined by Goldberg 4 was adopted by many researchers, including Young to refer to problematic Internet use associated with significant social, psychological, and occupational impairment. 5 Alternative terms include pathological Internet use, 6 Internet pathological use, 7 problematic internet use, 8 Internet dependency, 9 and Internet behavior dependence. 10 This article has chosen to use the term of IA due to its prevalence and acceptance.
Measurement is central to the research method of IA. One of the first instruments is a short inventory with eight questions adapted from the criteria for pathological gambling in the Diagnostic and Statistical Manual of Mental Disorders, 4th edition (DSM-IV), known as the 8-item Diagnostic Questionnaire of Internet Addiction. 11 Criticized for its lack of reliability, 12 Young expanded it to a 20-item Internet Addiction Test (IAT). 13 Respondents are typically classified into two or three categories based on their sum scores. For example, for the 20-item IAT, Young 13 suggested two cutoff scores at 50% and 80% of the total score. Taiwanese scholars developed an alternative scale, the Chen Internet Addiction Scale (CIAS), which has been widely used in China. 14 The two scales share the characteristics of partial credit, self-report questionnaires, and classification based on the total score. They were chosen in this study because of reported good internal consistency and concurrent validity as well as their popularity.15–17
The psychometric analysis of IA scales has some problems. First of all, standard statistics to compare different measurement instruments, including correlation coefficients and internal consistency offer little information regarding the reasons why one scale outperforms another.15–18 Second, most of the current measurement instruments were developed years ago; given the rapid transformation of the Internet, the psychometric properties of IA scales need to be reinvestigated. Last, but not least, the scales of IA are often used as criterion-referenced tests since diagnosis is of interest, but they are generally treated as norm-referenced tests in psychometric analysis. For one thing, items in a certain scale usually have no relationship with its cutoff scores, while 50%, 80%, or 95% of the total scores are usually used as cutoff scores. For another, there has been a lack of reliability evidence concerning the classification of IA scales.
This study is an attempt to address the above problems using the item response theory (IRT).19,20 The main purpose is to improve the measurement of IA using calibrated items selected from IAT and CIAS. Another goal is to compare the performances of the two scales.
Methods
Participants
An on-line survey was constructed. Internet users were recruited through popular social networking sites. The 467 participants (293 females, 174 males; average age M=23.31 years, SD=3.43) volunteered to complete the questionnaire received a chance to participate in a small lottery as a gesture of appreciation.
Instruments
This study used a 46-item questionnaire, which included 20 items from Young's IAT and 26 items from CIAS. Participants were asked to rate each item on a 5-point Likert scale (Not at all, Rarely, Occasionally, Often, Always). Upon scrutiny of the items in each instrument, the wording of some particular questions was revised.
Analyses procedures
In this study, the focus lies on the overall notion of IA. Although some instruments were developed with several subscales, the overall concept of IA can be seen as a second-order factor. Besides, the dimensionality of scales is generally ignored when classifying respondents according to their sum scores.15,21 Therefore, this study applied a unidimensional IRT model to each of the scale.22,23
Analysis of dimensionality and scalability. Before item response analysis, Mokken tests were conducted for IAT and CIAS, respectively, to examine the dimensionality and scalability using the Mokken package in the computer program R2.13.0.24,25
IRT Analysis. Muraki's Generalized Partial Credit (GPC) Model was chosen as the IRTmodel 19 in the computer program IRTProbeta. 26 There are three types of item parameters: ai is the discrimination parameter of item i, which indicates how well an item uncovers the examinees' ability or trait; bi is the location parameter of item i, which indicates the general difficulty level of a certain item; dh is the step difficulty parameter of item I with a category score of h. Besides item parameters and latent trait scores (θj for respondent j), we could also obtain item information curves (which is a function of θ) for each item and the aggregation of them is the test information curve. 19 Some items are deleted from each scale because of local dependence (LD). The criterion is the standardized LD χ2 statistics, which suggest strong residual when the values are extremely large (often the value of 10 is used as a threshold).27,28 Each time, one of the items in the item pair with the largest value of the standardized LD χ2 was deleted. S-χ 2 item-fit statistics were also reported, significant results (p<0.01) of which indicate poor model-data fit.
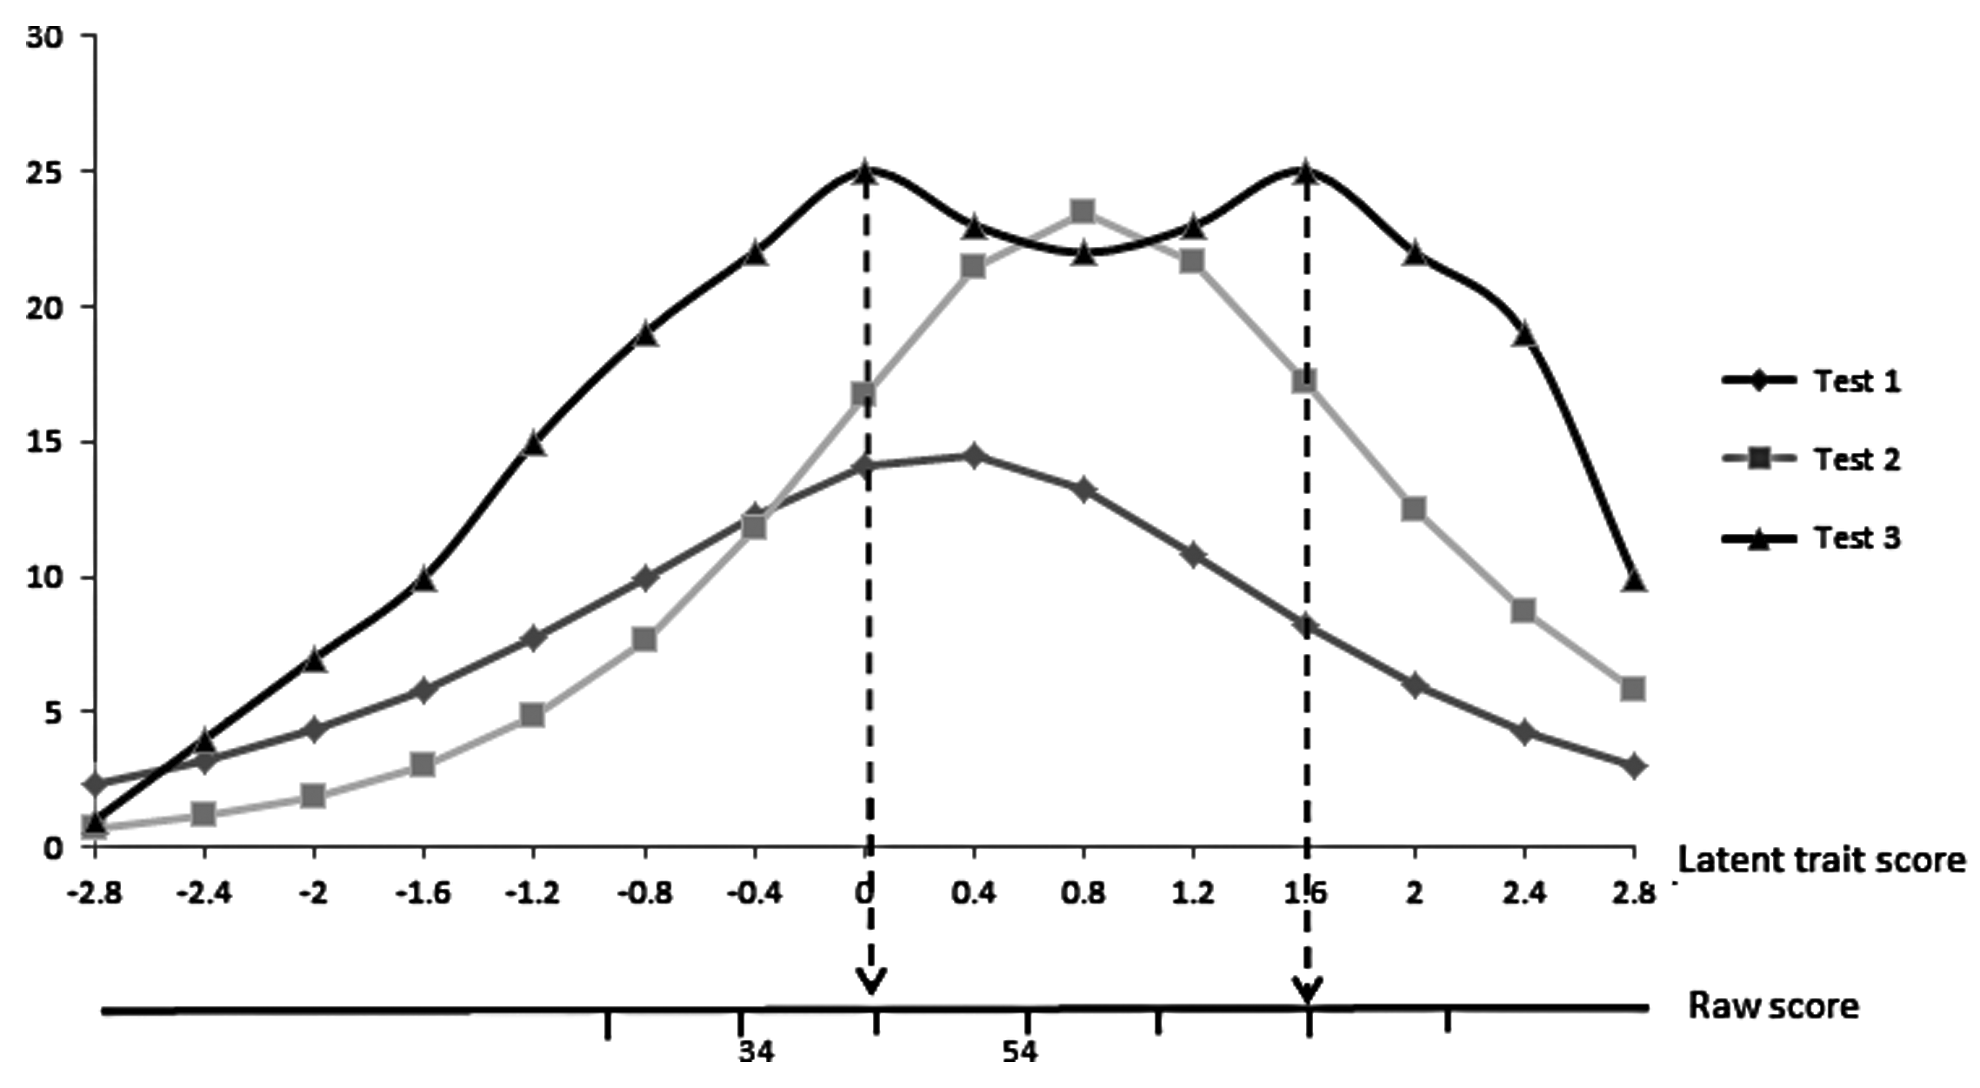
Test Assembly. The calibrated items from CIAS and IAT form an item pool for IA. Twenty items were selected from the item pool to assemble a new scale. The diagnosis criteria proposed by Young were used. 13 Ideally, the assembled test would have a test information curve like Test 3 in Figure 1.
Schematic plot illustrating the ideal test information curve of a criterion-referenced test in comparison with other tests.
The assembling process involves three steps 20 : (1) identify the cutoff points of raw scores, which are50% and 80% of the total score. After deleting three items and collapsing categories, the total score of the revised IAT in this study is 68, so the two cutoff scores are 34 and 54; (2) use maximized likelihood to calculate the latent trait scores corresponding to raw scores with item parameters of the IRT model. In this study, the corresponding latent cutoff scores are 0 and 1.60; (3) select items from the item pool that can optimize the test information on the latent cutoff scores. At first, ten items which provide the most information around latent cutoff scores of 1.6 were selected; then, ten other items were obtained for the other cutting scores with the same criterion.
Classification consistency. The classification consistency of the new scale is compared with that of IAT which reflects the reliability of criterion-referenced tests. 29 Classification consistency was calculated with IRT-CLASS v2.0 for PC. 29
Results
Model fit
The initial model calibration used a polytomous model with five ordered categories. For 43 out of 46 items, no IRT model could fit the observed data according to S-χ 2 item-fit statistics (p<0.05). After joining the 4th and the 5th points on the Likert scale, as suggested by Embreston and Reise, 19 the GPC model could fit the modified data with four categories well (p>0.05). The following analysis was based on the results of joined categories (1 to 4).
After collapsing categories, Mokken analysis was conducted again and the overall H coefficient is 0.35 for IAT and 0.44 for CIAS. Both scales can be regarded as moderate scales according to Mokken's criterion. 24 Finally, three items (Y1, Y8, and Y17) were deleted from IAT; and five items (C3, C5, C12, C21, and C26) were deleted from CIAS because of LD. The RMSEA for the final models are satisfactory (0.04 for IAT and 0.07 for CIAS), and none of the S-χ2 item level diagnostic statistics is significant (p>0.01).
Item analysis and test information
The items from two scales were calibrated separately, but the responses were from the same group of respondents and the scale of latent trait was set with a mean of 0 and a standard error of 1. Therefore, the item parameters from the two scales can be compared directly without the need of equating. 30 The item parameters of each item are presented in Table 1.
Note: logit=a[k(θ−b)+Σdk, where a is the item discrimination parameter, b is the item location parameter, and dk(k=1, 2, 3, 4) is the category parameter. According to the model setting, d1 is 0 for each item. C stands for items form CIAS; Y indicates IAT items. Item 1, 8, and 17 were deleted from IAT; and Item 3, 5, 12, 21, and 26 were deleted from CIAS. GPC, Muraki's Generalized Partial Credit; IAT, Internet Addiction Test; CIAS, Chen Internet Addiction Scale.
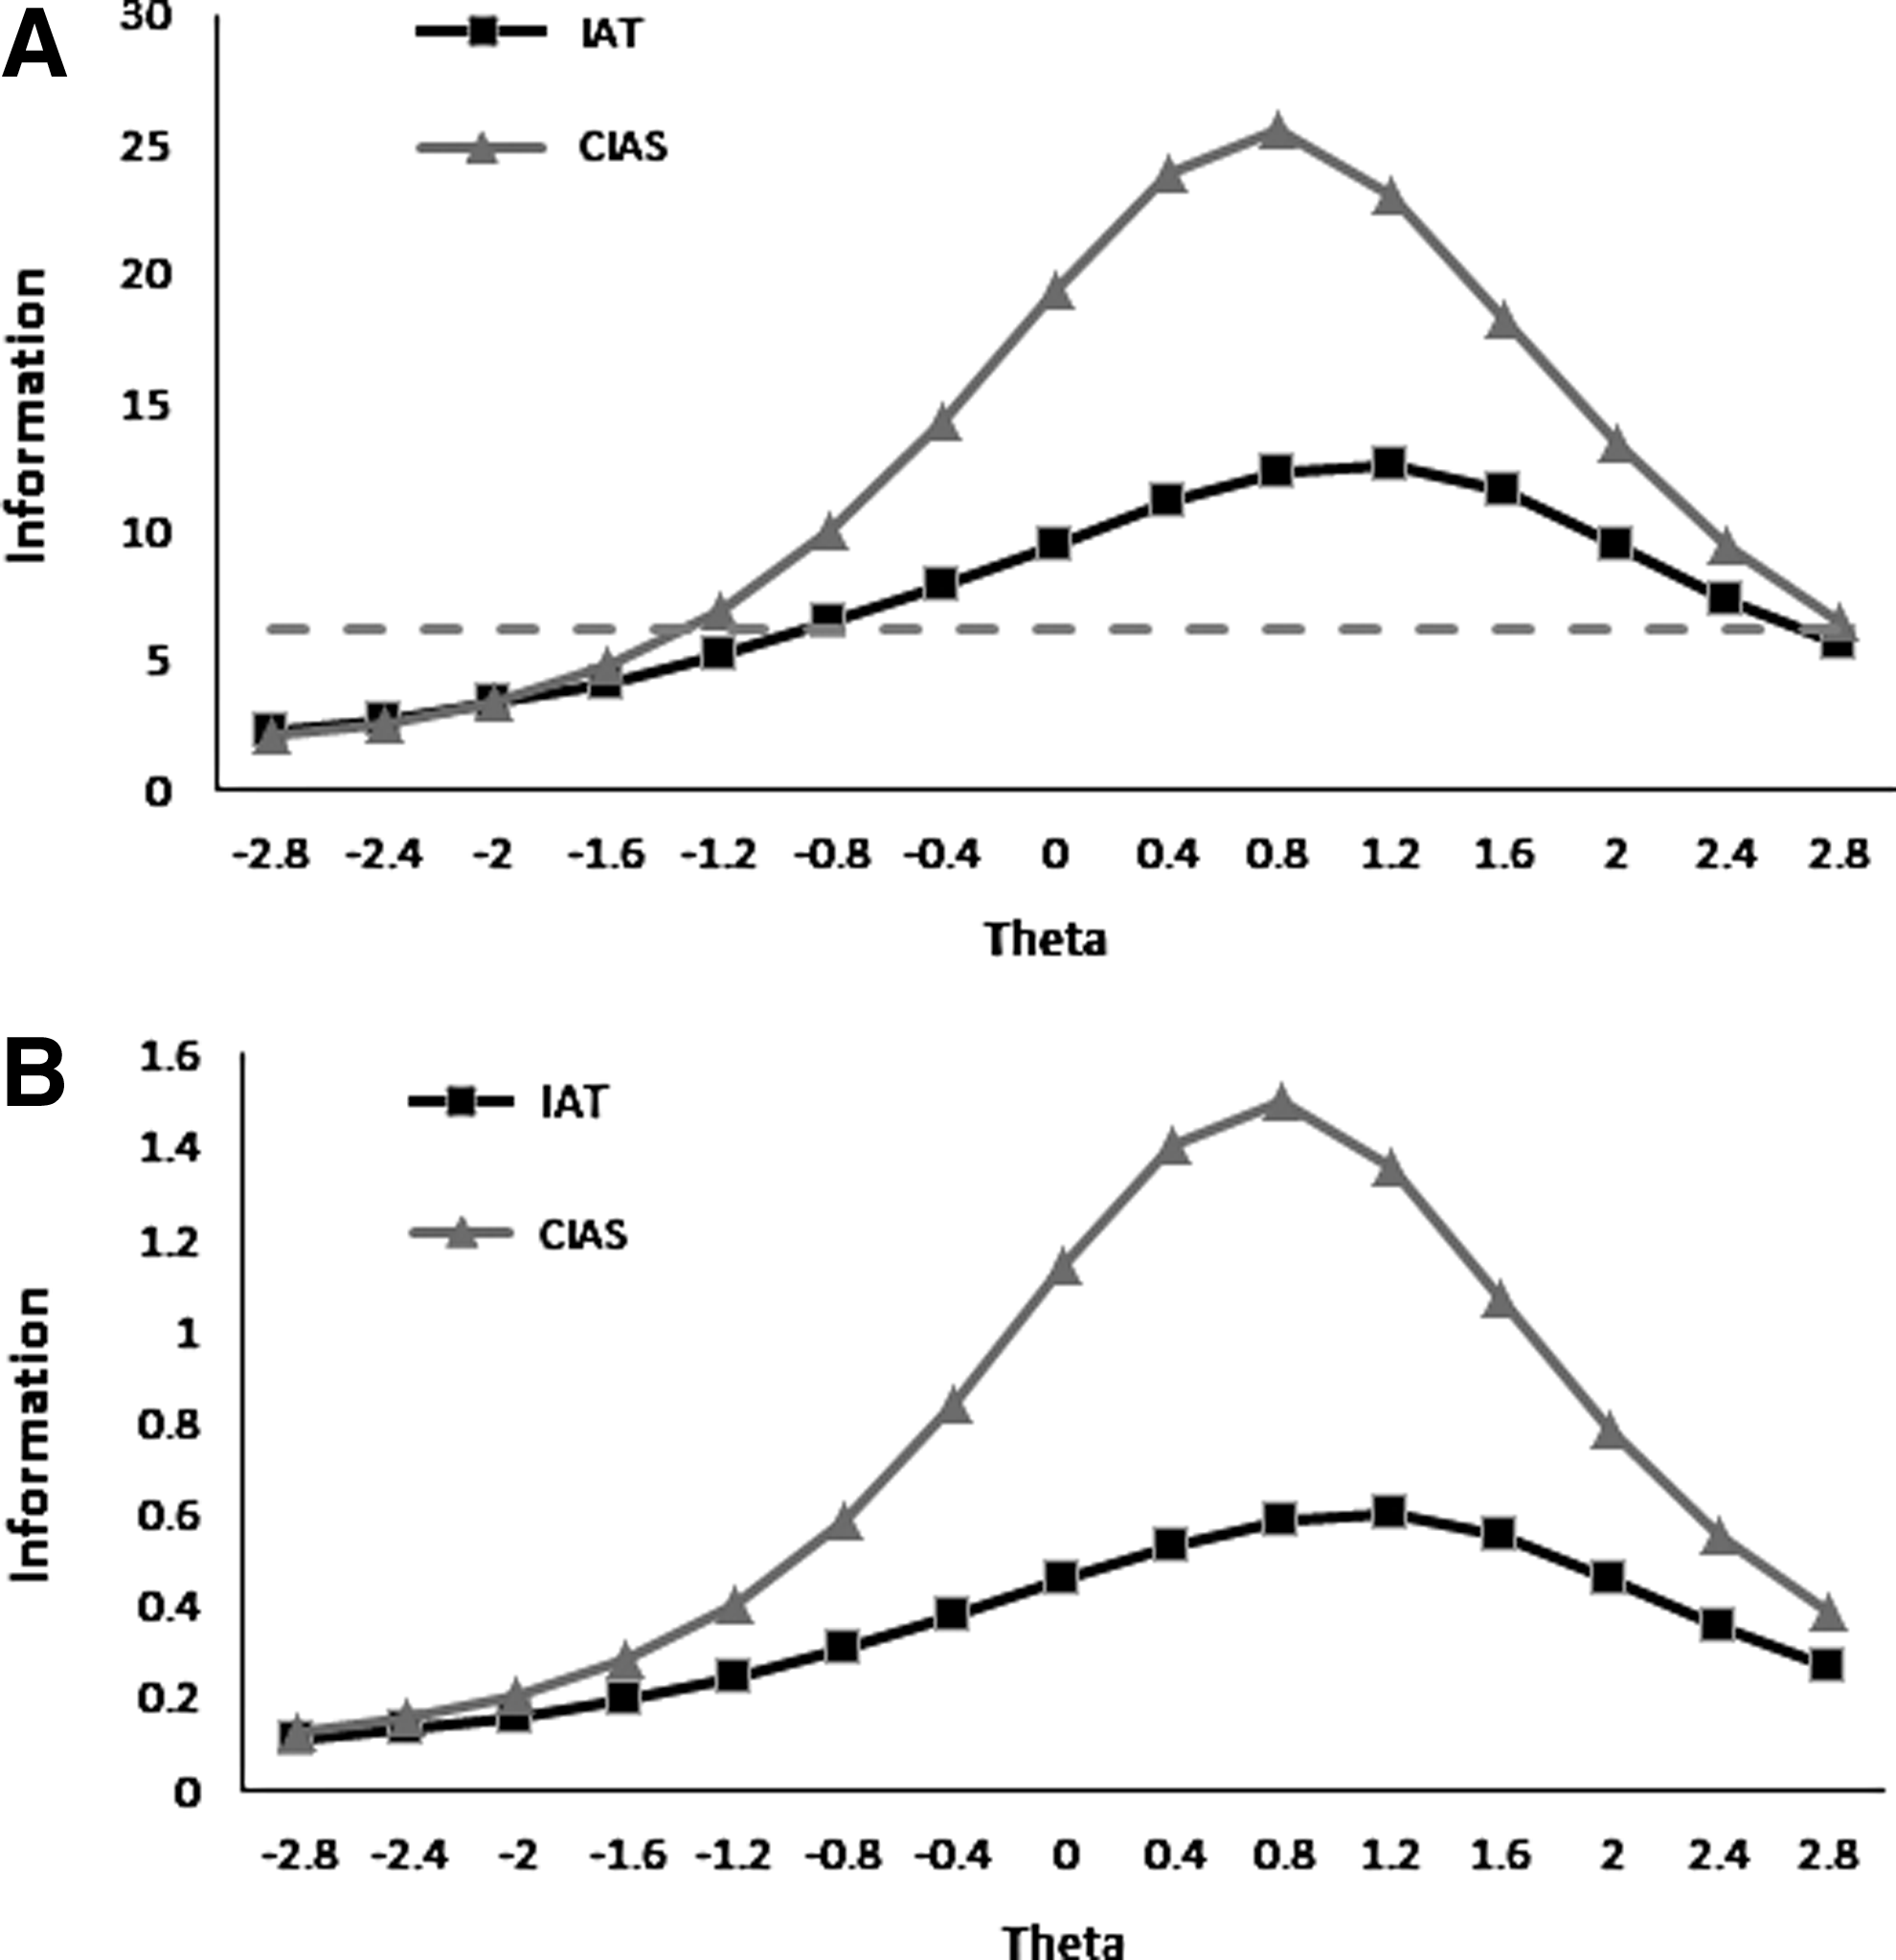
The test information curves of two scales are presented in Figure 2A. The 21-item CIAS has much larger test information than the 17-item IAT on most levels of IA. The dotted line in Figure 2A indicates test information of 6.25 and correspondingly standard errors of measurement (SEM) of 0.4 standard units. The SEM for middle and higher latent trait levels is below 0.4, which is the minimum requirement of precision for a psychological test. 31
Test item information curves
Since IAT and CIAS have different lengths, comparison was also conducted based on average item information. It can be seen in Figure 2B that the average item information for IAT is lower than CIAS throughout the whole range; and the advantage of CIAS over IAT on the upper range of the trait scale is even more prominent.
Comparison between the new scale and the old ones
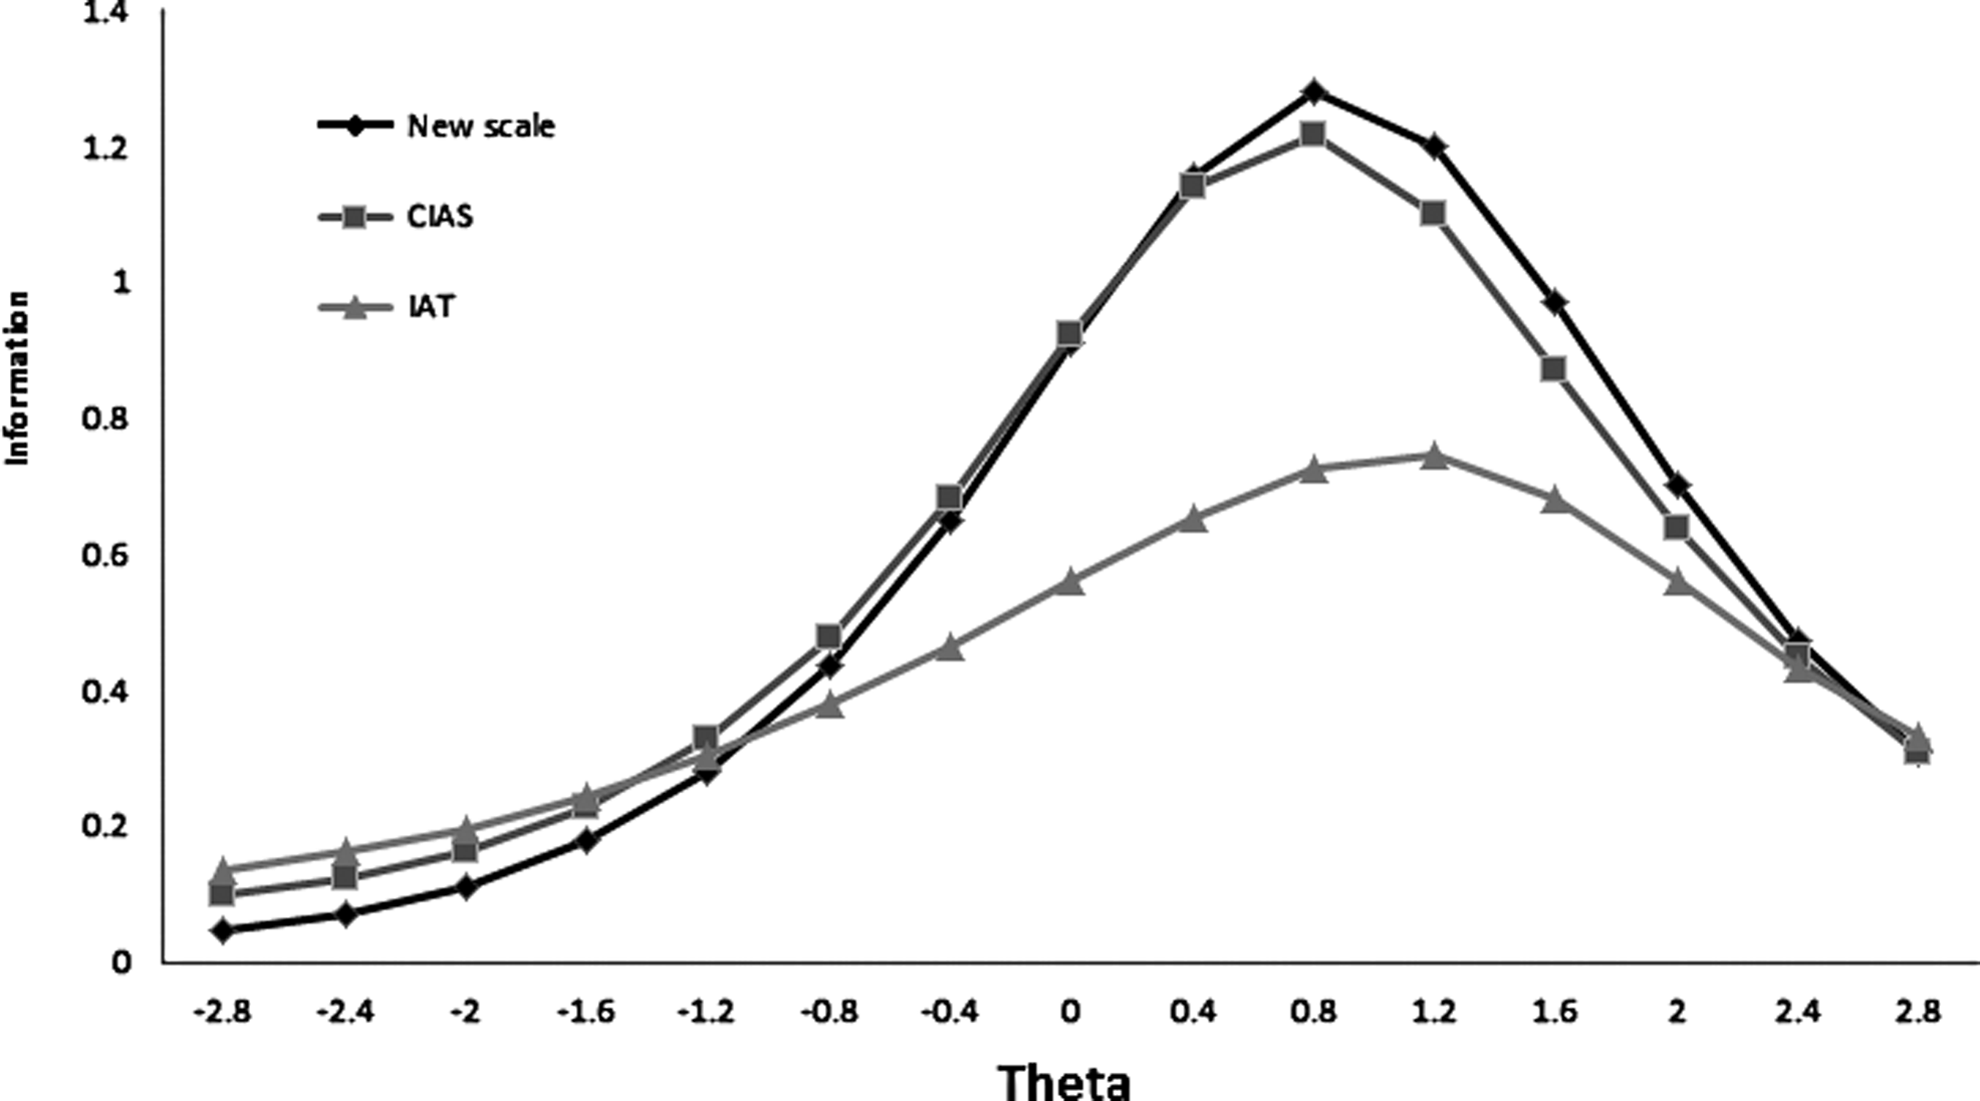
The new scale of 20 items is presented in Table 2. The average item information of the new scale is compared to those of IAT and CIAS in Figure 3. Only a little improvement can be seen around the cutoff point of 1.6. The classification consistency coefficient κ for IAT is 0.65. The new scale, as expected, has a higher κ coefficient of 0.79 indicating improved reliability for a criterion-referenced test.
Average item information curves for IAT, CIAS, and the new scale.
Discussion
Since Internet has gone through drastic changes ever since the first IA instruments were developed, renewed evidence of psychometric properties is always needed. It is necessary that the content of some items be revised before use in research. E-mail, for instance, has become an indispensable communication tool both at work and in the home. Typically, checking one's email is the first thing one does after logging on the Internet. 32 Therefore, one item from IAT which says, “Do you check your e-mail before something else that you need to do?” may now be deemed as a description of a common habit other than a disorder. While some practices become common in daily life, new behaviors are emerging, such as online social networking sites as well as e-shopping. Future researchers must continually check the relevance of the questions.
Researchers should make an informed decision about which scale to select rather than base on their own personal preference. According to the current study, CIAS outperformed IAT in terms of average item information as well as test information; so the advantage of CIAS should be attributed to its high-quality items rather than longer length. The disparity between the two instruments in terms of test information turns out quite large, but currently, the two scales have been used indifferently in many studies. Although it might be a premature conclusion to say that IAT should not be used any more, the CIAS is a more reliable instrument than the Chinese version of IAT according to the findings of this study.
In this study, an item selection approach is proposed to assemble a new scale with existing items. Using this approach, the cutoff scores and the test items become closely related. It turns out that the new scale has average item information improved only slightly because the items available in this study are very limited. With a larger item pool, this method is very likely to greatly improve test information around the cutting scores. A direct benefit of this method is increased classification consistency.
It should be noted though that the item selection approach only works if the cutting scores are valid and reasonable. The cutting scores used in this study are 50% and 80% of the total scores suggested by Young. This assignment of cutting scores appears subjective and casual. How to set valid cutting scores remains an interesting topic.
Footnotes
Author Disclosure Statement
No competing financial interests exist.