
Abstract
Abstract
Social media services such as Twitter and Facebook are virtual environments where people express their thoughts, emotions, and opinions and where they reveal themselves to their peers. We analyze a sample of 123,000 Twitter users and 25 million of their tweets to investigate the relation between the opinions and emotions that users express and their predicted psychodemographic traits. We show that the emotions that we express on online social networks reveal deep insights about ourselves. Our methodology is based on building machine learning models for inferring coarse-grained emotions and psychodemographic profiles from user-generated content. We examine several user attributes, including gender, income, political views, age, education, optimism, and life satisfaction. We correlate these predicted demographics with the emotional profiles emanating from user tweets, as captured by Ekman's emotion classification. We find that some users tend to express significantly more joy and significantly less sadness in their tweets, such as those predicted to be in a relationship, with children, or with a higher than average annual income or educational level. Users predicted to be women tend to be more opinionated, whereas those predicted to be men tend to be more neutral. Finally, users predicted to be younger and liberal tend to project more negative opinions and emotions.
We discuss the implications of our findings to online privacy concerns and self-disclosure behavior.
Introduction
P
Twitter and Facebook are prominent OSNs, used regularly by over 1/7th of the world's population. Researchers used the massive volumes of data produced by OSNs to study how users present themselves 4 and the language they use, 5 showing how to predict user psychodemographic profiles,6,7 user happiness, and well-being, 8 and performing other types of social network analysis. 9 Researchers have also studied the relation between privacy concerns and information disclosure in OSNs,10–12 noting that users are cautious about engaging in self-disclosure because they are concerned that what they share may have negative consequences, 13 highlighting privacy risks associated with information revelation in public forums. 14
Earlier work has uncovered interesting correlations between various demographic traits and the emotions that people express in many contexts. Researchers have noted relations between gender and anger,15–17 disgust and fear,18–20 and between income and emotional well-being,21,22 ethnicity, age and anger, 23 and correlations between a person's relationship status and expressions of anger. 24
OSNs differ from the offline world in ways that have a high impact on self-disclosure. First, they allow for digital communication based mostly on text and images, stored for long periods of time, and allow people to interact without being present in the same place at the same time. 25 Second, unless restrictive privacy settings are used, information from OSNs is typically disclosed to many followers in an open forum, rather than to a specific individual. 26 Third, messages can be sent at any time, giving people more control over the pace of the conversation and the impression that they have on their peers. 27 Initial results on online self-disclosure indicate that users who communicate online display a different degree of self-disclosure and that reciprocity in self-disclosure in such settings is different than in offline settings.28–31
Researchers have noted how individual differences affect self-disclosure in the offline world. There are known gender differences in self-disclosure,32–34 and personality traits such as self-monitoring are correlated with self-disclosure.35,36 The mood and the size of the audience also correlate with certain self-disclosure behaviors.37,38
One influential framework regarding self-disclosure is social penetration theory, 39 stipulating that as relationships develop, interpersonal communication shifts from superficial and nonintimate levels (breadth dimension) to deeper, more revealing, and more intimate levels (depth dimension).
Against this background work on self-disclosure and social penetration theory in the offline world, we examine the role of emotions and demographics in self-disclosure in OSNs. As opposed to earlier work on self-disclosure in OSNs, we perform a large-scale (123,000 users and 25 million messages) study on the relation between emotions and automatically inferred sociodemographic traits, using language-based statistical models to automatically infer latent user demographics40,41 in OSNs.
We first examine whether individual differences, known to affect self-disclosure behaviors in the offline world, still have similar effects in the online world. In particular, we show that various sociodemographic factors are correlated with peoples' propensity to express different emotions in OSNs.
Furthermore, we address social penetration theory in the online world. We show that by examining a person's emotional tone regarding a wide variety of topics, as expressed in their public profile, we can infer deep insights about them, including their education, income, and life satisfaction. This may indicate that people are not aware of how revealing the information they share on OSNs can be.
To the best of our knowledge, this is the first study which analyzes user communications in a social network on a large scale (25 million tweets and 123,513 user profiles), examining a range of automatically detected emotions (Ekman's six basic emotions 42 ) and a variety of demographic traits. Carrying out such an analysis requires us to use a large data set consisting of many users, described by their demographic attributes, and a large pool of text generated by each such user, annotated with the emotion or sentiment expressed in the text. Generating such a large data set is costly; it requires obtaining a large sample of social network users along with the pieces of text they produce; the users should then be tagged with their demographic attributes, which are not available or hidden due to privacy settings; finally, each piece of text should be examined to determine the emotion expressed in it.
Focusing on Twitter, we use crowdsourcing to get demographic labels for a medium size sample of U = 5,000 users and train machine learning classifiers to predict these demographic traits from the textual content generated by these users. We then use the trained classifiers to get labels for a much larger sample of U = 123,513 users. We use a similar method for labeling the emotions expressed in user text, train an emotion classifier on an initial sample of TL = 52,925 tweets, and then use the classifier to get emotion labels for a much larger sample of T = 24,919,528 tweets; however, rather than obtaining the tags for the initial sample through crowdsourcing, we use tweets annotated with emotional hashtags such as #disgust or #anger, identifying a specific emotion. To perform a reliable analysis of the differences in emotion expressed by different user groups, our demographic and emotion predictions must be highly accurate. We show that our models outperform existing state-of-the-art systems as described in the Results section. Our high-level methodology is shown in Figure 1.
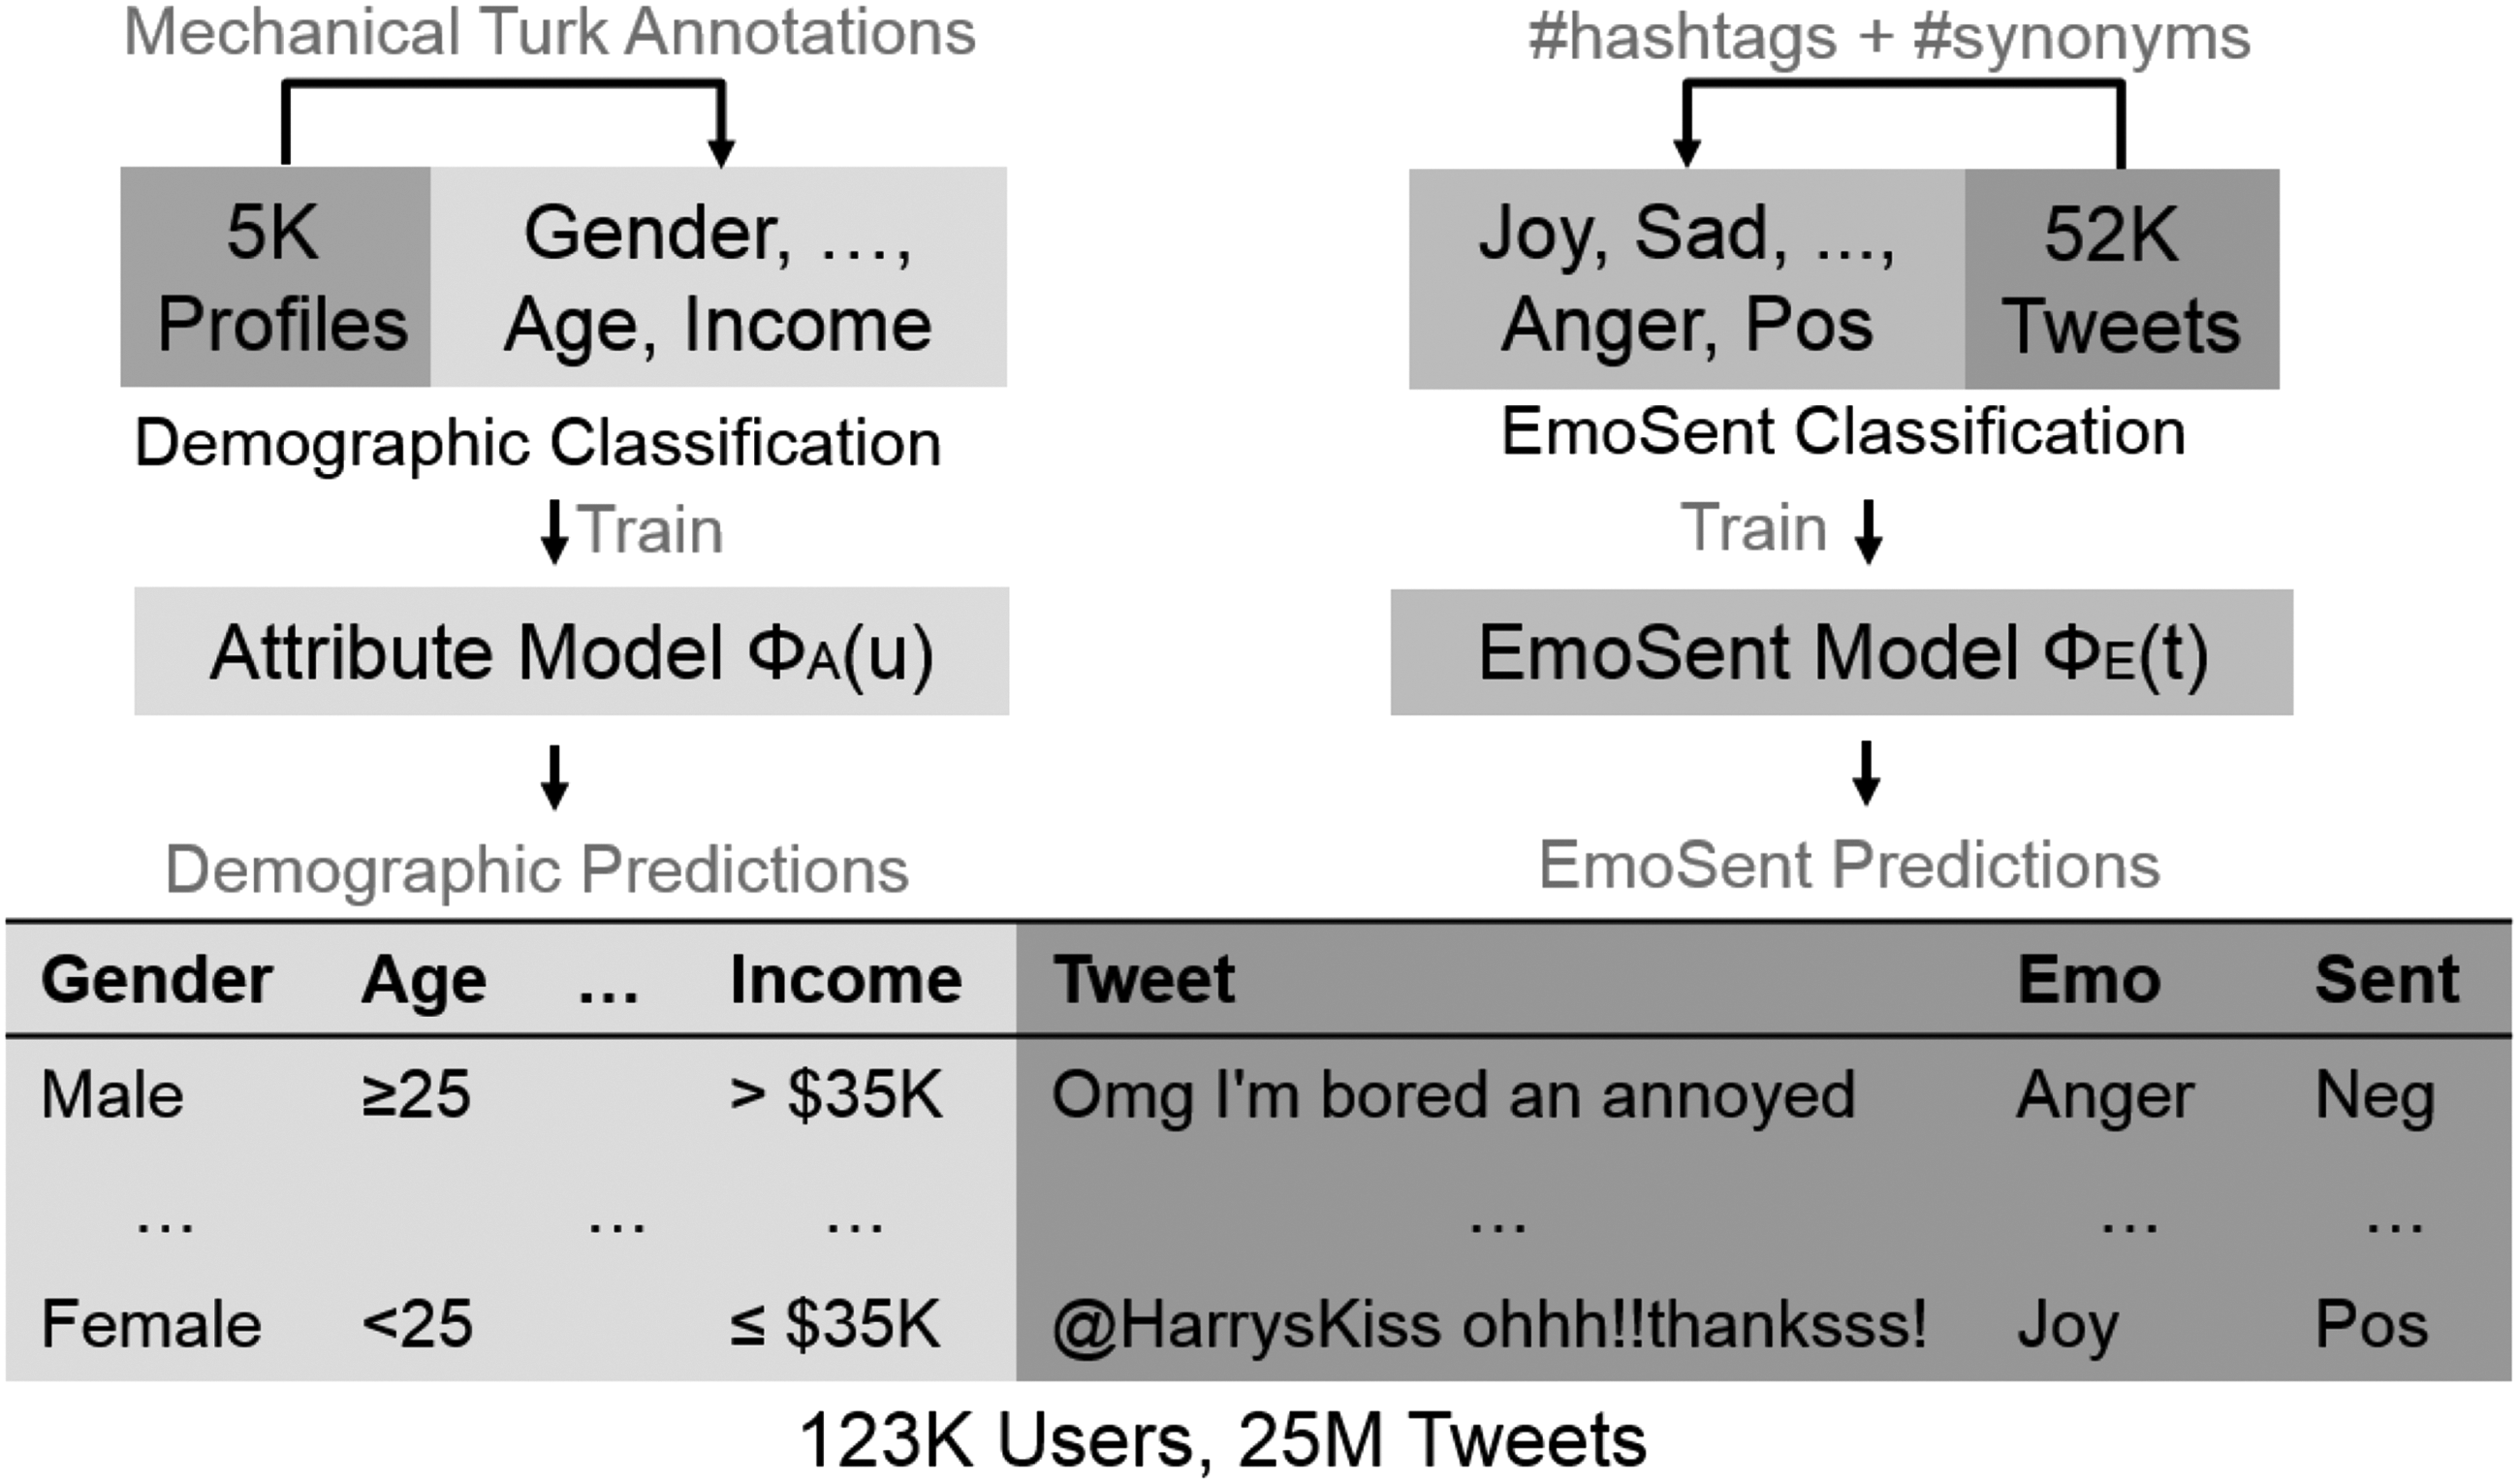
Our approach for predicting user demographics, emotions, and opinions on Twitter relies on two machine learning components. The first component is a user-level demographic classifier
The role of machine learning
We rely on machine learning methods to achieve a large-scale sample for correlating demographics and emotions. We used machine learning for two reasons. First, machine learning methods pick up many subtle hints regarding a user and aggregate them into a high-quality prediction regarding the user's profile. For example, we show that the propensity of people to use various words in OSNs is predictive of their sociodemographic traits. Although any single word in isolation does not provide us with much information, machine learning methods can use data regarding the prevalence of many such words and distill them into high-quality predictions.
The second reason is scalability. Using machine learning, we start with a moderate size data set, where people tag tweets with the emotion expressed in them, and build modules that accurately determine the emotion expressed in any tweet. This allows us to use many more tweets and profiles in our study (a sample of over 100,000 users), as processing each new tweet only requires computation, rather than human labeling effort. An alternative methodology that does not rely on machine learning is manually obtaining demographic tags and emotional tags for users, for example, by using crowdsourced workers. However, using human labor to tag specific tweets with the emotion expressed in them is extremely costly.
Practical implications and applications
Our research has several noteworthy implications to the study of self-disclosure in online settings and several practical applications.
First, with regard to self-disclosure, we note that many people make a conscious effort to project a certain image online. Our results indicate that the emotions displayed on social media are predictive of sociodemographic traits. Thus, it might be possible for people to project a desired impression by controlling the emotions they display online. This highlights the role that emotions play in self-disclosure even in the online environment. Furthermore, our results indicate that people may disclose more than they intend to, as raw information regarding emotions can be distilled into much deeper and more intimate insights. This stands in contrast to the progression of social penetration theory in offline settings, where records of emotions are not stored for long periods of time.
Second, regarding potential applications, we show that one can predict sociodemographic traits by observing the emotions expressed online. One application of such methods is advertising, as advertisers can use demographic traits to better target a desired audience. Some online advertising forms do support advertising targeted based on gender or age; however, our results show that far deeper insights can be gained in relation to demographics, such as income, education level, or family and relationship status. Furthermore, our tools enable the identification of emotions displayed on OSNs, enabling real-time healthcare analytics, such as automatically identifying patterns of depression or mental illness from OSN communications.
Materials and Methods
We now describe how we collected the Twitter sample for our analysis and how we built models for user-level (attributes) and tweet-level (emotion and sentiment) predictions. We then discuss how we evaluated emotional differences between users of different demographic types.
Sampling Twitter data
The median number of tweets produced by a random Twitter user per day is small. 41 Thus, to exclude users who tweet very often (such as bots or celebrities) or tweet only occasionally, we first estimate the user tweeting frequency from the 1 percent Twitter feed. We then randomly sample users who tweet between 4 and 10 tweets per day. Using the Twitter API (code library for accessing Twitter data), we extract data only for users who tweet (a) exclusively in English (verified by “language” field), (b) from the US and Canadian time zones (verified by “time zone” field), and (c) have at least 10 followers. We collected 10,741 user profiles with their 200 most recent tweets.
We then crawled the set of users that each target user had followed (their “friends”) using the snowball sampling strategy. 43 We randomly sample 10 friends per user, extracting their profile information and their 200 most recent tweets. Similarly, for all 10,741 users, we extracted a collection of user names that the target user has mentioned or retweeted in their most recent 200 tweets.
Thus, our random sample contains U = 123,513 users and T = 24,919,528 tweets, achieving a sample size comparable to recent large-scale studies.6,7,44
Crowdsourcing demographic annotations
We take an unconnected set of 5,000 random Twitter users and ask people sourced from Amazon's Mechanical Turk service to examine their profiles and judge their demographics. Crowdsourcing annotations is a common practice, successfully used for a variety of predictive analytics. 45 In Table 1, we present 12 demographic attributes with the corresponding values and the number of annotated profiles for each attribute value used to train the models. We also report the interannotator agreement as Cohen's Kappa measured on a random 2 percent sample of the annotated data. Although the original annotations are more fine grained, we binarize all attributes into two categories that can be easily disambiguated, such as male versus female or single versus in a relationship.
The inter-annotator agreement measured as Cohen's kappa is substantial for gender and ethnicity; fair for age, optimism, children, income, education, and life satisfaction; and slight for the most difficult attributes political, religion, intelligence, and relationship status.
Constructing emotion data set
Similar to other work that bootstraps noisy data annotated with emotions, we rely on the fact that people use hashtags such as #sadness or emoticons such as :-( to indicate that they are sad. We collected tweets from the 1 percent Twitter feed over the past 4 years with hashtags corresponding to the six emotions identified by Ekman 42 : #joy, #anger, #fear, #sadness, #disgust, and #surprise. In addition, we compile a synonym list using WordNet-Affect, Google Synonyms, and Roget's Thesaurus. We thus expand our initial emotion hashtag set to 360 emotional hashtags and collected more tweets containing them.
We exclude tweets with fewer than three words, filter out non-English tweets, remove retweets, and remove tweets where the hashtags do not appear at the end of the tweet. 46 Finally, we collect 28,656 tweets for the original six emotion hashtags and 24,269 tweets for the emotion synonym hashtags, a total of TL = 52,925 tweets annotated with emotions. We present the distribution of tweets for each emotion in Table 1. Our hashtag emotion data set is three times larger than the recently released Hashtag Emotion Corpus, 47 but smaller than a prior bootstrapped corpus. 48 Nonetheless, we show that we outperform all existing emotion prediction models in the resulting prediction accuracy.
Collecting external sentiment data sets
We use existing publicly available resources for sentiment classification on Twitter. 49 We rely on several public sentiment analysis data sets: Stanford, Sanders, SemEval-2013, JHU, SentiStrength, the Obama-McCain Debate dataset, and the HealthCare Reform dataset. In total, we aggregated TSL = 19,555 tweets labeled with positive (35 percent), negative (30 percent), and neutral (35 percent) sentiment over seven data sets.
Emotion detection in social media
Emotion analysis 50 has been applied to e-mails, blogs, and chats, but was only recently investigated for OSNs. Ekman 42 proposed an emotion classification framework capturing six high-level emotions, including joy, sadness, fear, disgust, surprise, and anger, and researchers have used supervised learning models to determine which emotions are expressed in various texts.47,48,51,52 Due to the lack of OSN data annotated with emotions and opinions, this line of work bootstraps noisy labeled data for sentiment 53 and bases emotion prediction training on hashtags. We used a similar technique to take our emotion data set and build models for automatic emotion prediction, significantly outperforming previous models.
Building classifiers for tweet-level (emotions and opinions) predictions
We assume a set of independent tweets T = {ti}. A tweet is labeled if we know the value of the sentiment function S(t): T → {positive, negative, neutral} and the emotion function E(t): T → {joy, anger, disgust, fear, surprise, sadness}.
We define two tweet-based supervised models Φ
E
(t) and Φ
S
(t) for emotion and sentiment classification, learned from the independent sets of tweets labeled with emotion
Inferring user demographics in social media
Earlier work on predicting user attributes based on Twitter data has used supervised Support Vector Machine (SVM) models with lexical bag-of-word features for classifying four demographic attributes: gender, age, political preferences, and ethnicity.56–62 Other methods characterize Twitter users by applying some network structure information.41,63–65 We focus on previously unexplored personal attributes, including relationship status, parental status (having children), religious beliefs, education level, intelligence, annual income, optimism, and life satisfaction. 62 We demonstrate that these attributes can be predicted using word unigrams, that is, linguistic features. We investigate the relation between emotions, opinions, and these different demographic attributes. Some previous work has briefly studied such correlations on Twitter such as the relation between gender and sentiment66,67 and personality and emotions. 40
Building classifiers for user-level (psychodemographics) predictions
We assume a set of independent users U. A user
We define 12 user-based supervised models
Measuring user emotions
Given a set of tweets T(u) with predicted emotions, we estimate the proportion or normalized frequency of each emotion e per user. An example of the emotion distribution for a random Twitter user is shown in Figure 2.

Emotion and sentiment distributions for a random Twitter user. Distributions are the proportions of six predicted emotions or three sentiments aggregated over 200 tweets for per user.
Given the normalized distribution of emotions for each user, we estimate the user's positive emotion score
We exclude the “surprise” emotion from the
Measuring user sentiment
We estimate the proportion or normalized frequency of sentiment expressed by each user. The example sentiment distribution for a random user is shown in Figure 2. Given the proportion of sentiment per user, we estimate the user's positive sentiment score
We exclude neutral sentiment from
Estimating emotion and opinion differences
We first evaluate whether Twitter users of contrasting attribute values (e.g.,
We then quantitatively measure emotion and opinion differences between a0 and a1 users. For that we estimate the average scores for emotions and opinions for the populations a0 and a1:
Experimental Setup and Results
Our experiment consists of three stages: (a) building emotion, sentiment, and personal attribute classifiers to predict 12 attributes for 123,000 users and label their 25 million tweets with emotions, for example, joy, sadness, anger, disgust, surprise, or fear and sentiment, for example, positive, negative, or neutral; (b) studying diversities between users of different demographic types and the emotions and sentiment they express; (c) measuring the strength of the correlation between demographics and emotions by fitting a regression model to infer demographic attributes from emotions and opinions.
Our classifiers are the log-linear models
Predicting user emotions, sentiment, and demographics from tweets
For the opinion and emotion classification we train the • Lexical: binary unigram bag-of-word features (using higher order ngrams or normalized frequency count features does not improve classification results). • Stylistic: elongated words, for example, Yaaay, noooo; capitalization, for example, COOL, MAD; positive and negative emoticons; punctuation, for example,!!!!,????; and number of hashtags. • Negation: append a _NEG suffix to every word appearing between a negation and a clause-level punctuation mark.
70
• Lexicon: presence and score for unigram features from the Emotion Lexicon.
71
• POSTags: part-of-speech tags obtained using Twitter POS tagger.
72
Table 2 presents emotion classification results obtained using lexical, stylistic, and negation features (using lexicon and part-of-speech tag features does not improve performance). We compare our models to the results reported by Mohammad
47
and Wang.
48
Compared to Mohammad, our emotion predictors yield a significantly higher performance for all emotions when trained on our and their combined data, using a 10-fold cross-validation
We train our sentiment classifier using the same features we used for our emotion classifier. We train our model on 19,555 tweets and test on the 3,223 tweets from the official SemEval-2013 test set. Our sentiment classifier yields F1 = 0.66 (three classes) that is comparable to the top ranked system in the SemEval-2013 official ranking 73 (F1 = 0.69) and the current state-of-the-art system that uses other advanced features 71 (F1 = 0.70).
For personal attribute prediction from tweets, we rely on binary word unigram features. Figure 3 presents classification results in terms of area under the receiver operating characteristic (ROC) for the 12 attributes outlined in Table 1. Our results for gender and ethnicity prediction demonstrate a significantly higher performance compared to previous work.56,57,63,74 In Figure 4, we present the most predictive lexical markers learned by the classifier for income and relationship status attributes.
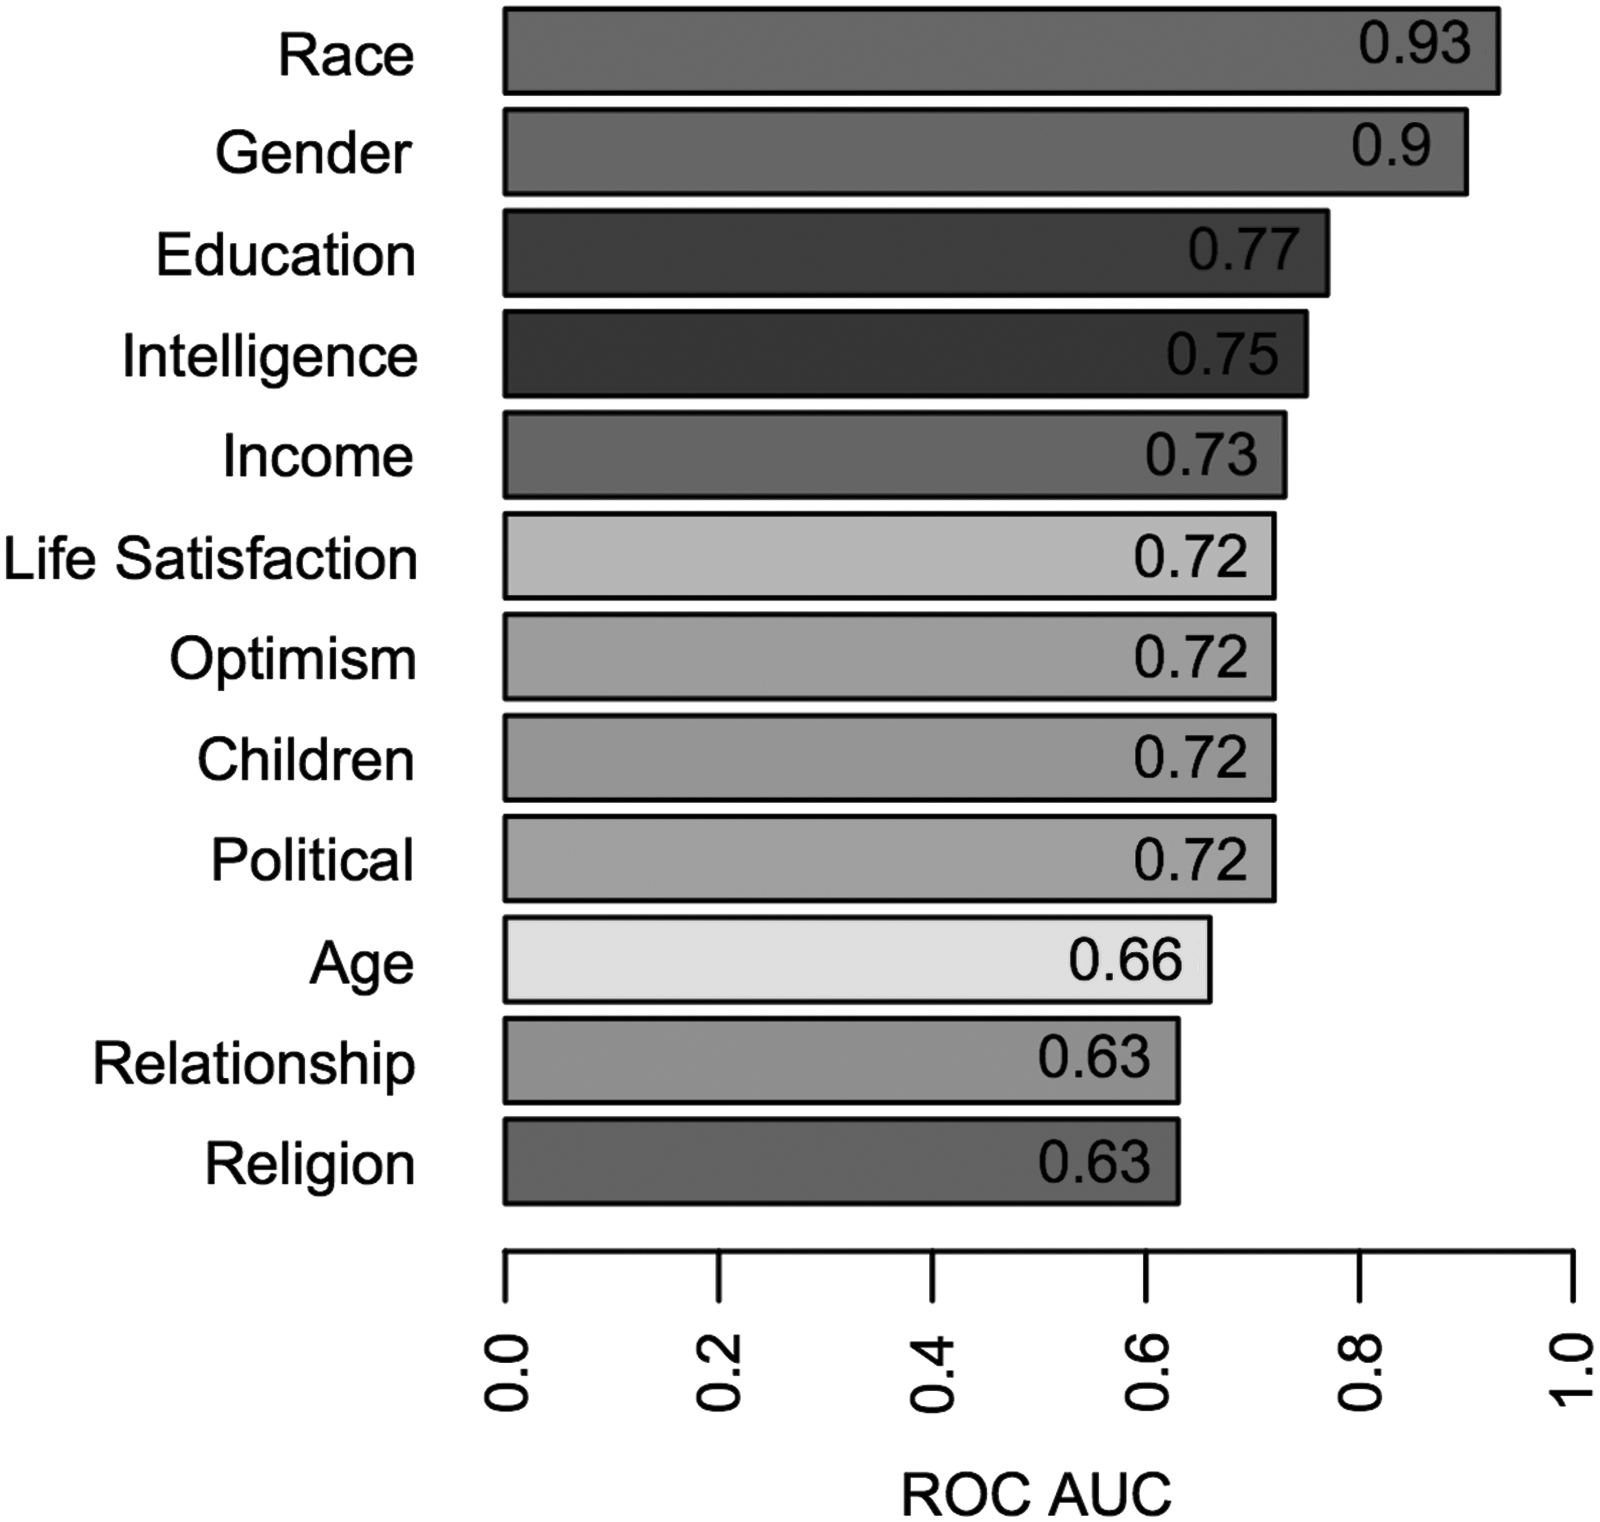
Demographics attribute classification performance in terms of the area under the ROC (ROC AUC is equivalent to probability of correctly classifying two randomly selected users, one from each class, e.g., single vs. in a relationship). Models are learned using binary word unigram features from 5,000 Twitter user profiles annotated through crowdsourcing. Evaluations are performed using 10-fold cross-validation.
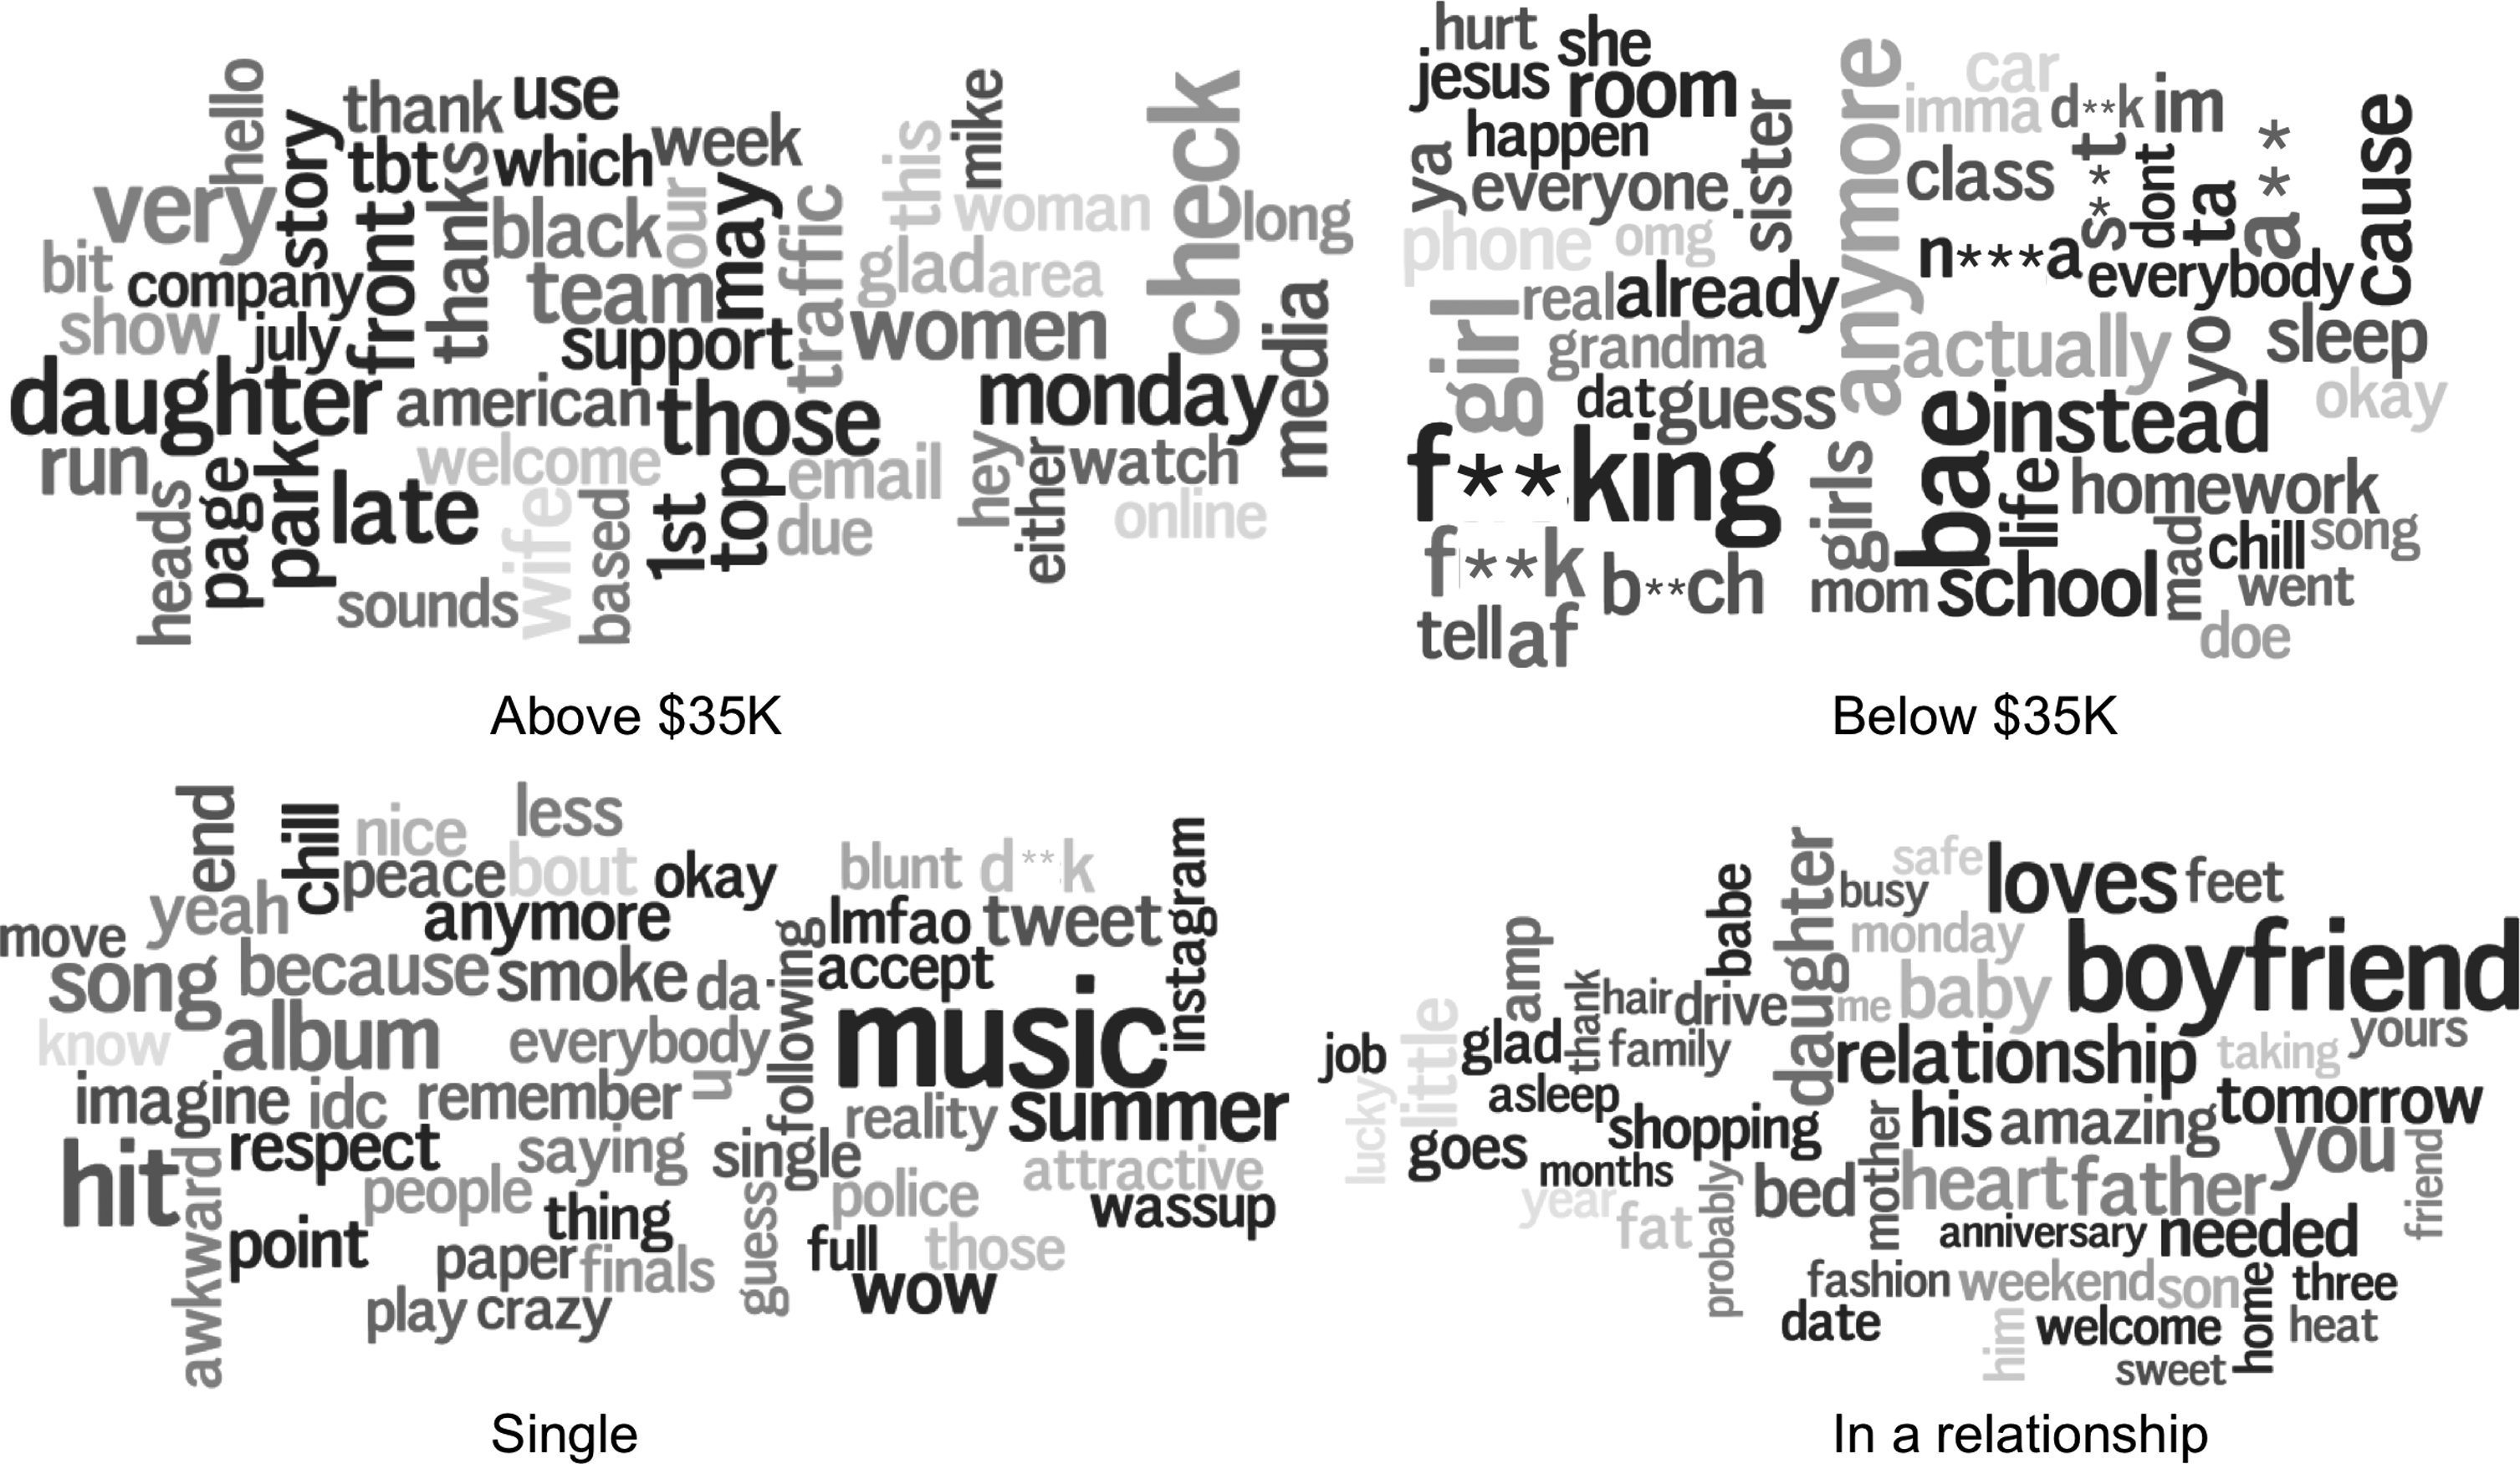
Predictive lexical markers (“features”) learned by the classifier for discriminating users with annual income below $35K versus users with above $35K and single users versus users in a relationship.
Analyzing emotion and opinion differences for contrastive demographics
We now analyze emotional differences between users with contrasting attributes (denoted a0 and a1) and present the results in Figure 5. We present opinion differences in Table 3. Our key findings are discussed in detail below. All the differences in emotion and opinions for groups of users with contractive demographics are statistically significantly different (p-value < 0.001, using the Mann-Whitney U test).
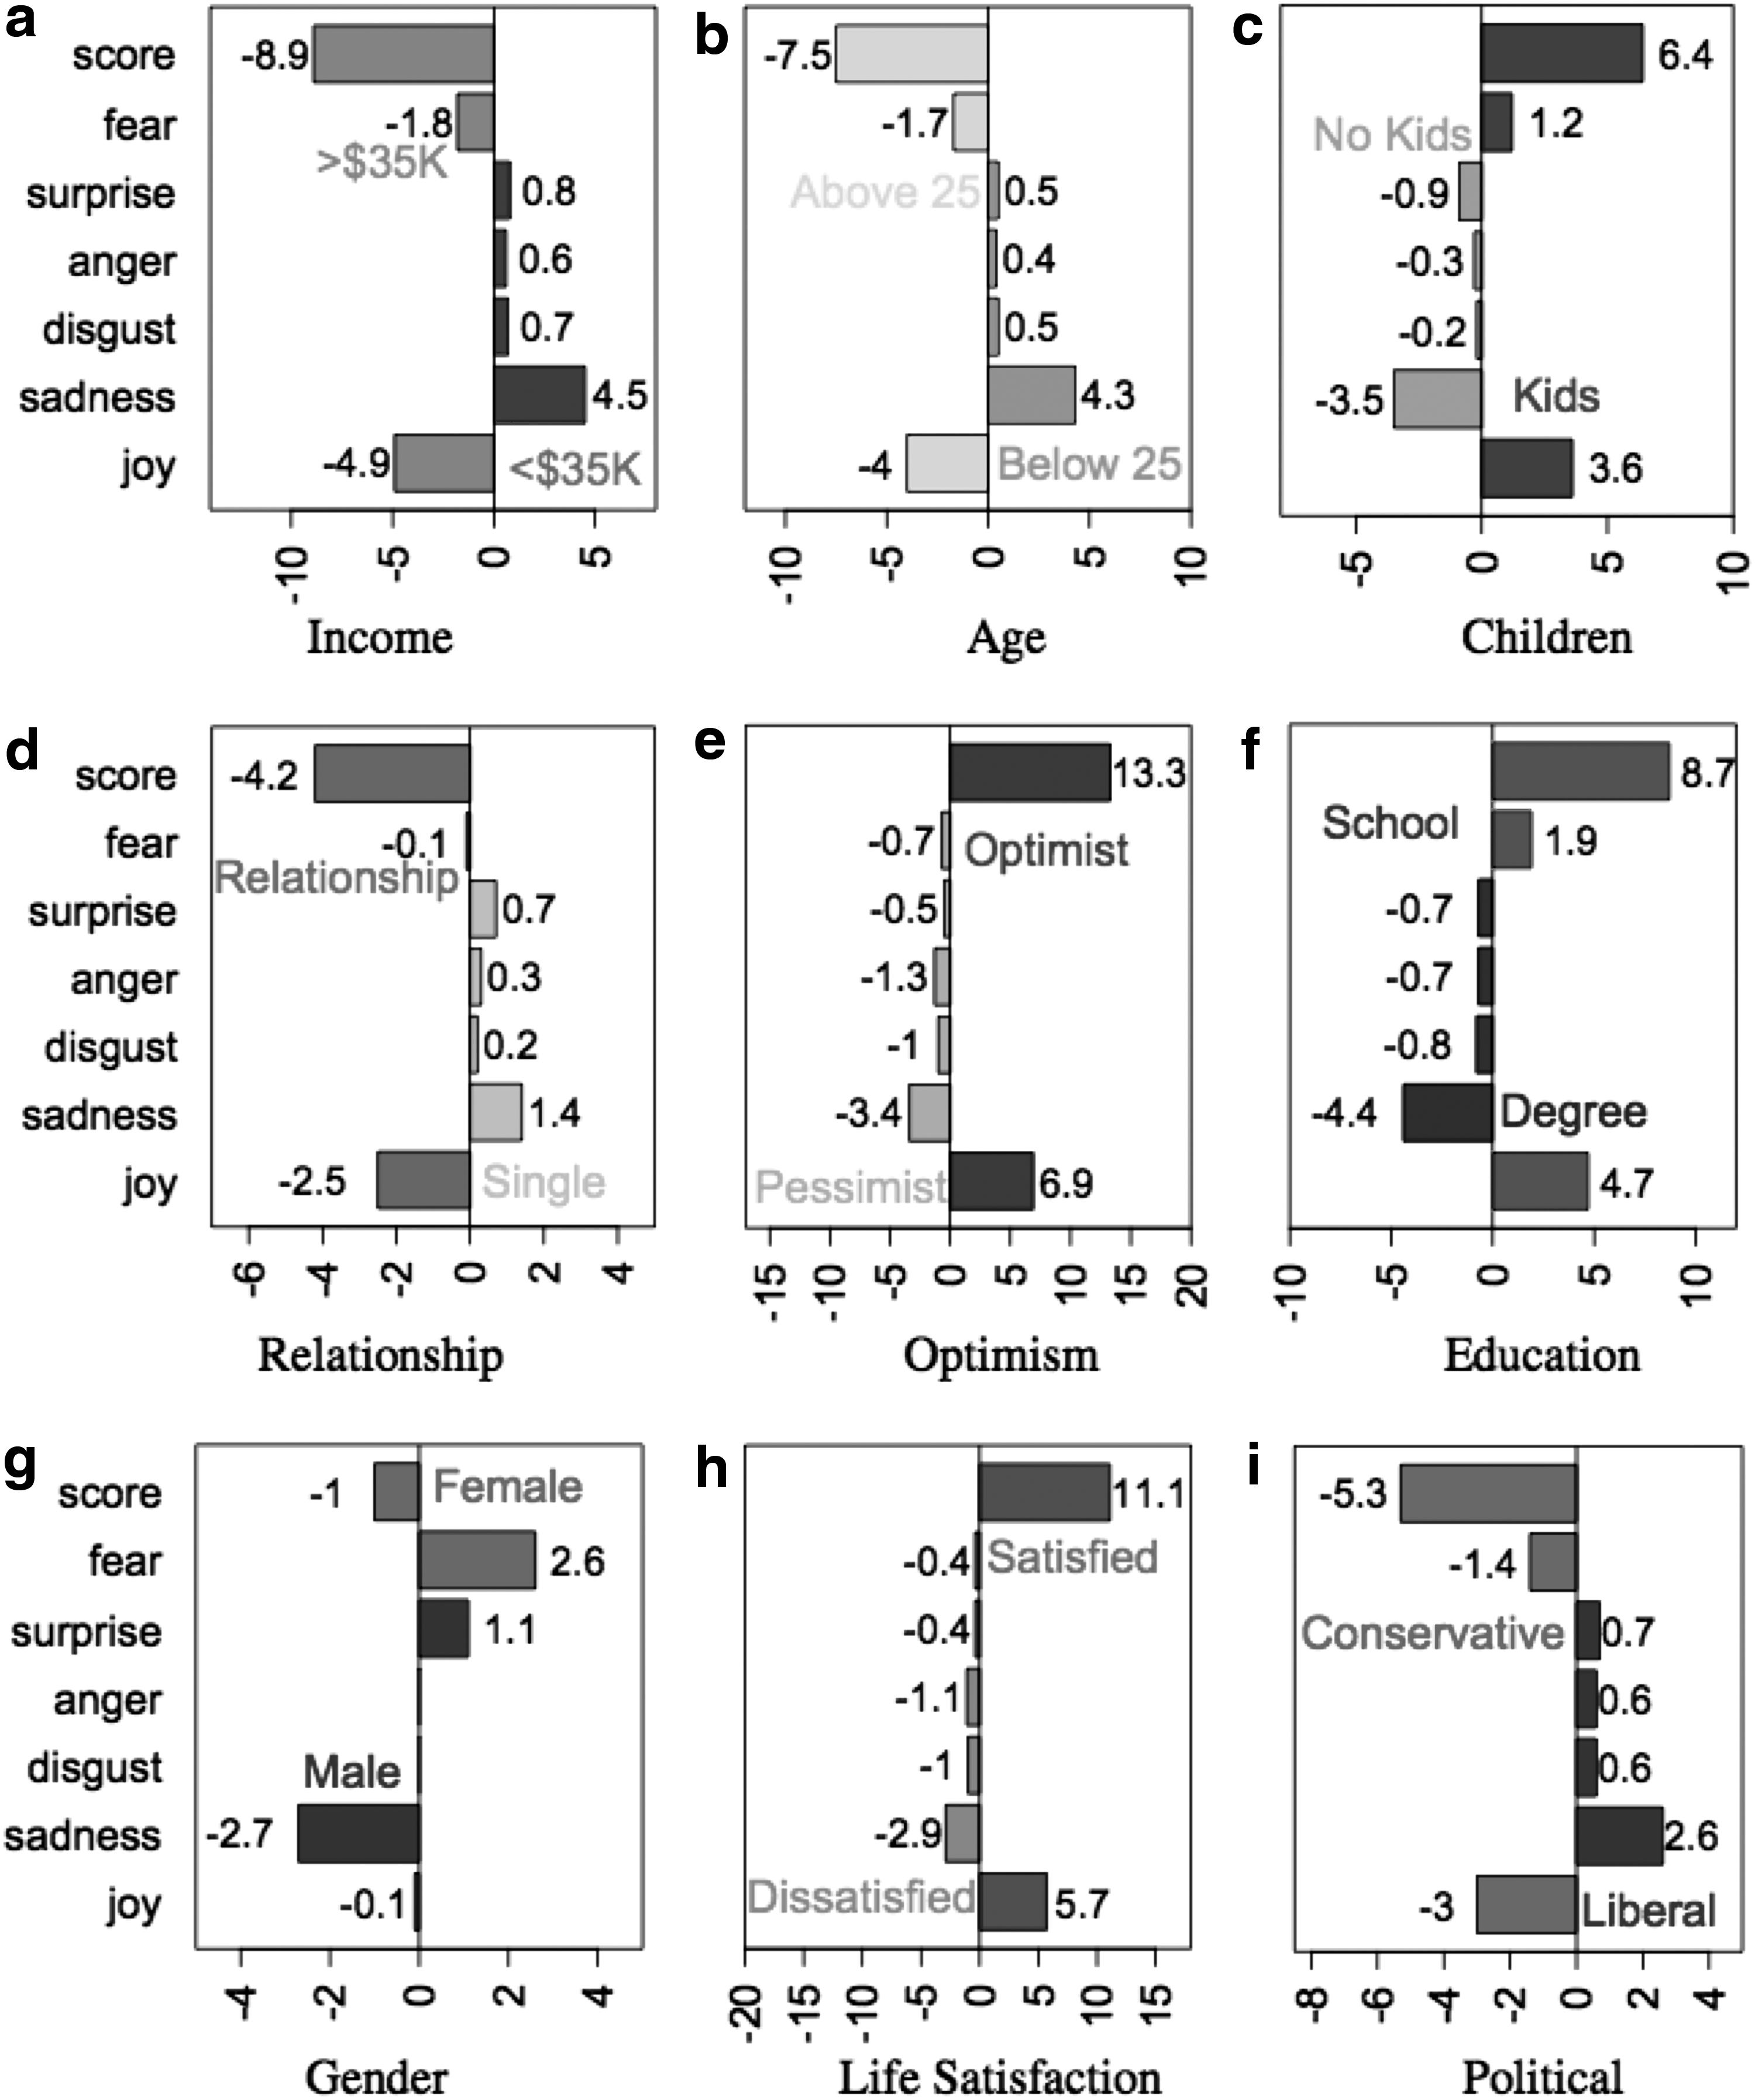
Emotion differences
S+ stands in differences in positive sentiment score as defined in Eq. 4. The most pronounced differences are highlighted in bold.
For brevity, we refer to a user predicted to be male simply as a male and a tweet predicted to contain surprise as simply containing surprise. However, it is important to recall that a major contribution of this work is that these results are based on automatically predicted properties, compared to ground truth. We argue that while such automatically predicted annotations may not be perfect at the individual user level or the tweet level (as shown using the receiver operating characteristic area under the curve (ROC AUC) in Fig. 3), they provide for meaningful analysis when reviewed on aggregate.
• Gender: Female users generate more happy and sad tweets, while male users produce more surprise and fear tweets. Female users have higher positive emotion scores. In line with previous work, our results further confirm that female users are more emotional online.66,67
• Age: Older (over 25 years old) users are 7.5 percent more positive and generate 4 percent more joyful tweets and 4 percent fewer sad tweets. Younger users produce more disgust, anger, and surprise tweets. Our results are in line with the recently explored “aging positivity effect” in social media that states that older people are happier than younger people. 75
• Relationship status: Users in a relationship produce 4 percent more positive emotions and generate 2.5 percent more joyful tweets and 1.4 percent fewer sad tweets compared to single users. Single users produce more surprise, anger, and disgust tweets.
• Children: Users without children produce 3.5 percent more sad tweets and 3.6 percent fewer joyful tweets. Users with children have higher positive emotion scores (by 6.4 percent). They produce less disgust, anger, and surprise tweets but more fearful tweets.
• Education: Users with a college degree produce 4.7 percent more joyful tweets and have higher positive emotion scores (by 8.7 percent). In contrast, users with only high school education generate 4.4 percent more sad, disgust, and angry tweets.
• Political preferences: Conservative users produce 3 percent more joyful tweets and 1.8 percent more fearful tweets. Liberal users generate 2.6 percent more sad tweets and have a 7 percent lower positive emotion score.
• Income: Users with higher income (above $35K) generate 4.9 percent more joyful tweets and have a higher positivity score (by 8.9 percent). Users with a lower income tweet 4.5 percent more sad tweets and roughly 1 percent more angry and disgusted tweets.
• Intelligence: Users with above average intelligence generate 3.9 percent more joyful tweets and 3.7 percent fewer sad tweets. In contrast, users with average or below average intelligence have a lower positive emotion score (by 7.1 percent).
• Ethnicity: Caucasian users produce 4.2 percent more joyful tweets and have a higher positive emotion score (by 7.5 percent). African American users generate 2 percent more sad tweets, 1 percent more disgusted and surprised tweets, and roughly 1 percent more fearful and angry tweets.
• Religion: Christian users produce more joyful tweets and have a higher positive emotion score compared to unaffiliated users who produce more disgusted and angry tweets.
• Optimism: Optimists produce 7 percent more joyful tweets and have a higher positive emotion score (by 13 percent) compared with pessimists, who generate 3.4 percent more sad tweets and roughly 1 percent more angry and disgusted tweets.
• Life Satisfaction: Users satisfied with life produce 6 percent more joyful and 3 percent fewer sad tweets and have a higher positive emotion score (by 11 percent).
Sentiment divergence results appear in Table 3, demonstrating that several user groups produce significantly more positive opinions than their contrasting group: women, those older than 25 years, users in a relationship, users with children, users with a degree, users earning more than $35,000 a year, conservative users, users with above average intelligence, and Caucasian and Christian users.
We have also examined differences in social media activity between demographic groups using a random sample of 10,500 users from our data set. The average number of daily tweets (DT) for men is DT = 0.54 and for women is DT = 0.58. This is a statistically significant difference (p < 0.001, using a Mann-Whitney U test). Our findings are consistent with other work stating that women generate more content in social networks such as Facebook. 76 However, we did not find significant differences in the quantity of user generated content between younger and older users as has been previously reported for Facebook.76,77
We also found that users predicted to be liberal are more active on Twitter (DT = 0.58) than conservative users (TD = 0.48) and the users predicted to be Caucasian are less active (DT = 0.50) than African American users (DT = 0.70). 76
Inferring user demographics exclusively from emotions and opinions
Figure 6 presents demographic classification results using only emotion and opinion distributions as features. We show that some emotions and opinions are predictive of one attribute value (red), some of an opposite value (blue). For instance, negative sentiment and sadness are predictive of users with no children and users less than 25 years old; angry tweets are predictive of non-Christian users; finally, surprised tweets are predictive of single users. We show a dendrogram for attributes (rows) and emotions (columns), grouping data based on row and column similarities using a hierarchical clustering algorithm.

Predicting hidden attributes from user emotions and opinions. Colors represent regression coefficients for each feature, for example, white stands for male, satisfied, optimist, single, nonreligious, liberal, no kids, below 25 years old, over $35K, Caucasian, college degree, above average intelligence and black for opposite attributes values.
Finally, we compare the predictive performance of models using emotions and opinions versus models using lexical features only. We observe that some attributes are more linguistically expressed and, therefore, are better predicted using lexical features, including gender (−0.16), ethnicity (−0.19), relationship status (−0.05), having children (−0.04), political beliefs (−0.05), and religion (−0.05). However, some attributes are better predicted from emotions and opinions extracted from tweets, including age (+0.9), income (+0.05), education (+0.02), optimism (+0.06), and life satisfaction (+0.06).
Discussion and Conclusions
We demonstrated that users of different demographic types project different emotions in social media.
Some of our results are stereotypical and are similar to known correlations in offline environments. For example: (a) users with high income produce significantly less sad tweets and users with lower income express more negative emotions;21,22,8 (b) female users are more emotional and opinionated than male users40,41; (c) older users express more joy and less sadness than younger users 78 ; (d) optimism and life satisfaction correlate with positive emotions79,80; and (e) people in a relationship or who have children express more positive emotions. 81
Our results highlight a key difference between OSNs and offline environments with regard to self-disclosure: OSNs keep track of our thoughts and emotions for long periods of time, making it possible to easily infer deep and intimate knowledge about us. Thus, people using OSNs may reveal more about themselves than they intended. 82 Despite these unintended self-disclosure and privacy concerns, our results also indicate various applications of our emotions and demographic data mining.83
Footnotes
Author Disclosure Statement
No competing financial interests exist.