
Abstract
Abstract
“Digital natives” concept defines young adults particularly familiar with emerging technologies such as computers, smartphones, or Internet. This notion is still controversial and so far, the primary identifying criterion was to consider their date of birth. However, literature highlighted the need to describe specific characteristics. The purpose of this research was to evaluate the factor structure of a French version of the Digital Natives Assessment Scale (DNAS). The sample of this study includes 590 participants from a 6-week massive open online course and from Web sites, electronic forums, and social networks. The DNAS was translated in French and then back-translated to English. A principal component analysis with orthogonal rotation followed by a confirmatory factorial analysis showed that a 15-item four-correlated component model provided the best fit for the data of our sample. Factor structure of this French-translated version of the DNAS was rather similar than those found in earlier studies. This study provides evidence of the DNAS robustness through cross-cultural and cross-generational validation. The French version of the DNAS appears to be appropriate as a quick and effective questionnaire to assess digital natives. More studies are needed to better define further features of this particular group.
Introduction
D
Since that time, existence of digital natives was particularly discussed in the literature. In this debate, lack of sound empirical evidence emerged as a major issue. 3–8 Some researchers argue that all digital natives do not share the same level of competencies and knowledge about technologies. They may differ according to habits and access to technologies.2,4–6,9–14 Even if one grows up with opportunities to use digital media, it does not mean that one will actually take advantage of this favorable context and use them. About this fact, Kennedy and collaborators stated that digital natives are comparable to people speaking several dialects. 11 Furthermore, literature includes a set of relatively similar, but interchangeably used labels: digital natives, generation Y, Net generation, and millennials. Watson proposed the term digital tribes as technology uses may be radically different with regard to numerous factors: countries, sociocultural environment, education, family context, and so on. 7 Last, Prensky himself changed his stance and spoke of a digital wisdom born from technology utilization and which will drive its reasoned use. 15
Although critics remain to challenge this concept, many authors agreed that digital natives have advanced knowledge and abilities on emerging technologies. They share a unique relationship with these media, with significant consequences on their everyday life and even, for example, their cognitive processes (e.g., information processing, memory, attention, decision-making, and so on).2,15,16 More than a revolution, one may, however, prefer thinking of an evolution. Nowadays, young people may learn and function differently, but not so far from their older counterparts. 4 Some authors stand for a digital competence that everyone can acquire and develop through lifetime. 10
Existing literature on digital natives echoes the variety of emerging technologies uses in young people, as well as their benefits and risks. 5 Research pointed specific risks faced by digital natives: higher inclination to engage in risky behaviors, to be unable to regulate their technology utilization, lesser efficiency of learning strategies when faced with diversity in content and sources, and loss of critical thinking.2,17,18 However, other studies highlighted that children, adolescents, and young adults keep a noticeable critical thinking on their technology uses.19–22 Other authors documented changes introduced by new media emergence on individuals, on their self-image, or on relationships to objects or people.23,24
Joiner et al. sought differences in attitudes and Internet utilization between first (i.e., born between 1980 and 1993) and second generation (i.e., born after 1993) of digital natives. 25 They noticed that second-generation members were more frequently committed in online activities, especially recreational activities. Other studies compared digital natives to digital immigrants, or even to older generations (i.e., baby boomers born between 1946 and 1964), looking into significant differences in digital technology adoption.18,25–29
However, identification of digital natives remains at stake. So far, the main criterion was to consider the date of birth, with individuals born after 1980 being digital natives.1,6,30 Later on, a second generation of digital natives was designated with Web 2.0 arrival in the second half of the 1990s.6,25 However, some authors stated that age is not a sufficient criterion. Of course, if many digital natives are young, all young people are not digital natives. Moreover, many individuals born before 1980 have integrated digital technology in their life to the extent they became as familiar if not more with it than youth. 6 Factors like gender, education, technology experience (i.e., years of practice and age of first exposition), and habits have to be taken into account.6,8,24,31
To that end, Teo 32 designed a scale to assess digital natives' dimensions: the Digital Natives Assessment Scale (DNAS). Several adaptations of this scale already exist in other languages, but not in French.33,34 This questionnaire includes characteristics likely to represent digital natives. Given the extent of the digital natives in our society, and especially in France, it is interesting to efficiently assess characteristics of these digital natives. Therefore, the aim of this study is to assess the factorial structure of a French-translated version of the DNAS.
Materials and Methods
Setting
This study was associated to a 6-week massive open online course (MOOC) held by the University of Nantes during the first semester 2015. Main thematic of this course was related to digital use and its consequences on individuals. Beside this MOOC, a research protocol was conceived and declared to the National Commission on Informatics and Freedoms (declaration no. 1803694, October 21, 2014). MOOC's subscribers were invited to take part in this project. Participants had to give their consent on the first page of the dedicated online formulary designed for the assessment through LimeSurvey. Moreover, additional recruitments were organized on several Web sites and electronic forums focusing on digital media (e.g.,
Participants
We received answers from 828 participants. However, we chose to only include participants who at least fully filled sociodemographic and DNAS-related questions (i.e., the first two parts of the formulary). Therefore, the final sample includes 590 participants (71.25 percent of all respondents), with 62.7 percent of women. Participants are mainly students (48.6 percent) aged between 19 and 29 years (58.8 percent), single (49.8 percent), and without children (77.1 percent). Full sociodemographic details of the sample are available in Table 1.
Digital Natives Assessment Scale
The DNAS is a self-assessment tool designed to measure whether an individual may be considered a digital native. Validation of the scale highlighted a 4-factor structure with 21 items. Those factors are as follows: grow up with technology (five items, Cronbach's α = 0.89), comfortable with multitasking (six items, Cronbach's α = 0.91), reliant of graphics for communication (five items, Cronbach's α = 0.87), and thrive on instant gratifications and rewards (five items, Cronbach's α = 0.87). Answers are made on a seven-point Likert scale, from 1 = strongly disagree to 7 = strongly agree. Total score ranges from 21 to 147, with higher score indicating a higher likelihood to be a digital native.
Given that this questionnaire does not exist in French, we sought original author's approval before translating the scale in French. The DNAS was translated by the main author and then reviewed by the second, both with good knowledge of English. Iterations were discussed as long as there was not an agreement between both authors. A common version was then revised by an external bilingual person and was back-translated in English.
Statistical analysis
To increase confidence in the results and as we could not cross-validate results with two independent samples, we chose to randomly split the sample in half. The first subsample (n = 297) was used for the exploratory analysis and the second (n = 293) for the confirmatory analysis. Exploration of the factor structure of the questionnaire included a principal component analysis (PCA) with orthogonal, varimax rotation, according to analysis initially done by Teo. 32 To determine the number of components to extract, the Kaiser rule of selecting eigenvalues greater than 1, the scree test, and parallel analysis were used.35,36 A confirmatory factor analysis (CFA) was then undertaken on the model derived from the exploratory analysis. Quality of the model, as well as comparison between potential models, was assessed with various indices.37,38
Results
Principal component analysis
We ran a PCA on the 21-item French version of the DNAS with orthogonal rotation (varimax). The Kaiser-Meyer-Olkin (KMO) was equal to 0.84, indicating a great sampling adequacy for the analysis. Moreover, all KMO values for individual items were superior to 0.73, above the acceptable limit of 0.5. 39 Bartlett's test of sphericity [χ2(210) = 1,865.01, p < 0.001] meant that correlations between items were sufficiently large for PCA. During the analysis, four components had eigenvalues over Kaiser's criterion of 1 (component 1 = 5.28, component 2 = 2.49, component 3 = 1.78, and component 4 = 1.38) and explained in combination 52.07 percent of the variance. As both scree test and parallel analysis suggested a clear four-component solution, we extracted four components.
Table 2 shows original and translated item labels from the DNAS as well as factor loadings after rotation. To be part of a component, an item had to have a cross loading ≥0.4, with minimal to no cross loadings with other factors.39,40 All factor loadings, but one (i.e., item 15), met these criteria. We removed this item from the final solution. Therefore, component 1 includes items 1, 3, 7, 11, and 19; component 2, items 2, 6, 10, 14, and 18; component 3, items 4, 8, 12, 16, and 20; and component 4 gathers items 5, 9, 13, 17, and 21.
Note: factor loadings <0.40 are omitted. For each component, items are sorted in decreasing order of their factor loadings. Items with factor complexity = 1 are in boldface.
Confirmatory factor analysis
The 20-item four-component model from the PCA was then assessed using a CFA (maximum likelihood). Following original analysis, 32 each component was assumed to be correlated and allowed to covary with each other in the model. Moreover, all measurement errors were set to be uncorrelated. The chi-squared of this model was 285.82 (df = 164, p < 0.001). Indices of fit were as follows: χ2/df = 1.74, comparative fit index (CFI) = 0.921, Tucker-Lewis index (TLI) = 0.909, standardized root mean of the residual (SRMR) = 0.057, root mean squared error of approximation (RMSEA) (90% CI) = 0.050 (0.041–0.060), and Akaike information criterion (AIC) = 377.82. These results revealed an acceptable model fit, except for the CFI and TLIs, close but lower than 0.95. We checked standardized covariances of residuals for values exceeding 2.58 and low values among standardized regression weights and square multiple correlations. 41 On the 190 standardized residual covariances, three exceeded the absolute value of 2.58 and involved item 10. Therefore, we removed this item. Moreover, we noted that three standardized regression weights were lower than the recommended value of 0.50, concerning items 4, 5, 7, and 21. 42 These four items were then removed. We reran the CFA with 15 items. Indices of fit of this corrected model were as follows: χ2(84) = 138.75, χ2/df = 1.65, CFI = 0.955, TLI = 0.944, SRMR = 0.050, RMSEA (90% CI) = 0.047 (0.033–0.061), and AIC = 210.75.
On the basis of Noar's recommendations, 43 we tested and compared alternative models. The choice of models was made using theoretical conceptualizations from Teo. 32 Model 1 is the 15-item four-component model with correlated components previously shown, whereas Model 2 assumes that components are uncorrelated. The last model (Model 3) proposed a 15-item factor structure. We compared as well our models to those designed by Teo. 32 Results of these CFA are presented in Table 3. Among our three models, Model 1 has the best fit and is retained as final solution. Moreover, when compared to Teo's Model 3 (i.e., a 4-factor correlated, 21-item solution), the closest model to our Model 1, we found similar indices fit. However, some notable differences exist in χ2 value, χ2/df, and RMSEA indices. Model 1 is represented in Figure 1.
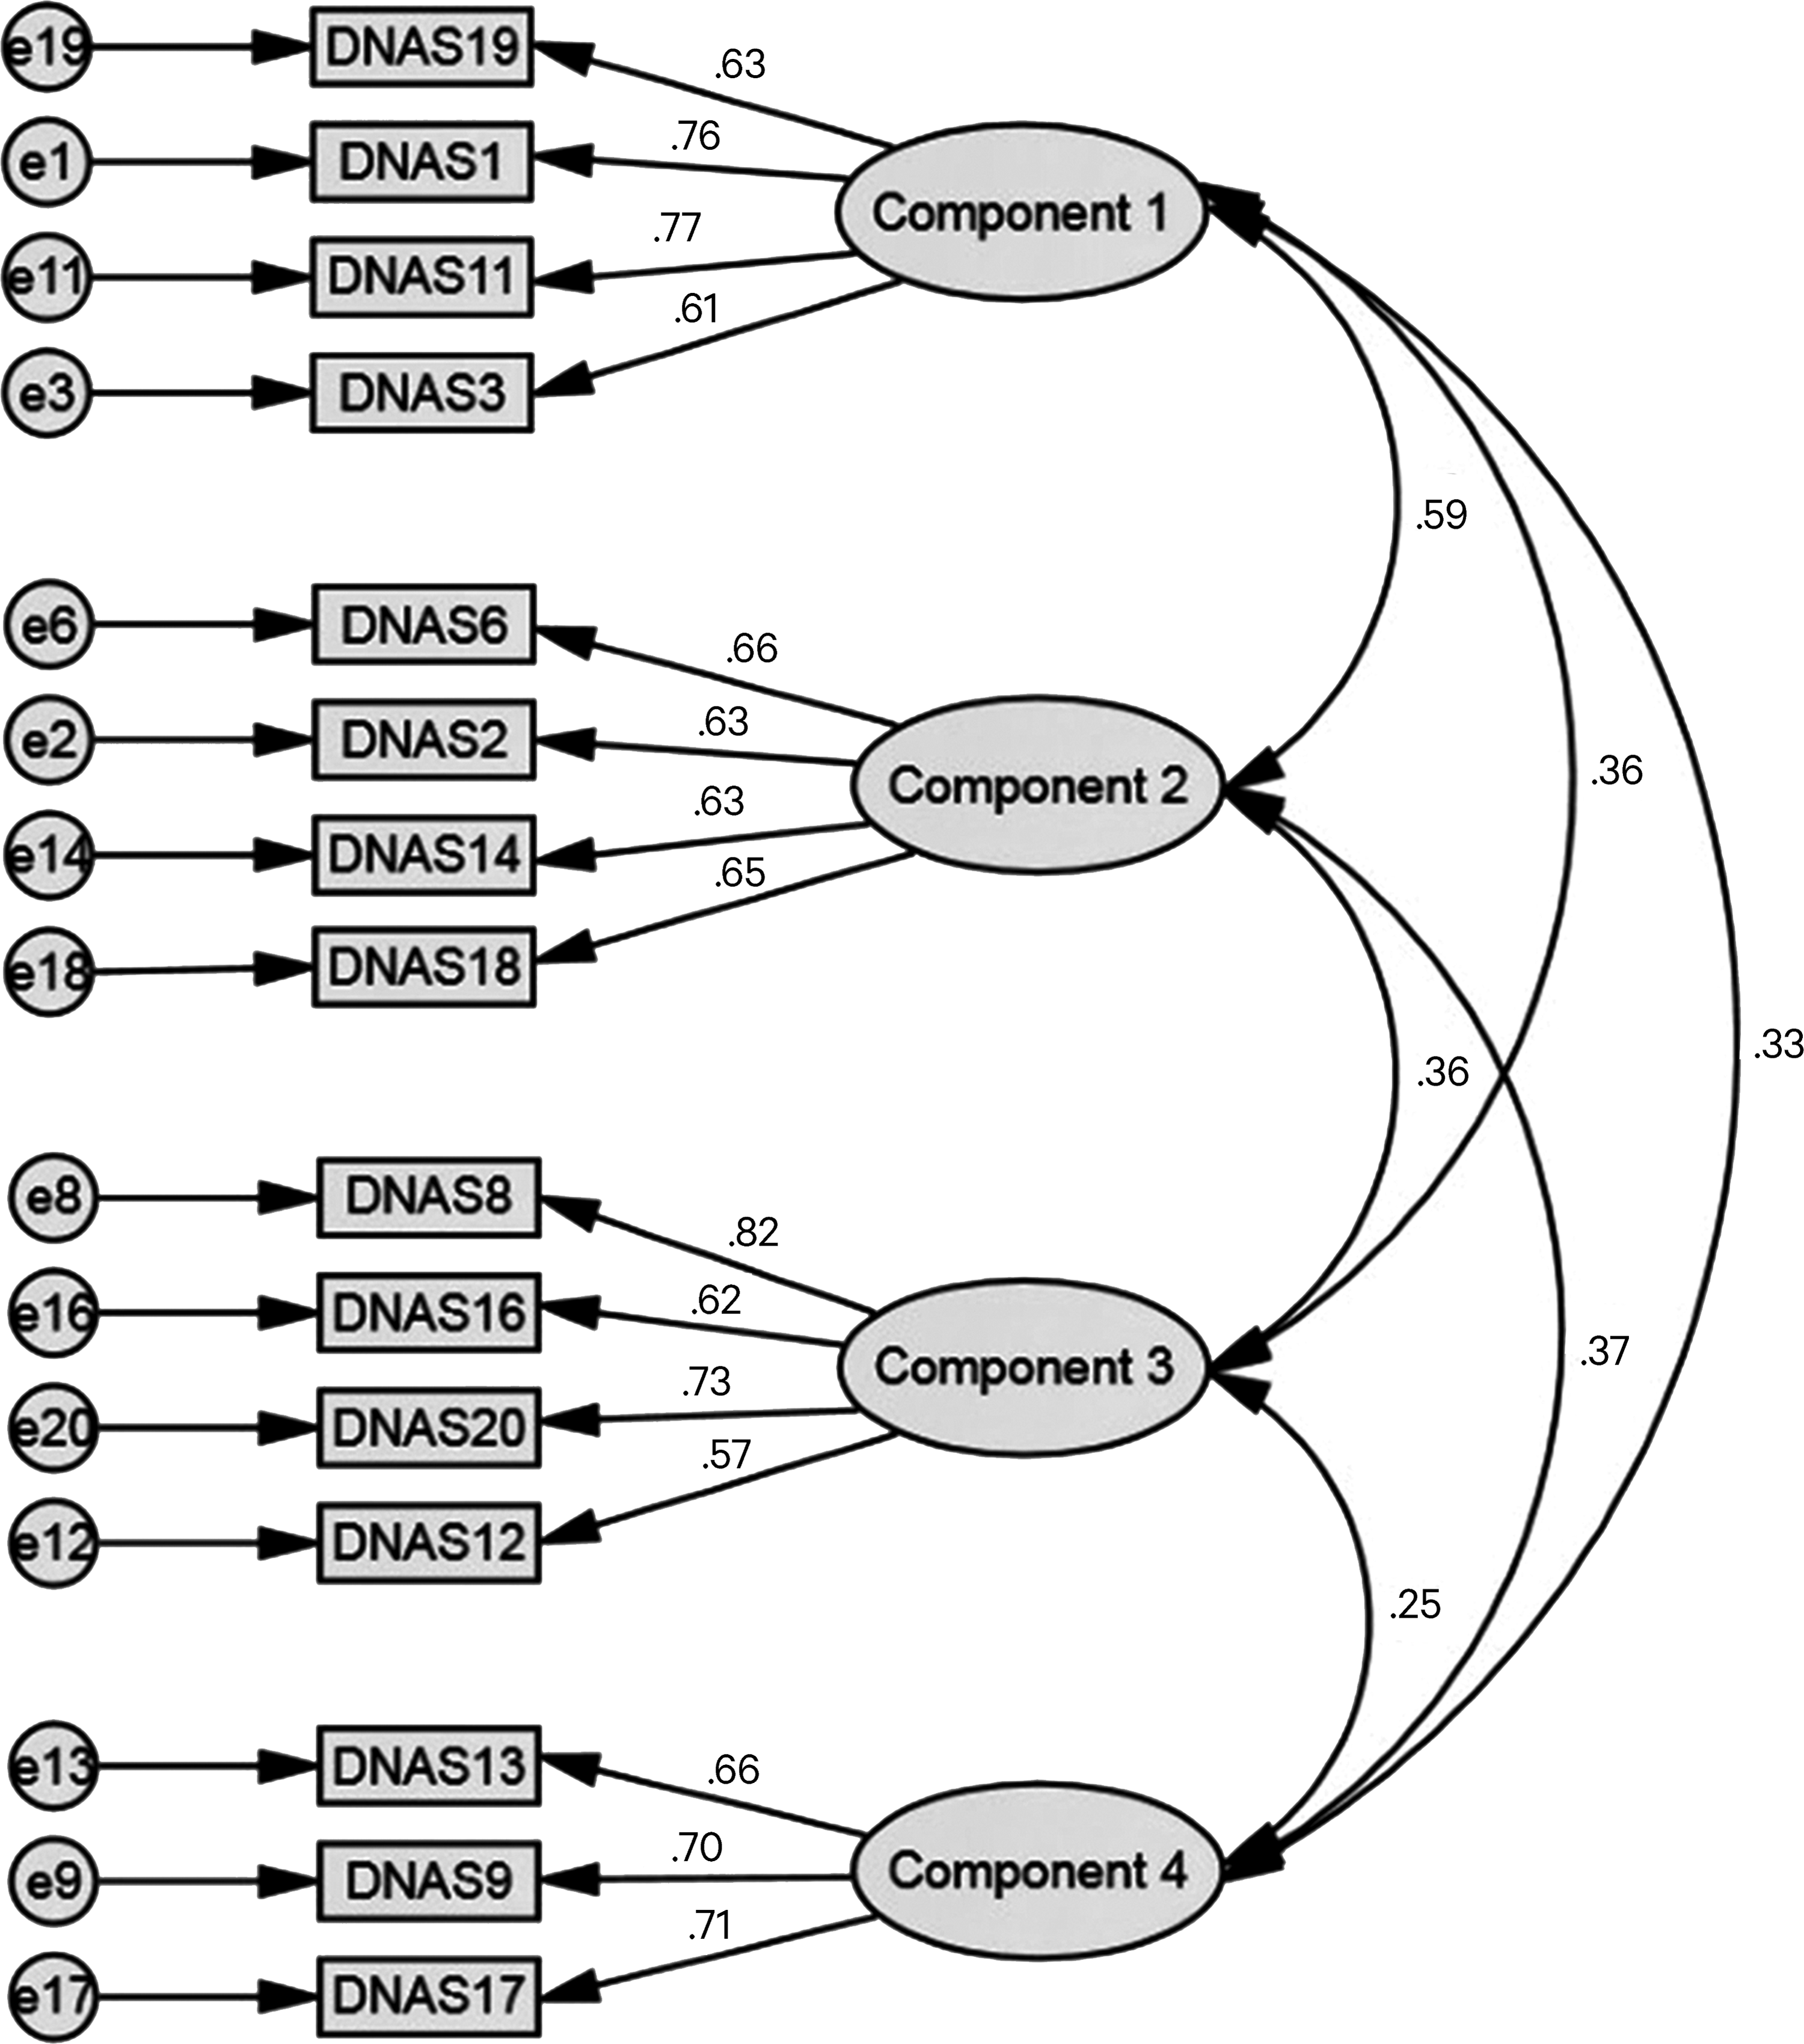
Model of the 15-item French-translated version of the DNAS. DNAS, Digital Natives Assessment Scale.
Note: Final factor structure is in boldface. Teo's Models are from Teo's original study. 32
AIC, Akaike information criterion; RMSEA, root mean squared error of approximation; SRMR, standardized root mean of the residual; TLI, Tucker-Lewis index.
Final factor solution examination
For every item, standardized regression weights were relatively large enough (i.e., 0.57–0.82, p < 0.001) to provide support for convergent validity within the scale. 44 Correlations between factors were small enough (0.25–0.59, p < 0.001) to suggest that they are sufficiently distinct from each other. This result provides evidence for discriminant validity. Cronbach's alpha for component 1, component 2, component 3, and component 4 are, respectively, 0.78, 0.70, 0.77, and 0.72, which shows good reliability. All item-total correlations are well above 0.3, as the lowest is 0.48 for item 12 on component 3. This last result provides support for the factorial and construct validity of the DNAS. 39
Last, our sample has a mean score at component 1 of 20.11 (SD = 5.84) with a minimum score of 4 and a maximum score of 28. Participants had as well a mean score on components 2, 3, and 4 of 23.67 (SD = 4.00, min. = 7, max. = 28), 15.13 (SD = 5.53, min. = 4, max. = 28), and 16.14 (SD = 3.41, min. = 3, max. = 21). The global mean score is 75.03 (SD = 13.05), with score able to range from 15 to 105 (Cronbach's α = 0.82).
Discussion
The main aim of this study was to further explore factor structure validity of a French version of the DNAS. Our analyses highlighted a 15-item four-correlated component structure. Factor structure found is relatively similar to the one from original study apart from six items rejection (i.e., items 4, 5, 7, 10, 15, and 21). Cronbach's alpha of this shortened version is lower too. These results may be explained by our statistical analysis procedure, which slightly differs from published articles. Nonetheless, the four dimensions representing digital natives according to Teo appeared in the results. Components 1, 2, 3, and 4, respectively, correspond to comfortable with multitasking, grow up with technology, reliant on graphics for communication, and thrive on instant gratifications and rewards dimensions. Moreover, correlations between each dimension testify of an underlying link.
“Comfortable with multitasking” dimension refers to the fact that digital natives are used to attend with ease two or more personal, social, educational, or professional activities in parallel. 11 Emerging technologies widely facilitated running multiple activities at the same time. “Grow up with technology” dimension stands for digital natives being surrounded by digital media since their childhood. 1 Moreover, they often interacted with these technologies so that it becomes for them a natural way of life. By the “Reliant on graphics for communication” dimension, one may refer to the fact that digital natives have a significant preference and an intuitive use of graphics-rich versus text-only environments. Communication through smartphones includes various graphical contents (e.g., pictures, smileys, movies, and so on) instead of only words and sentences. Finally, the “Thrive on instant gratifications and rewards” dimension illustrates individuals looking to get without delay what they want/need. For example, to buy in few clicks a gift through the Internet instead of going physically to a store, searching and comparing goods before buying them. Internet and digital technologies changed how people work, learn, or play. For instance, large amount of information is now available from the Internet and communication is marked by instant messaging media. Therefore, digital natives may crave for immediate feedback to be satisfied. 1
This study provides evidence of the questionnaire solidity and its cross-cultural and cross-generational validity. Indeed, the original version was designed and tested in a sample of adolescents from New Zealand (mean age = 13.5). 32 Later on, adaptations were conceived. Yong and Gates administrated the questionnaire to adolescents aged from 16 to 18 in Malaysia. 45 Teo, Kabakçı Yurdakul, and Ursavaş designed a Turkish version of the DNAS they used in a sample of 557 students about age 20. 34 This translated version was later used in several other Turkish students samples.46,47 Last, Teo developed a Chinese version of his questionnaire, with a sample of 402 students. 33 Each study found a similar 21-item 4-factor structure.
This study is the first to assess DNAS validity in European context. Moreover, our sample differs from those in previous studies. So far, DNAS had been mainly used on young people, from early adolescents to young adults. On the contrary, our sample includes 67.8 percent of participants aged from 10 to 29, with a 58.8 percent of those aged from 19 to 29. Therefore, 220 participants are older than 30. Despite this, we found a factor structure relatively similar to those found in samples from separate countries, cultures, and age groups. This result is in favor of a common nature of digital natives and their characteristics. Another way to explain this is to remind that emerging technologies dissemination goes beyond frontiers and age groups. Consistent with what is found in the literature, the digital gap is less linked to a generational gap than to differences in technology access and use that can itself be conditioned by age, socioeconomic, or cultural groups.2,6,7,14,48 Teo and collaborators stated that DNAS scores do not really vary according to gender or age, but more to years of technology experience and perceived computer self-efficacy.33,34 Akçayır et al. shared this finding and added that sociocultural context has an impact on such scores. 46 Therefore, being a digital native is acquired through favorable technology relationship.
So far, digital natives concept has mainly been used in educational environment.10,16,30,32,49 Teo himself estimated that the DNAS would be useful for instructors and teachers, to better understand what defines their students and how their relationship with technology would influence learning and social collaboration. However, digital technologies spread exceeds educational and formation issues. Changes in practice question technology misuses and associated risks especially among the youngest generations. In 2001, Prensky stated that graduates spent an average number of 5,000 hours over their life to read versus 20,000 hours to watch TV and 10,000 hours to play video games. Therefore, we think that the DNAS would be useful as well for educational and health professionals for clinical and research purposes. It could help to recognize and better understand patients with higher levels of familiarity with technology. Innovative and interactive interventions taking into account digital natives' characteristics would be interesting to offer. For its part, the education system knew how to change according to its students' affinity with technology.1,15,16
This study has its own limits. A more consequent sample would have been beneficial for both statistical analyses and/or to run proper cross-validation process. Moreover, other psychometric properties still need to be thoroughly assessed (i.e., concurrent, construct, or predictive validity). Another limit lies in the fact we did not measure technology habits of participants as well as their access and experience of technology. Even if sample participants all seem to present an interest in digital technologies, we may have included individuals with rather heterogeneous digital life.
To conclude, the French version of the DNAS designed during this study seems to be appropriate as a quick and effective scale to assess digital natives. However, a future goal would be to draw a comprehensive profile of digital natives, including sociodemographic and/or psychological variables. The DNAS supports a definition of digital natives based not only on a date of birth but also on a set of common characteristics. Nonetheless, minor differences may still be observed between these digital natives. Another future aim could be to measure such digital natives' subgroups. Deal et al. noted that there are often more differences between individuals of the same generation than between individuals of separate generations. 24 Substantial longitudinal studies could also give supplemental data on digital natives' trajectories of technology access and experience.
Footnotes
Acknowledgment
This research did not receive any specific grant from funding agencies in the public, commercial, or not-for-profit sectors.
Author Disclosure Statement
No competing financial interests exist.