
Abstract
Abstract
Why is it so difficult to resist the desire to use social media? One possibility is that frequent social media users possess strong and spontaneous hedonic reactions to social media cues, which, in turn, makes it difficult to resist social media temptations. In two studies (total N = 200), we investigated less-frequent and frequent social media users' spontaneous hedonic reactions to social media cues using the Affect Misattribution Procedure–an implicit measure of affective reactions. Results demonstrated that frequent social media users showed more favorable affective reactions in response to social media (vs. control) cues, whereas less-frequent social media users' affective reactions did not differ between social media and control cues (Studies 1 and 2). Moreover, the spontaneous hedonic reactions to social media (vs. control) cues were related to self-reported cravings to use social media and partially accounted for the link between social media use and social media cravings (Study 2). These findings suggest that frequent social media users' spontaneous hedonic reactions in response to social media cues might contribute to their difficulties in resisting desires to use social media.
T
At the same time, however, the ubiquity of social media in people's lives makes it difficult to resist the desire to use social media when its use conflicts with other goals and obligations.6,7 Desires that involve goal conflict are typically labeled as temptations. 6 Failures to resist social media temptations may fuel feelings of guilt about one's media use, decrease media enjoyment, and eventually negatively affect well-being.8–10
Experience sampling research suggests that people frequently give in to their desires to use media despite their willingness to resist them.10,11 Furthermore, daily social media users estimated that about one-third of their time spent on social media during a typical day was perceived as being in conflict with other goals they had, made them use their time less efficiently, and made them delay other things they also wanted or needed to do (Du et al., A brief measure of social media self-control failure, unpublished work). Social media thus appears to be a seductive temptation in everyday life. What makes social media so difficult to resist? One possibility is that social media users possess strong and spontaneous hedonic reactions to social media cues.
People often use social media because they offer immediate gratifications and satisfy many needs,2,5 and using social media has been found to evoke a psychophysiological state high in positive valence and arousal. 1 Dual-system models of behavior12,13 suggest that people learn to associate hedonic states with stimuli they are repeatedly exposed to and experienced as pleasurable. Accordingly, social media users may learn to associate the concept of social media with a pleasant, hedonic state. Once such an association has been established, dual-system models further assume that this learned hedonic reaction can be easily reactivated by perceptual (e.g., seeing the Facebook app icon on your smartphone) or internal cues (e.g., briefly thinking about checking Facebook). Future exposure to social media cues might thus trigger a spontaneous hedonic reaction that, in turn, might induce a desire to use social media. 12 This research therefore tested whether exposure to social media cues triggers spontaneous hedonic reactions in social media users (also see Hofmann et al. 6 for this suggestion). Since it is assumed that the described associative process develops over time,12,13 we hypothesized that these spontaneous hedonic reactions would be particularly likely to occur among frequent social media users.
We employed the Affect Misattribution Procedure (AMP), 14 an implicit measure of affective reactions, to capture social media users' spontaneous hedonic reactions to social media cues. In the AMP, prime pictures (e.g., of flowers or spiders) followed by Chinese pictographs are briefly, but visibly, presented on a computer screen. Participants' task is to judge the pictographs (but not the prime pictures) as pleasant or unpleasant. It has been shown that participants misattribute the spontaneous affective reactions triggered by the prime pictures to their evaluations of the ambiguous pictographs shown milliseconds after the prime. 14 Therefore, in this research, prime pictures were social media-related cues (e.g., the Facebook logo) and neutral control cues (e.g., a stapler). If social media cues indeed trigger strong spontaneous hedonic reactions among frequent social media users, these users should rate the Chinese pictographs following social media cues as more pleasant than the Chinese pictographs following control cues. We examined this in the context of Facebook because of its popularity, 15 and therefore specifically tested the expectation that exposure to Facebook (vs. control) cues would trigger spontaneous hedonic reactions in frequent (vs. less frequent) Facebook users. Study 1 provided an initial test of this hypothesis.
Given the discussions on the reproducibility of psychological findings, 16 Study 2 aimed at directly replicating the findings of Study 1. Furthermore, Study 2 examined whether spontaneous hedonic reactions to Facebook cues could be meaningfully linked to self-reported cravings to use Facebook. We measured Facebook cravings because cravings reflect a state that has been associated with giving in to temptation (i.e., a preference for immediately rewarding behavior). 17 In addition, we operationalized Facebook cravings in this research as a strong desire to use media or preoccupation with using media, to reflect one of the central aspects of problematic or unregulated media use.18,19
Studies 1–2
Methods
Design, participants, and procedure
Facebook users' spontaneous hedonic reactions were assessed using the AMP with cue type (Facebook vs. control) as within-subjects factor and Facebook use as continuous predictor. MTurk participants (N = 92 and 170 in Studies 1 and 2, respectively) from the United States who had at least a 95% MTurk approval rating and successfully completed 50 MTurk tasks before completed the online study (programmed in Inquisit 4)
20
and were paid $1. Based on a priori criteria and before any data analyses, participants were excluded if they already participated in a study using the same AMP (n = 5 and 13 in Studies 1 and 2, respectively), did not use Facebook (n = 11 and 18 in Studies 1 and 2, respectively), were familiar with the Chinese or Japanese language (which may influence their AMP responses,
14
n = 5 in both studies), or responded to every target in the AMP with the same response key
14
(n = 1 and 11 in Studies 1 and 2, respectively). Thus, analyses were conducted on 72 and 128 participants in Studies 1 and 2, respectively (some participants met multiple exclusion criteria). Participants first completed the AMP (presented as a task examining how people make judgments under distracting conditions), followed by a questionnaire that included the Facebook cravings (in Study 2 only) and Facebook use measures. After answering some background and demographic questions (see Table 1 for the samples' characteristics), they were thanked for their participation. Supplementary Data (materials, data, and supplementary materials [in which we describe additional variables measured for exploratory reasons]) are available online at
Response categories were as follows: 0 = 10 or less, 1 = 11–50, 2 = 51–100, 3 = 101–150, 4 = 151–200, 5 = 201–250, 6 = 251–300, 7 = 301–400, and 8 = over 400.
Response categories were as follows: 1 = less than 6 months, 2 = 6 months, 3 = 1 year, 4 = 1.5 years, 5 = 2 years, 6 = 2.5 years, and 7 = 3+ years.
Items (based on Panek, 2014): “On average, how often do you engage in the following activities (with your phone, computer, tablet, or other device): talking/texting/reading email/sending email/posting comments, photos, or status updates on Social Network Sites (SNS)/looking at SNS/browsing the Internet”; response categories were as follows: 1 = less than once a week, 2 = once a week, 3 = daily, 4 = 2–3 times a day, 5 = once an hour, and 6 = more than once an hour.
Response categories were as follows: 1 = not at all, 2 = not well, 3 = well, and 4 = very well.
Response categories were as follows: 1 = no noise and distractions, 2 = some, 3 = quite a bit, 4 = substantial, and 5 = only noise and distractions.
Materials
For the AMP, we selected 10 Facebook-related (e.g., the Facebook logo, a timeline screenshot) and 10 control pictures of office supplies (e.g., a stapler and sticky tape) as primes, supplemented with a filler picture (10 times a grey square). The Chinese pictographs and mask picture were taken from the materials used by Payne et al. 21 We tested whether the Facebook and control prime pictures were equally visually appealing in a separate study to rule out visual attractiveness as an alternative explanation for any observed differences in hedonic reactions. 21 Facebook users from MTurk (N = 46; 20 males, 26 females; Mage = 39.17 years, SDage = 12.75 years, and range 19–70) rated the visual appeal of the prime pictures (presented in random order; 1 = not at all appealing, 7 = very appealing). They were asked to provide their ratings without regard to whether they liked the objects featured. Results confirmed that participants rated the Facebook (α = 0.94; M = 3.73, SD = 1.43) and control pictures (α = 0.91; M = 3.46, SD = 1.14) as equally appealing (rFacebook-control = 0.34, p = 0.022; Mdifference = 0.27, SDdifference = 1.50, 95% CI = [−0.17, 0.72], t(45) = 1.23, p = 0.226, Cohen's d = 0.18). The filler picture (grey square; M = 1.35, SD = 0.95) was rated as less appealing than both the control (rfiller-control = 0.31, p = 0.038; Mdifference = −2.11, SDdifference = 1.24, 95% CI = [−2.48, −1.74], t(45) = −11.53, p < 0.001, Cohen's d = −1.71) and Facebook pictures (rfiller-Facebook = 0.22, p = 0.143; Mdifference = −2.38, SDdifference = 1.53, 95% CI = [−2.84, −1.93], t(45) = −10.53, p < 0.001, Cohen's d = −1.60).
Measures
Hedonic reactions
Following Payne et al., 14 on each trial of the AMP, a prime picture was presented (75 ms), followed by a blank screen (125 ms), a Chinese pictograph (100 ms), and finally a mask that remained until a response was made (Fig. 1). Participants were asked to judge whether each pictograph was more or less pleasant than the average pictograph using the “i” (pleasant) and “e” (unpleasant) keys. The task consisted of 60 trials (preceded by 10 practice trials), presented in random order. Each prime picture was shown twice and was paired with a new pictograph each time. The proportion of pleasant responses to Facebook (Study 1: M = 0.67, SD = 0.22; Study 2: M = 0.59, SD = 0.24) and control cues (Study 1: M = 0.62, SD = 0.21; Study 2: M = 0.55, SD = 0.23) served as dependent variables in our analyses.
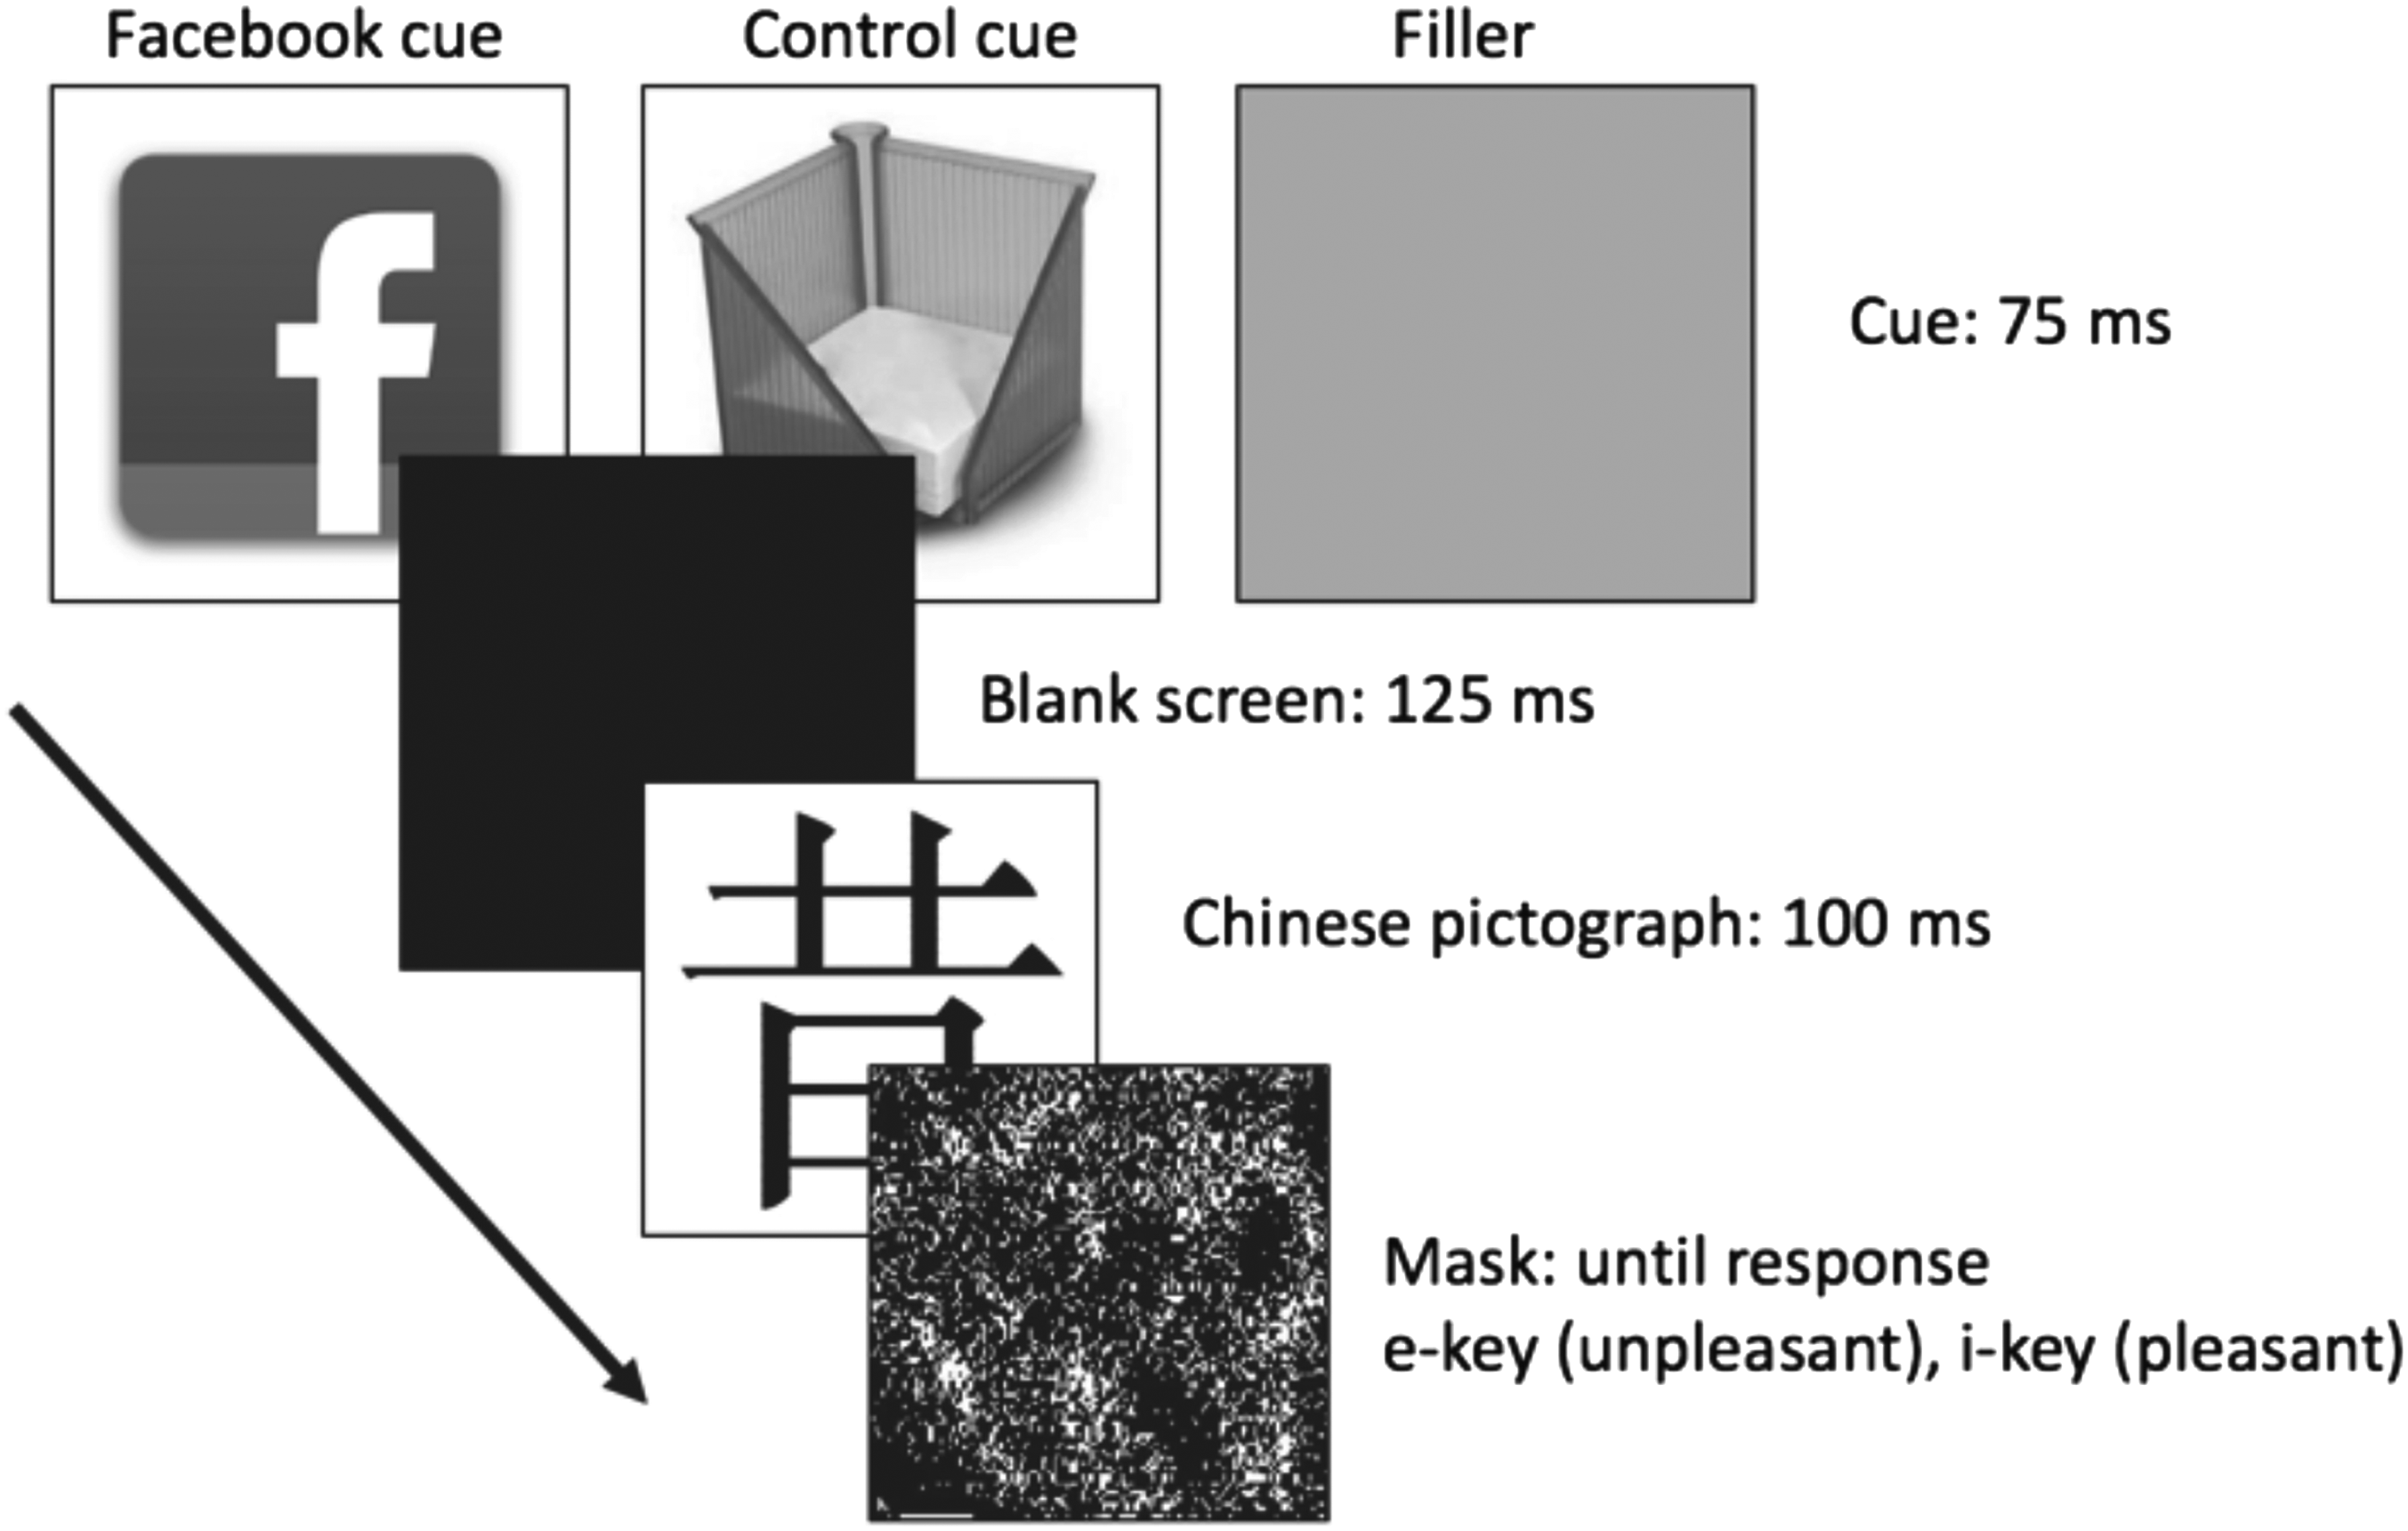
Schematic illustration of a trial of the Affect Misattribution Procedure.
Facebook cravings
In Study 2, Facebook cravings were measured using six items (α = 0.94) based on 22 : “I want to use Facebook right now,” “I would love if it was possible to use Facebook right now,” “I will use Facebook immediately after I finished this survey,” “I strongly desire to use Facebook right now,” “I don't need Facebook at the moment” (reverse scored), and “Right now, I am craving to use Facebook.” Responses were given on a 5-point scale (1 = strongly disagree, 2 = disagree, 3 = neutral, 4 = agree, and 5 = strongly agree; M = 2.20, SD = 0.91).
Facebook use
Facebook use was assessed with items measuring the duration and frequency of use and were adapted from Ross et al., 23 and supplemented with an additional item (“How often do you check your Facebook account?”). Table 2 displays the items and summary statistics for this continuous scale.
Before taking an average to create the scale, individual items were standardized because of differing item scale ranges.
Response categories were as follows: 1 = 10 minutes or less, 2 = 10–30 minutes, 3 = 31–60 minutes, 4 = 1–2 hours, 5 = 2–3 hours, and 6 = 3+ hours.
Response categories were as follows: 1 = less than once a year, 2 = a few times a year, 3 = less than once monthly, 4 = once monthly, 5 = twice monthly, 6 = once weekly, 7 = 2 or more times weekly, 8 = once daily, 9 = twice daily, 10 = 3–4 times daily, and 11 = more than four times daily.
Results
We first computed bivariate correlations between the main study variables to explore their relationships. Facebook use was positively correlated with the mean proportion of pleasant responses to Facebook cues (Study 1: r = 0.31, p = 0.009; Study 2: r = 0.18, p = 0.04), but unrelated to pleasant responses to control cues (Study 1: r = −0.05, p = 0.651; Study 2: r = −0.11, p = 0.21). Pleasant responses to Facebook and control cues were positively correlated (Study 1: r = 0.30, p = 0.01; Study 2: r = 0.34, p < 0.001). Furthermore, in Study 2, Facebook cravings were positively correlated with Facebook use (r = 0.61, p < 0.001) and pleasant responses to Facebook cues (r = 0.25, p = 0.004), but unrelated to pleasant responses to control cues (r = −0.08, p = 0.37).
To test our main hypothesis, we performed a mixed model repeated-measures ANOVA on hedonic reactions with cue type (Facebook vs. control) as within-subject factor and Facebook use as continuous predictor (with means for less-frequent and frequent Facebook users estimated at −1 SD and +1 SD, 24 respectively). The analysis for Study 1 revealed no significant main effects of cue type, F(1, 70) = 3.43, p = 0.068, and η2p = 0.047, or Facebook use, F(1, 70) = 1.93, p = 0.169, and η2p = 0.027. However, as expected, results revealed a significant interaction effect between cue type and Facebook use, F(1, 70) = 7.60, p = 0.007, and η2p = 0.098 (Fig. 2A). Simple effects tests showed that frequent Facebook users had significantly more pleasant responses following Facebook cues (M = 0.77, SE = 0.04) than control cues (M = 0.60, SE = 0.04), Mdifference = 0.16, SEdifference = 0.05, 95% CI = [0.06, 0.26], F(1, 70) = 11.02, p = 0.001, and η2p = 0.136. In contrast, less-frequent Facebook users showed no significant differences in response to Facebook cues (M = 0.58, SE = 0.04) versus control cues (M = 0.63, SE = 0.04), Mdifference = −0.06, SEdifference = 0.05, 95% CI = [−0.15, 0.04], F(1, 70) = 1.31, p = 0.256, and η2p = 0.018.

Mean proportion of pleasant responses as a function of cue type and Facebook use (continuous predictor, with means for less-frequent and frequent Facebook users estimated at −1 SD and +1 SD, respectively).
Importantly, these results were exactly replicated in Study 2. The main effects of cue type, F(1, 126) = 2.28, p = 0.134, and η2p = 0.018, or Facebook use, F(1, 126) = 0.26, p = 0.609, and η2p = 0.002, were not significant. However, the results again revealed a significant interaction effect between cue type and Facebook use, F(1, 126) = 8.91, p = 0.003, and η2p = 0.066 (Fig. 2B). Simple effects tests showed that frequent Facebook users had significantly more pleasant responses following Facebook cues (M = 0.64, SE = 0.03) than control cues (M = 0.52, SE = 0.03), Mdifference = 0.12, SEdifference = 0.04, 95% CI = [0.05, 0.20], F(1, 126) = 10.70, p = 0.001, and η2p = 0.078. In contrast, less-frequent Facebook users showed no significant differences in response to Facebook cues (M = 0.53, SE = 0.03) versus control cues (M = 0.58, SE = 0.03), Mdifference = −0.05, SEdifference = 0.04, 95% CI = [−0.12, 0.02], F(1, 126) = 1.89, p = 0.172, and η2p = 0.015. In both studies, including gender as a factor did not influence the pattern of results.
To examine whether the spontaneous hedonic reactions to Facebook (vs. control) cues in Study 2 could partially explain the relationship between Facebook use and Facebook cravings in this sample (r = 0.61, p < 0.001), we conducted a mediation analysis using the PROCESS macro in SPSS (Model 4). 25 For this analysis, AMP responses were scored as a difference score by subtracting the proportion of pleasant responses to control cues from pleasant responses to Facebook cues. Higher scores reflect more positive responses to Facebook cues relative to control cues (M = 0.04, SD = 0.27). Results indicated that Facebook use was a predictor of the AMP difference score, b = 0.09, SE = 0.03, t(126) = 2.99, p = 0.003, and 95% CI = [0.03, 0.14], and the AMP difference score had a direct effect on Facebook cravings, b = 0.49, SE = 0.24, t(125) = 2.03, p = 0.044, and 95% CI = [0.01, 0.97]. The effect of Facebook use on Facebook cravings remained significant when the AMP difference score was controlled for, b = 0.65, SE = 0.08, t(125) = 7.99, p < 0.001, and 95% CI = [0.49, 0.81]. However, the indirect effect by the AMP difference score equaled 0.04, SE = 0.02, and 95% CI = [0.01, 0.10], suggesting a significant indirect effect of Facebook use on Facebook cravings by hedonic reactions to Facebook (vs. control) cues (mediation). The mediator accounted for 6% of the total effect (b = 0.69, SE = 0.08, t(126) = 8.70, p < 0.001, and 95% CI = [0.53, 0.84]), Pm = 0.06. Controlling for gender did not influence the pattern of results.
Discussion
Two studies employing the AMP, an implicit measure of spontaneous affective reactions, yielded consistent results: Frequent Facebook users showed more favorable affective reactions in response to Facebook cues compared to control cues. Less-frequent Facebook users' affective reactions did not differ between Facebook and control cues. These results support our hypothesis that exposure to social media cues triggers spontaneous hedonic reactions in frequent social media users. The direct replication of the effect is important given the discussions on the reproducibility of psychological findings.
The findings are consistent with the idea that media users possess strong and positive spontaneous affective reactions to media content. 6 Furthermore, Study 2 revealed a positive association between pleasant responses to Facebook cues and Facebook cravings, and the stronger hedonic reaction to Facebook (vs. control) cues partially accounted for the relationship between Facebook use and Facebook cravings. Given that cravings reflect one of the aspects of problematic or unregulated media use18,19 and have been associated with a preference for immediately rewarding behavior when tempted, 17 we speculate that the observed spontaneous hedonic reactions to social media cues might also be associated with people's failures to resist social media temptations. This speculation is consistent with dual-system models of behavior, which propose that spontaneous hedonic reactions to pleasurable stimuli increase the risk of self-control failure.12,13 It should be noted, however, that in this research, we did not measure self-control failure, and mean cravings were not very strong within the studied sample. To substantiate this claim, future research should thus aim to link spontaneous hedonic reactions to media cues to outcome variables that more directly capture media self-control failures (e.g., deficient self-regulation 19 ) and among people who display problematic media use.
Several limitations to this research need to be acknowledged. First, the cross-sectional nature of our data limits our certainty about the causal order. Future research should aim to study the relationships between spontaneous hedonic reactions to social media cues, social media use, and social media cravings by using experimental or longitudinal methods. Second, we tested our hypothesis in the specific context of Facebook. The extent to which our findings can be generalized to other (social) media stimuli thus remains open and should be tested in future studies. Finally, the level of social media use in these samples was relatively moderate. It would thus be useful to investigate spontaneous hedonic reactions to social media cues among more heavy users. It could be that heavier users show stronger hedonic reactions to social media cues. Alternatively, if heavier users associate their social media use with negative experiences (e.g., addiction), they might show negative affective reactions in response to social media cues.
In conclusion, this research showed that exposure to social media cues triggers spontaneous hedonic reactions in frequent social media users. These spontaneous hedonic reactions to social media cues, in turn, appear to trigger social media cravings. Together, this might contribute to people's difficulties in resisting desires to use social media.
Footnotes
Author Disclosure Statement
No competing financial interests exist.
References
Supplementary Material
Please find the following supplemental material available below.
For Open Access articles published under a Creative Commons License, all supplemental material carries the same license as the article it is associated with.
For non-Open Access articles published, all supplemental material carries a non-exclusive license, and permission requests for re-use of supplemental material or any part of supplemental material shall be sent directly to the copyright owner as specified in the copyright notice associated with the article.