
Abstract
Abstract
Problematic smartphone use is an emerging issue in behavioral addiction research. At the same time, measuring smartphone use with mobile apps has become increasingly common. However, understanding how much data are necessary requires careful consideration if the field is to move forward. Here, we examine how much time should be spent measuring mobile phone operation to reliably infer general patterns of usage and repetitive checking behaviors. In a second analysis, we consider whether a self-report measure of problematic smartphone use is associated with real-time patterns of use. Results suggest that smartphone usage collected for a minimum of 5 days will reflect typical weekly usage (in hours), but habitual checking behaviors (uses lasting <15 seconds) can be reliably inferred within 2 days. These measurements did not reliably correlate with a self-reported measure. We conclude that patterns of smartphone use are repetitive and our results suggest that checking behavior is a particularly consistent and efficient measure when quantifying typical and problematic smartphone usage.
Introduction
P
To determine what a suitable time frame for data collection might look like, one must first establish how stable individual smartphone usage is over time. In theory, researchers could continuously collect smartphone usage data, but this would become ethically problematic long before hitting a computational wall. Nevertheless, collecting fewer data points would enable procedural advantages and increase participant retention. Therefore, in this study we aim to answer this question by conducting some additional analysis on an existing data set that previously quantified smartphone usage for a period of 2 weeks.
Materials and Methods
The data obtained for this study have previously been described in Andrews et al. 6 However, a secondary analysis reported here aims to determine the volume of data required to reliably infer typical smartphone usage patterns. This is distinct from what the original article aimed to explore (for a more detailed account of the original methodology, see Andrews et al. 6 ).
Participants
Data were collected from 27 students and staff from the University of Lincoln (17 females, mean age = 22.52 years, range = 18–33). Our sample comprised clerical, technical, and academic university staff, and students who were studying a range of subjects, including psychology, computer science, zoology, and media production. This sample size was deemed adequate for our analyses as vast amounts of usage data were collected for each participant over the duration of the study. All participants provided informed consent and were able to view example data in advance.
Data collection
We developed an Android smartphone app using the Funf in a Box framework. 8 This resulted in a small app that recorded a timestamp when smartphone use started and ended. Data are encrypted and uploaded to a server over Wi-Fi (for more details, see Aharony et al. 8 ). The app provided a timestamp when the phone became active, and a second when this activity stopped and the phone was inactive. This was primarily anything that involved screen use, but also included processor intensive activities (e.g., calls and playing music). Two behavioral measures were generated at the end of each day: total hours of usage and frequency of use. Total hours of usage were determined by the amount of time that the phone was active. Frequency of use (or checking) was measured in terms of number of smartphone checks, which were defined by Ref. 6 as any usage lasting <15 seconds. Checks are included within the present analysis because we believe this is more informative for future problematic smartphone use research. In addition, the number of times someone checks his or her phone each day does not correlate with total hours of use (all p's > 0.1). 6 In other words, these are two completely separate behavioral measures (Fig. 1).

Distributions of total usage
Data were collected for 14 days; however, due to between-participant time differences when the app was installed, we removed data collected between application installation and midnight of day 1. This left 13 complete days of data for analysis. Week 1 contained a full weekend and 4 weekdays for all participants. Week 2 contained a full weekend and 5 weekdays for all participants. The majority of participants installed the application on a Thursday (n = 14) or Friday (n = 12) with a single installation occurring on a Wednesday.
A self-report measure was also administered (Cronbach's α = 0.89) to test whether this was also predictive of behavior. The Mobile Phone Problem Use Scale (MPPUS) consists of 27 items, which have previously demonstrated positive correlations with self-reported mobile phone use. 9 Items include: “I feel lost without my mobile phone” and “I can never spend enough time on my mobile phone.”
Results
We observe remarkable consistency when data points from all 13 days are clustered for each participant (Fig. 1). This is particularly noticeable regarding checking behavior with hours of usage per day being generally more variable. Our subsequent analysis initially considers weekday and daily comparisons before assessing the predictive ability of self-reported smartphone usage.
Weekly comparisons
Participant total hours of use and checks were calculated for each week independently. We observed that smartphone behaviors measured during the first 6 days of data collection when collapsed across all participants were highly predictive of total usage [r(25) = 0.81; p < 0.0001] and checks [r(25) = 0.96; p < 0.0001] observed in week 2 (7 days). This implies that just under 1 week of data collection is already sufficient to determine typical usage and checking behaviors for the following week. We also observed that average usage and checking patterns were remarkably similar between weekends and weekdays with no significant differences observed between average number of weekday hours (M = 4.95, standard deviation [SD] = 2.96) and average weekend hours (M = 5.25, SD = 3.13), [t(26) = −0.80, p = 0.43]. Similarly, no significant differences were observed when comparing the average number of checks during weekdays or (M = 41.00, SD = 35.00) weekends (M = 39.31, SD = 40.64), [t(26) = 0.41, p = 0.68].
Daily comparisons
A further analysis considered whether reliable behavior for an entire week could be inferred from single or multiple days. Each individual 24-hour usage period from the first 6 days was compared with total hours use and checks from week 2. These six correlation coefficients were averaged to provide an indication of how well a 24-hour period represented a typical week's use. This resulted in an average of (r = 0.61, range = 0.41–0.74) for usage and (r = 0.82, range = 0.64–0.89) for checks.
To illustrate the minimum number of days required to reliably infer patterns of smartphone behavior for an entire week, we aggregated the means from several days' data from week 1 and again compared this with total from week 2. Days included in a running mean increased cumulatively, that is, average of days 1 and 2 correlated with week 2 total, then average of days 1, 2, and 3 correlated with week 2 total, etc. Based on the strength of previous correlations between weeks 1 and 2, we predicted that the number of days required to reach a priori target of r > 0.8 would be small. As expected, hours of usage fluctuate more between subsequent days as the correlation coefficient reaches its zenith after about 5 days. In contrast, predicting future checking behavior requires very little data before an equally strong relationship is observed (Fig. 2). This result holds regardless of when a participant installed the application on his or her phone.
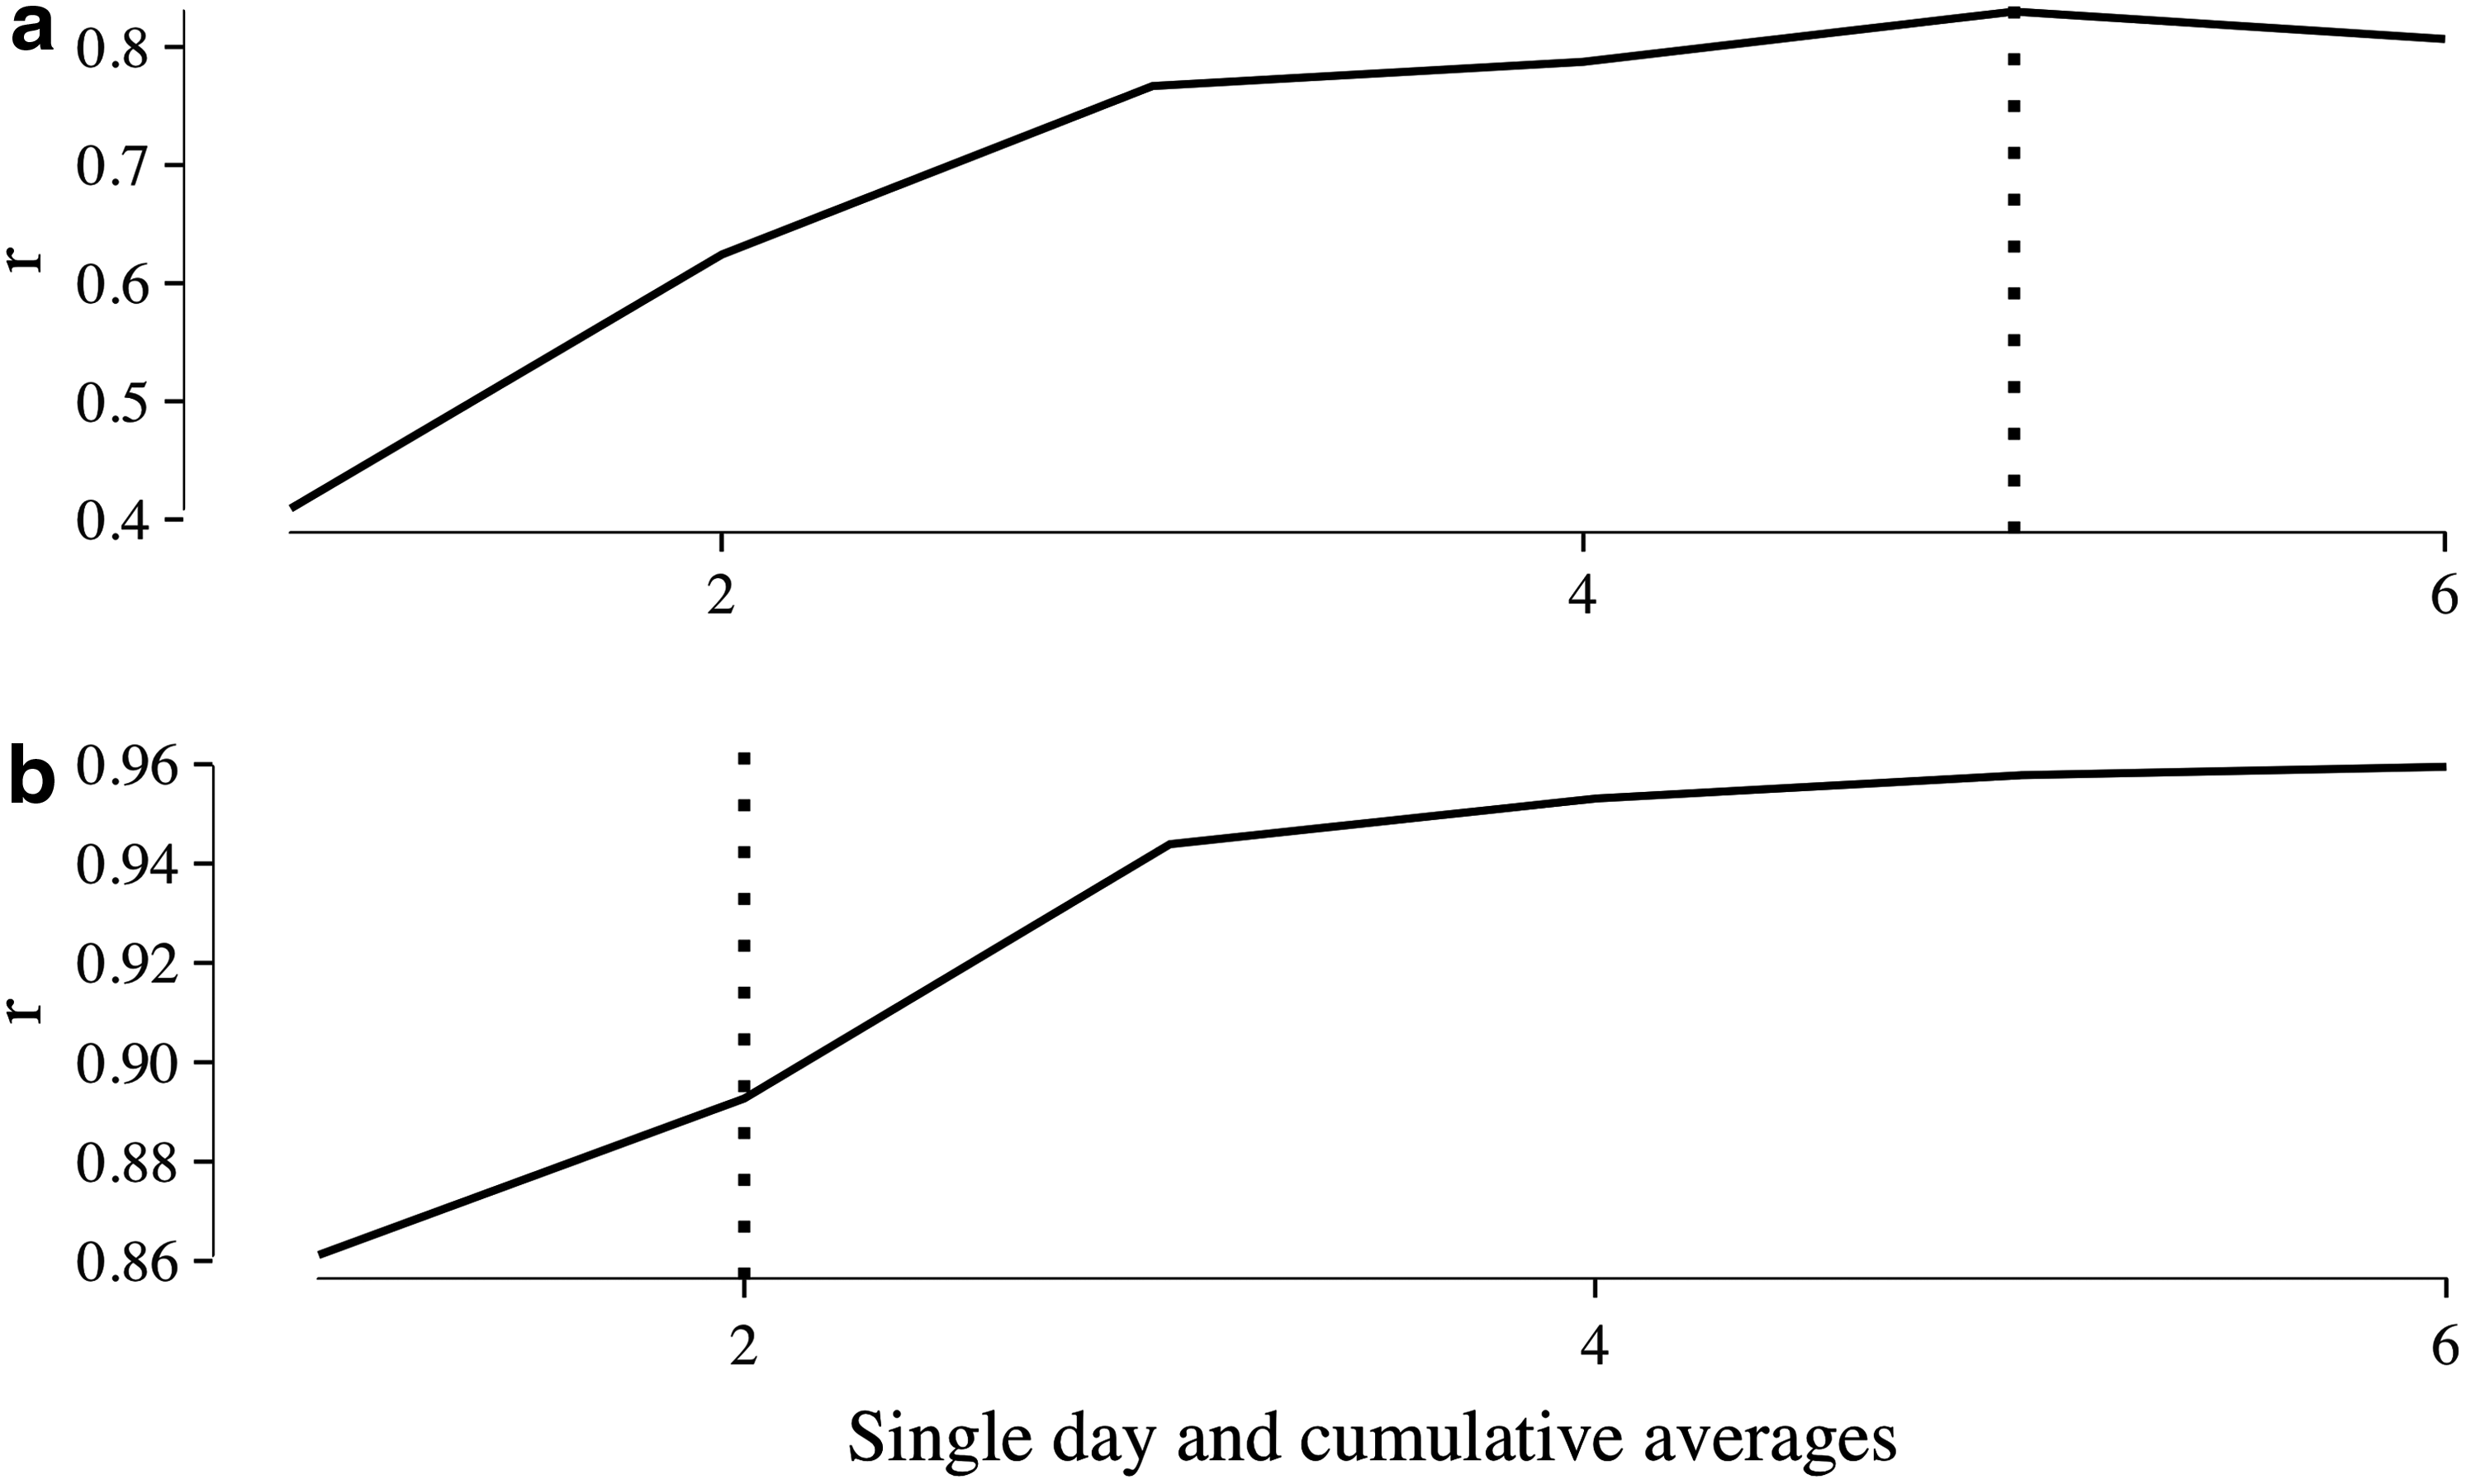
Pearson's correlation coefficients between the first day or cumulative averages from week one with totals derived from week two. The black line indicates the value of r for usage
Selecting a random combination of any 2 days from the first 6 days will always result in a correlation >0.75 when compared with the following week. Similarly, a random combination of any 5 days usage will result in a correlation >0.75 when compared with the following week. These results are, therefore, robust and even a single day can often remain predictive of any other day with average correlations for usage (r = 0.44, SD = 0.20) and checks (r = 0.72, SD = 0.13) remaining modest or high.
Self-report analysis
To further understand the value of self-report and its relation to real-world smartphone behavior, a measure of problematic phone use (the MPPUS) was also analyzed. Self-reported mobile phone behavior when using the MPPUS was previously found not to correlate (using Pearson's) with either of the two mobile phone usage measures for the duration of the original study (2 weeks). 6 This suggests that self-reporting problematic use may not be an accurate measure of actual behavior. However, self-report measures such as this are not always consistent as small differences between self-reported items are interpreted as being meaningful by Pearson's correlations. Instead, it is conceptually plausible to rank-order participants from least to most self-reported usage. Therefore, using the Spearman rank-order correlation coefficient (nonparametric measure) may allow us to retrieve an additional indication of the strength and direction of association that exists between two variables without any extreme self-reported scores affecting the analysis. However, ranked MPPUS scores were unable to predict total use or number of checks across the entire 13-day period (p's > 0.07). After our previous analysis protocol, we observed that the MPPUS was inconsistent when predicting usage or checks from an individual week or day.
Discussion
The type and duration of data required for smartphone usage and addiction studies lack direction. These analyses will hopefully enable researchers to consider adopting standardized methods when collecting and quantifying such data. In addition, relatively little behavioral data are required to quantify typical usage for longer periods of time. Within these analyses, it was observed that data collection for a period of a week is probably unnecessary. Participants in our sample appear to use their phone in a very similar pattern for a single 24-hour period. Similar to other digital traces (e.g., location tracking 10 ), these results confirm that smartphone interactions are a repetitive and consistent individual marker of behavior. Therefore, to obtain a measure relating to hours of usage for a week, it would appear that an average of about 5 days is required. For comparable checking behavior, only 48 hours of data are required. These results imply that measuring checking behavior may have procedural advantages for hours used. Requiring less data to reliably infer typical smartphone usage will allow research to become more efficient. Participants are also more likely to take part if their behavior can be assessed quickly.
One may question why phone checking frequency provides a more efficient measure of usage? It is possible that this variable is a better measure of preoccupation with mobile phones. Multiple checks could indicate an absent-minded use of mobile phones, which may not necessarily be goal directed. Therefore, checking frequency may represent more habitual usage. It could also be due to habitual behavior becoming more automatic and indicative of an unconscious problem. 11 This is in contrast to a measure of hour's use that may be more at risk of being affected by general use varying from 1 day to the next.
Self-reported problematic mobile phone use was unreliable when predicting subsequent behavior. 4 This may be because the cognitive processes associated with compulsive use are likely to be automatic 12 and as such cannot be captured through self-report, which can only measure deliberate conscious behaviors.
There are some limitations to this study. The first 24 hours after the app is installed could be an even more useful measure for researchers. In this analysis, the first full day of data collection was taken from midnight after installation of the mobile application and so we were unable to explore whether even a few hours of data are sufficient to reliably infer typical behavior. Beyond checking for weekend effects, we have not considered potential weekday effects, but a more complete analysis would have required many more participants to commence data collection on different days. The original study design attempted to control for this with almost every participant installing the application on a Thursday or Friday. However, we acknowledge that our youthful sample may demonstrate smartphone usage patterns that are markedly different from other groups. For example, older age groups who use their smartphone less frequently may require an extended period of data collection. Alternatively, data collection could be even shorter as their behavior patterns may be relatively stable. It is worth noting that participants with reduced usage overall demonstrated less variability when compared with those who use or check their smartphone more often.
In conclusion, these analyses indicate that it is not necessary to collect smartphone data for weeks or months at a time to infer typical patterns of usage, particularly when it comes to shorter instances of use or checking behaviors. These short but frequent behaviors are likely to be a more valuable measure of phone usage because they are procedurally easier to measure and are more likely to be associated with problematic phone usage behavior. This simple measure of behavior alone may prove to be more suitable for addiction-related smartphone studies in the future. 4
Footnotes
Acknowledgments
We thank K. Luther and R. Davies for helpful discussions in relation to this work. This work was partially funded by a Faculty of Science and Technology research grant (PSA7866) from Lancaster University, and by a Research Investment Fund (RIF2014-31) from the University of Lincoln. The funders had no role in study design, data collection and analysis, decision to publish, or preparation of the article.
Authors' Contributions
Authors D.A.E. and H.S. designed the study and wrote the protocol. Author H.S. collected and prepared the data. Author T.W. conducted the statistical analysis. Author T.W. wrote the first draft of the article and all authors contributed to and have approved the final article.
Author Disclosure Statement
No competing financial interests exist.