
Abstract
Abstract
This article details the process involved in the development of a new and revolutionary solution for medical communication. Our solution precisely tracks head and eye movement and allows the user to interact with an intuitive, pictogram-based interface. Around the world, many people rely on written instruction and verbal or nonverbal communication to accompany medication or provide additional information on a patient's symptoms. However, poor language skills and a host of health problems, psychological disorders, and trauma can limit a person's ability to speak or move. Our solution could drastically improve the quality of life of patients suffering from brain injury, hearing loss, and many other communication disorders and disabilities. They can begin to communicate with greater ease and fluency, feel connected to the world, and experience better and more accurate medical care. The potential applications have many incredible advantages, ranging from improved communication with family to emergency medical uses that can save the life of an affected individual. The use of augmented reality in our solution, as well as the secondary camera to improve accuracy in eye tracking, makes this solution for more accuracy, whereas the inclusion of a pictogram-based interface makes it a practical solution that cuts down on the error margins of traditional accessibility devices and makes it equally accessible to children and speakers of foreign languages. According to the data gathered, we confirm that the solution we propose has many possible practical applications in improving the health, safety, and quality of life of the user.
Introduction
Pictograms are ideograms 1 that express meaning through a graphic resemblance to a physical object. Pictograms include pictorial drawings, representational drawings, and hieroglyphic writing. Today, some pictograms are elements of formal and global languages.
The use of pictograms as a way of communicating health information to people afflicted with various communication disorders or difficulties may increase the efficiency of treatment and improve the patient's understanding of their medical status. Communication is a crucial aspect of medical care and treatment for patients, regardless of gender, age, personal background, medical history, or education level. Simple images are designed with the purpose of conveying medical information, such as drug prescriptions or emergency information exchange. The use of pictograms could help decrease the economic burden created by nonadherence to treatment, and even save lives.
Globally, people rely on written instruction and verbal or nonverbal communication to accompany medication or provide more information on a patient's signs and symptoms. However, poor language skills, health problems, psychological disorders, and trauma limiting a person's ability to speak or move could leave the patient at a real risk of taking or being administered potentially damaging or lethal doses of medication. According to the Centres for Disease Control and Prevention (CDC) 2 the estimated cost of nonadherence to prescription by taking medicine at the wrong frequency, time, or dosage, ranges between $100 and $289 billion annually.
This article examines the extent of communication disorders and communication difficulties, and why the medical use of pictograms within augmented reality is essential in helping patients improve or comprehend medical information during medical treatment, care, and rehabilitation.
Communication Disorders and Communication Difficulties
Communication disorders involve problems related to language, speech, and communication. Language includes the use of a system of symbols like sign language, spoken words, written words, and images that help people to communicate in a rule-governed form. Speech involves the production of sounds that allow people to express themselves clearly, and includes voice, resonance quality, articulation, and fluency. Communication encompasses verbal and nonverbal behavior.
Communication disorders and difficulties usually range from mild, such as the occasional misarticulation of words and stuttering, to complete inability to use language and speech for communication. According to the Diagnostic Statistical Manual, Fifth Edition (DSM-5),
3
communication disorders include the following:
Speech sound disorder
4
involves problems with articulation and pronunciation of one's native language. Speech is produced by coordinated, precise muscle action in the neck, head, chest, and abdomen. Speech development involves years of learning how to regulate these muscles to produce comprehensible speech. Language disorder is characterized by difficulties in using and learning language caused by vocabulary and grammar problems, and difficulties putting sentences together in a correct manner. This problem can occur in both the receptive form (understanding language), and the expressive (producing language). Social (pragmatic) communication disorder
5
involves difficulties in the social use of verbal and nonverbal communication in representational contexts. This affects dialog comprehension and social relationship development. Childhood-onset fluency disorder (stuttering) involves interrupted fluency and rhythm of speech. It often causes repetition of whole syllables and words, and sometimes it includes pauses within words, avoidance of pronunciation of difficult words, and/or prolongation of syllables and words. Childhood-Onset Fluency Disorder causes other associated communication problems and may end up interfering with social performance and communication at school or work.
With the DSM-5, 3 communication disorder diagnoses have been made more general so as to include various aspects of communication disorders, emphasizing childhood onset and still differentiating those communication disorders from others (such as autism spectrum disorders).
Epidemiology
According to a 2016 report prepared by National Institute of Deafness and Other Communication Disorders, nearly 1 in 12 U.S. children aged 3–17 years had had a voice, speech, language disorder in that year. This represents 7.7 percent of the population. The data indicate that 0.9 percent experience swallowing difficulties, 1.4 percent have voice difficulties, 3.3 percent suffer from language problems, and 5 percent have speech problems.
There are many health problems that retain good mental and intellectual conditions, and capability of purposeful eye movement. Some conditions potentially assisted by our proposed technology include the following: Locked-in syndrome, 6 akinetic mutism, 7 pseudo-comas, amyotrophic lateral sclerosis, 8 cerebral palsy, 9 spinal cord injury, 10 Rett syndrome, 11 aphasia, 12 stroke, traumatic brain injury, 13 intellectual disability, and various neurological conditions. 14 The potential application of our solution does not end there.
Augmented Reality Communicator
To explore pictogram-based communication between patients and health care professionals, we developed a conceptual prototype and conducted usability and accessibility tests to refine its design.
15
Our tool is an augmented reality application that aids non-native speakers or people with impairments in communicating relevant medical information. It also allows individuals to independently read e-books, surf the Internet, and so on. The only human–computer interface is the movement of the patient's eyes. It provides simple, clear communication by using intuitive icons and interactive symbols that are easy to find by sight. The prototype was implemented using
Our system in the simplest form may consist of a PC/tablet (a) portable device, a precision eye movement sensor (b) mounted as pictured below, a set of pictograms (c) and a specialized application supporting this. The selection of the corresponding pictogram is very simple—the user simply must focus on the pictogram for a specific time (the standard is 5 seconds). If the pictograms are insufficient, the user has a virtual keyboard and alarm icons that produce sound signals (Fig. 1).
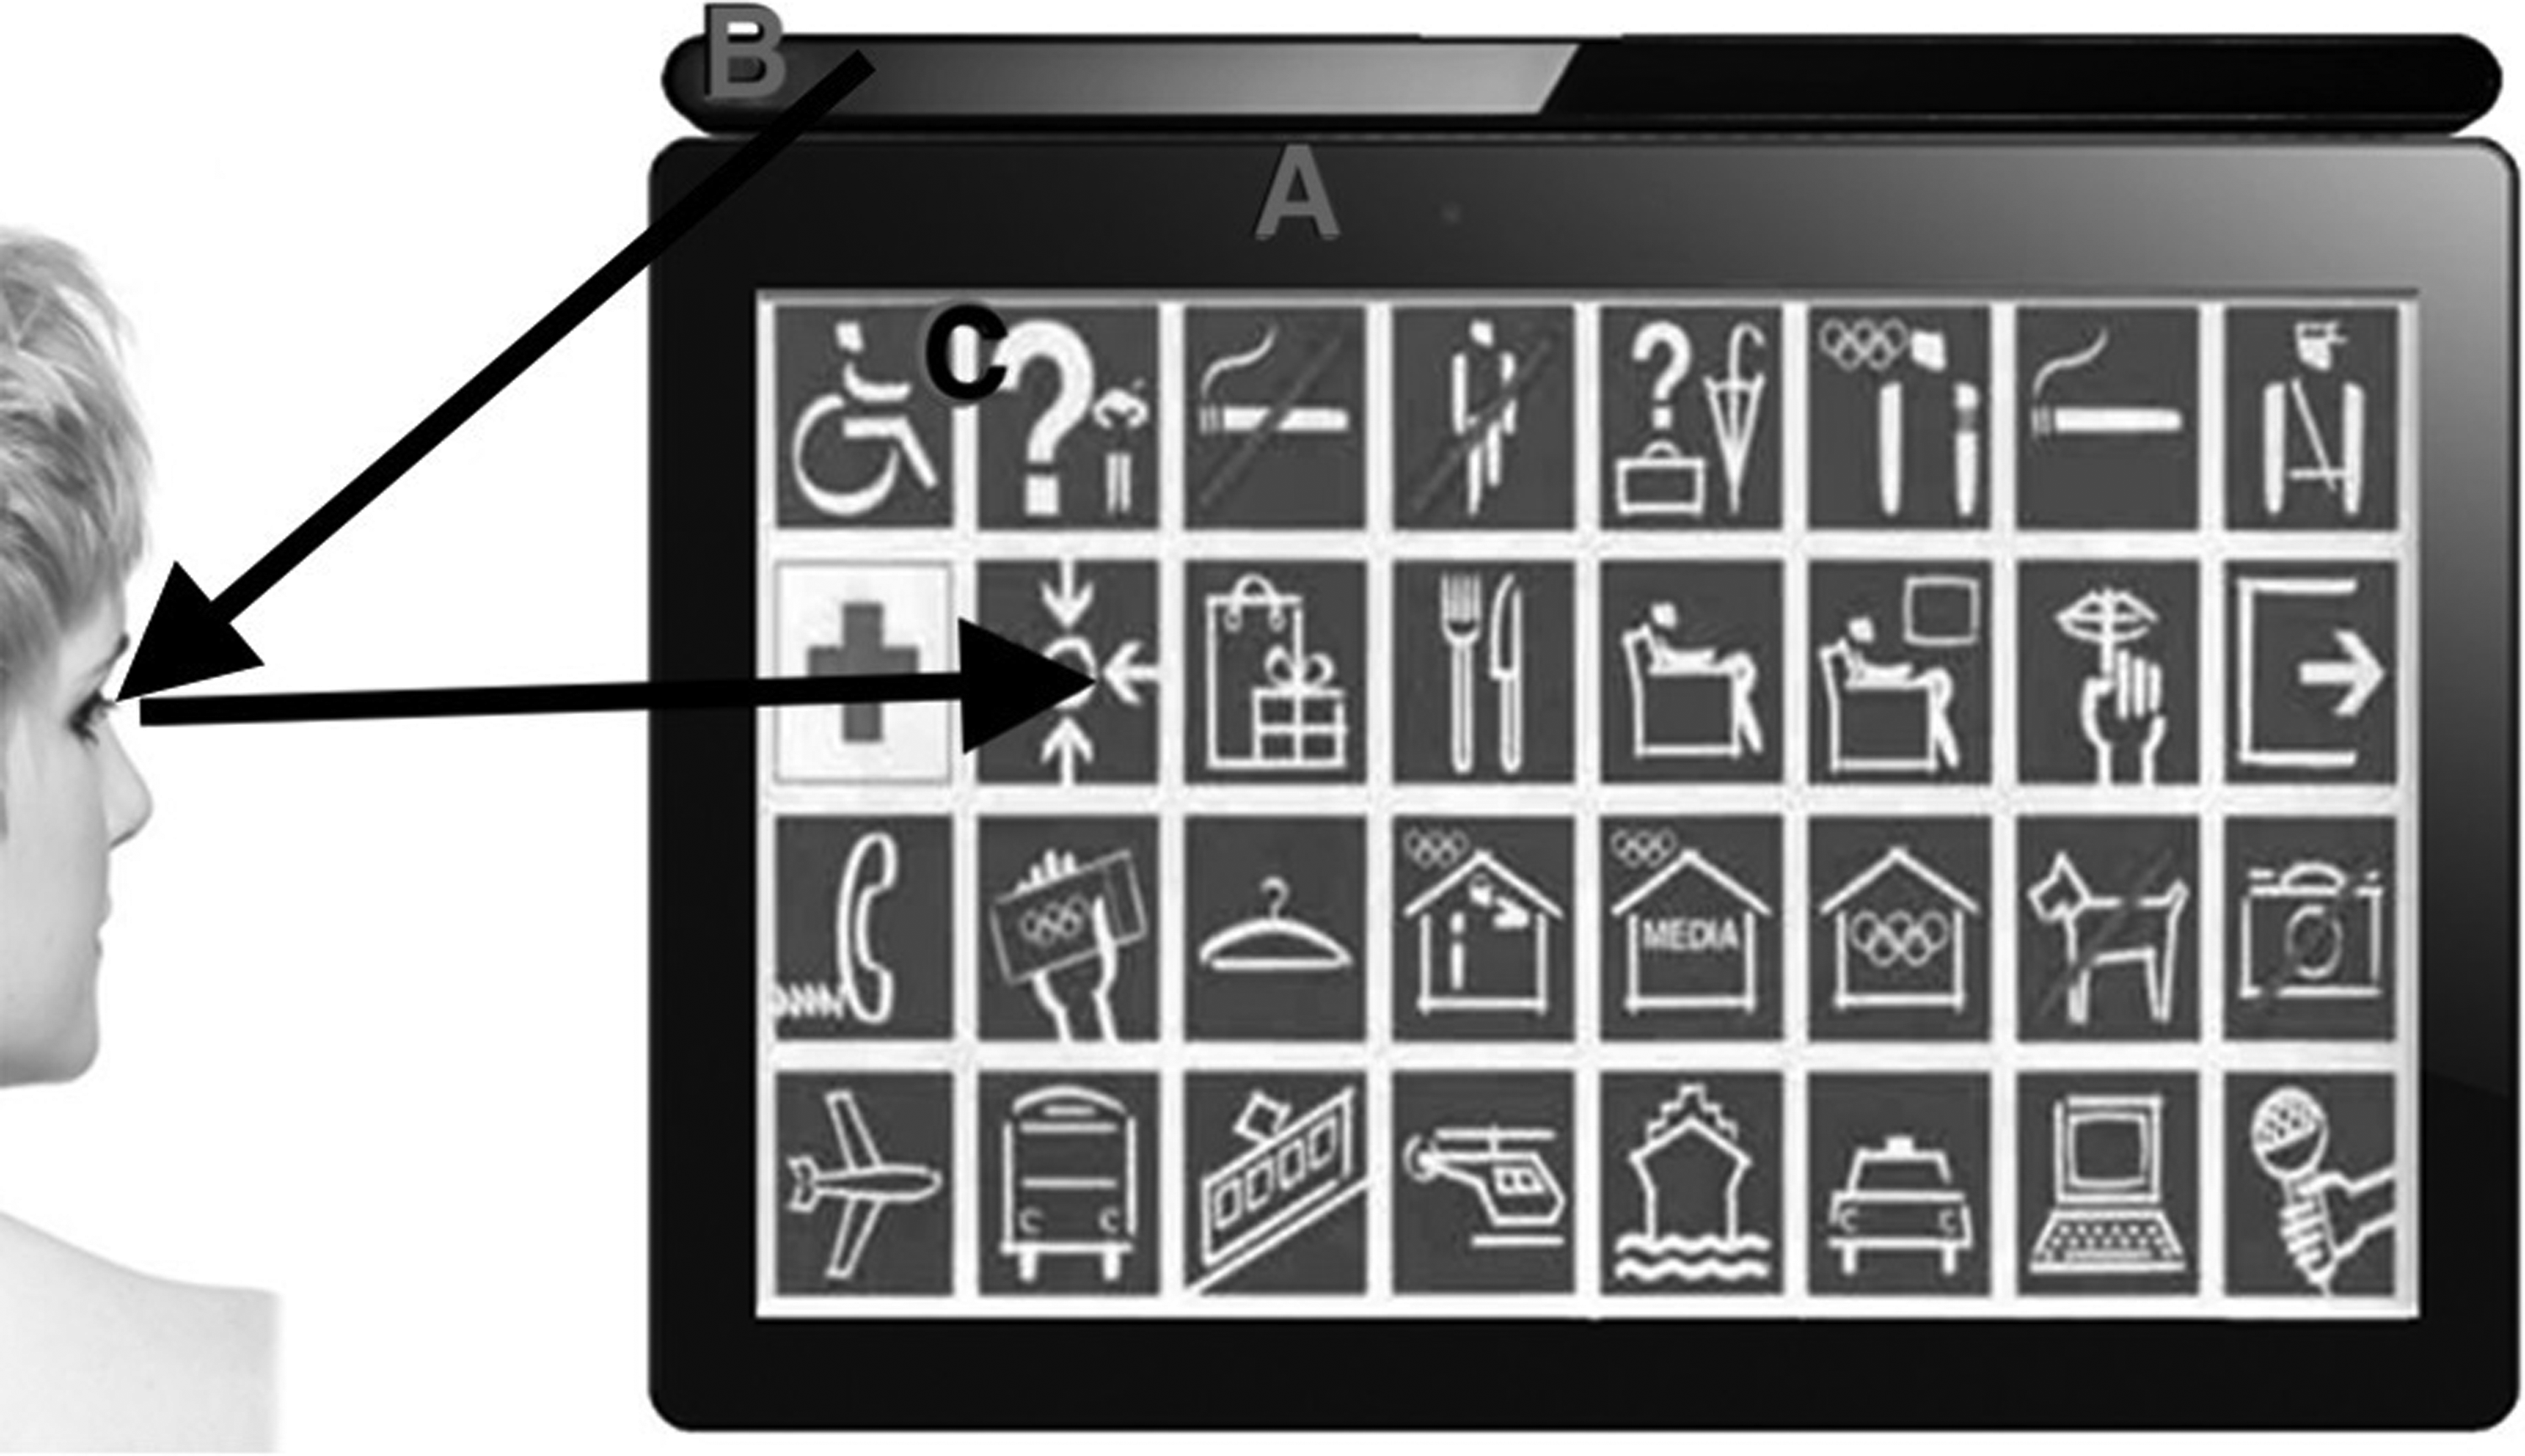
Ideology of our communication system. (
Nonetheless, our goal was to develop a system that would provide greater immersion for its users by augmenting what they can see, and that would eclipse other technologies like text to speech (TTS), 16 automatic speech recognition (ASR), or machine translation (MT). All this is possible using an augmented reality headset built with the current technology (Fig. 2).

Visualization of usage of our glasses.
To improve the precision of our solution, we also use a camera. First, it improves precision in the edges of the interface. Second, the secondary camera is used to track head position and rotation based on nose position. This can help patients who cannot hold their head upright, which would normally cause a regular eye tracker to work inaccurately. Our solution has compensated for this. Finally, our system allows patients with limited eye movement to take advantage of the device by combining head and eye movement (Fig. 3).
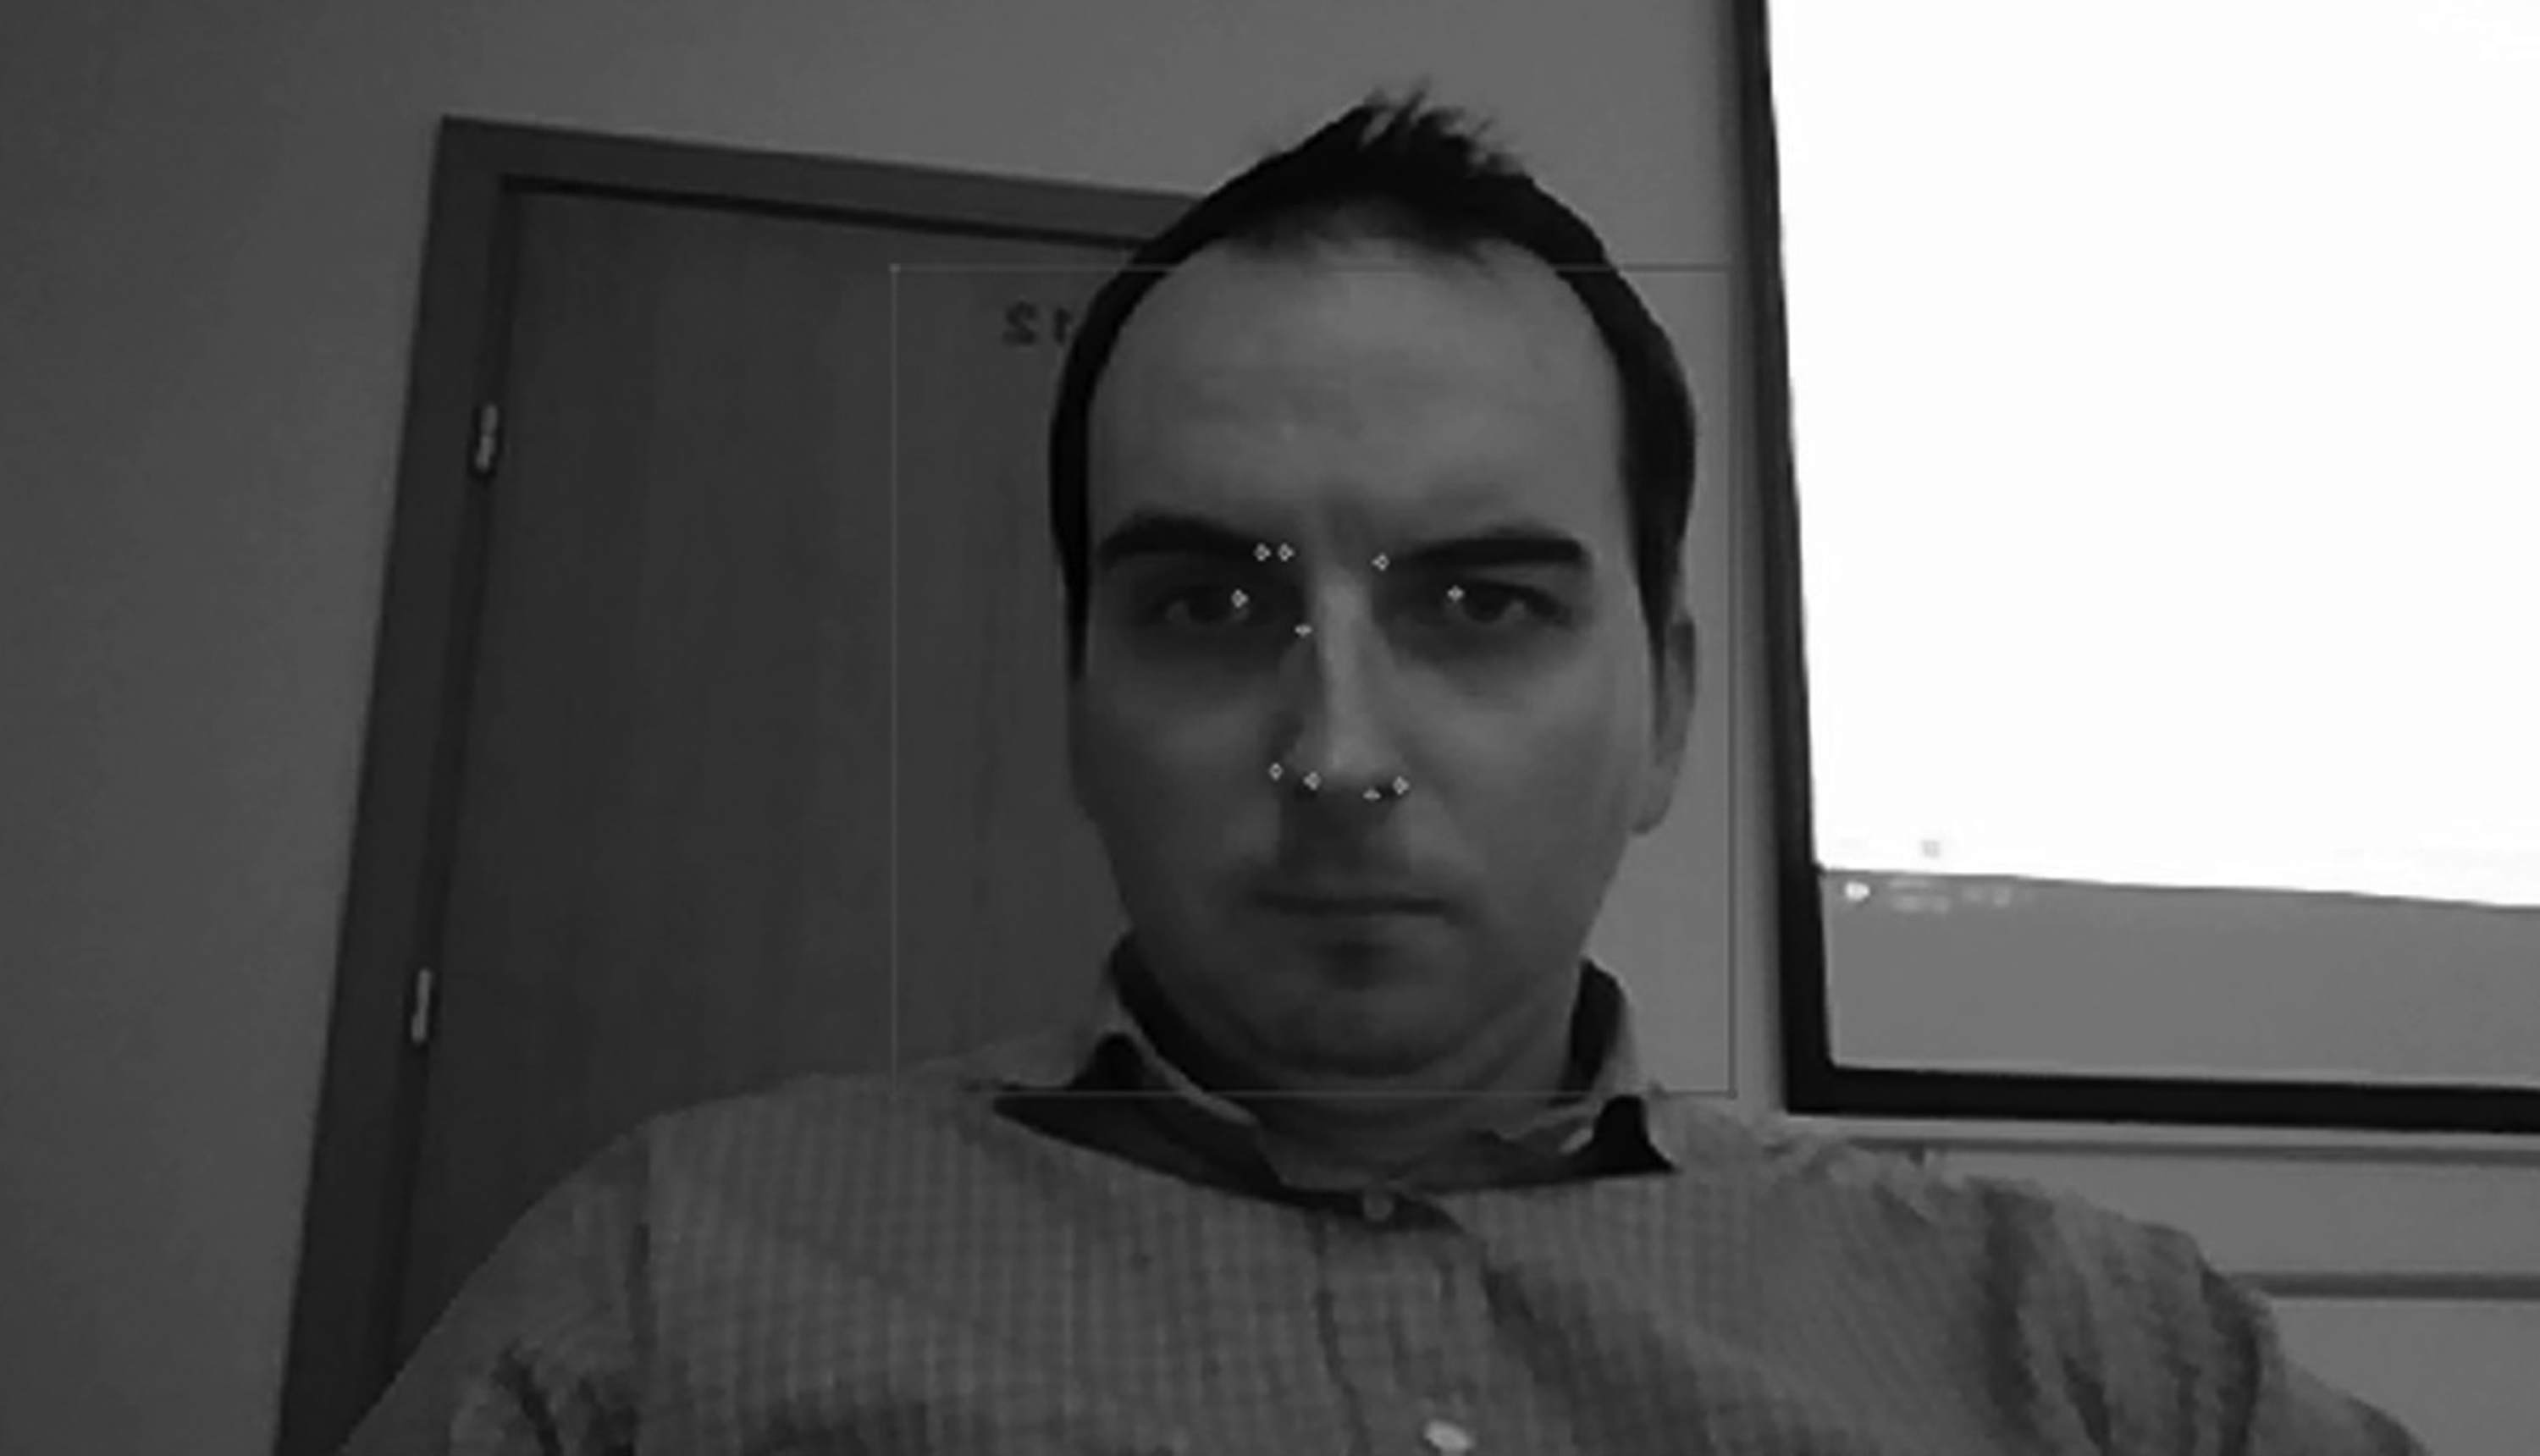
Head position tracking example.
For example, a physician might say something that would be automatically presented as text for patients (the text could even be translated into their language). On their end, the patient can use sight to write a text in his language, and the headset would read it to the doctor in his native language. Some of the most important communication is performed using the specialized pictogram-based interface, which is the main part of our research (Figs. 4 and 5).
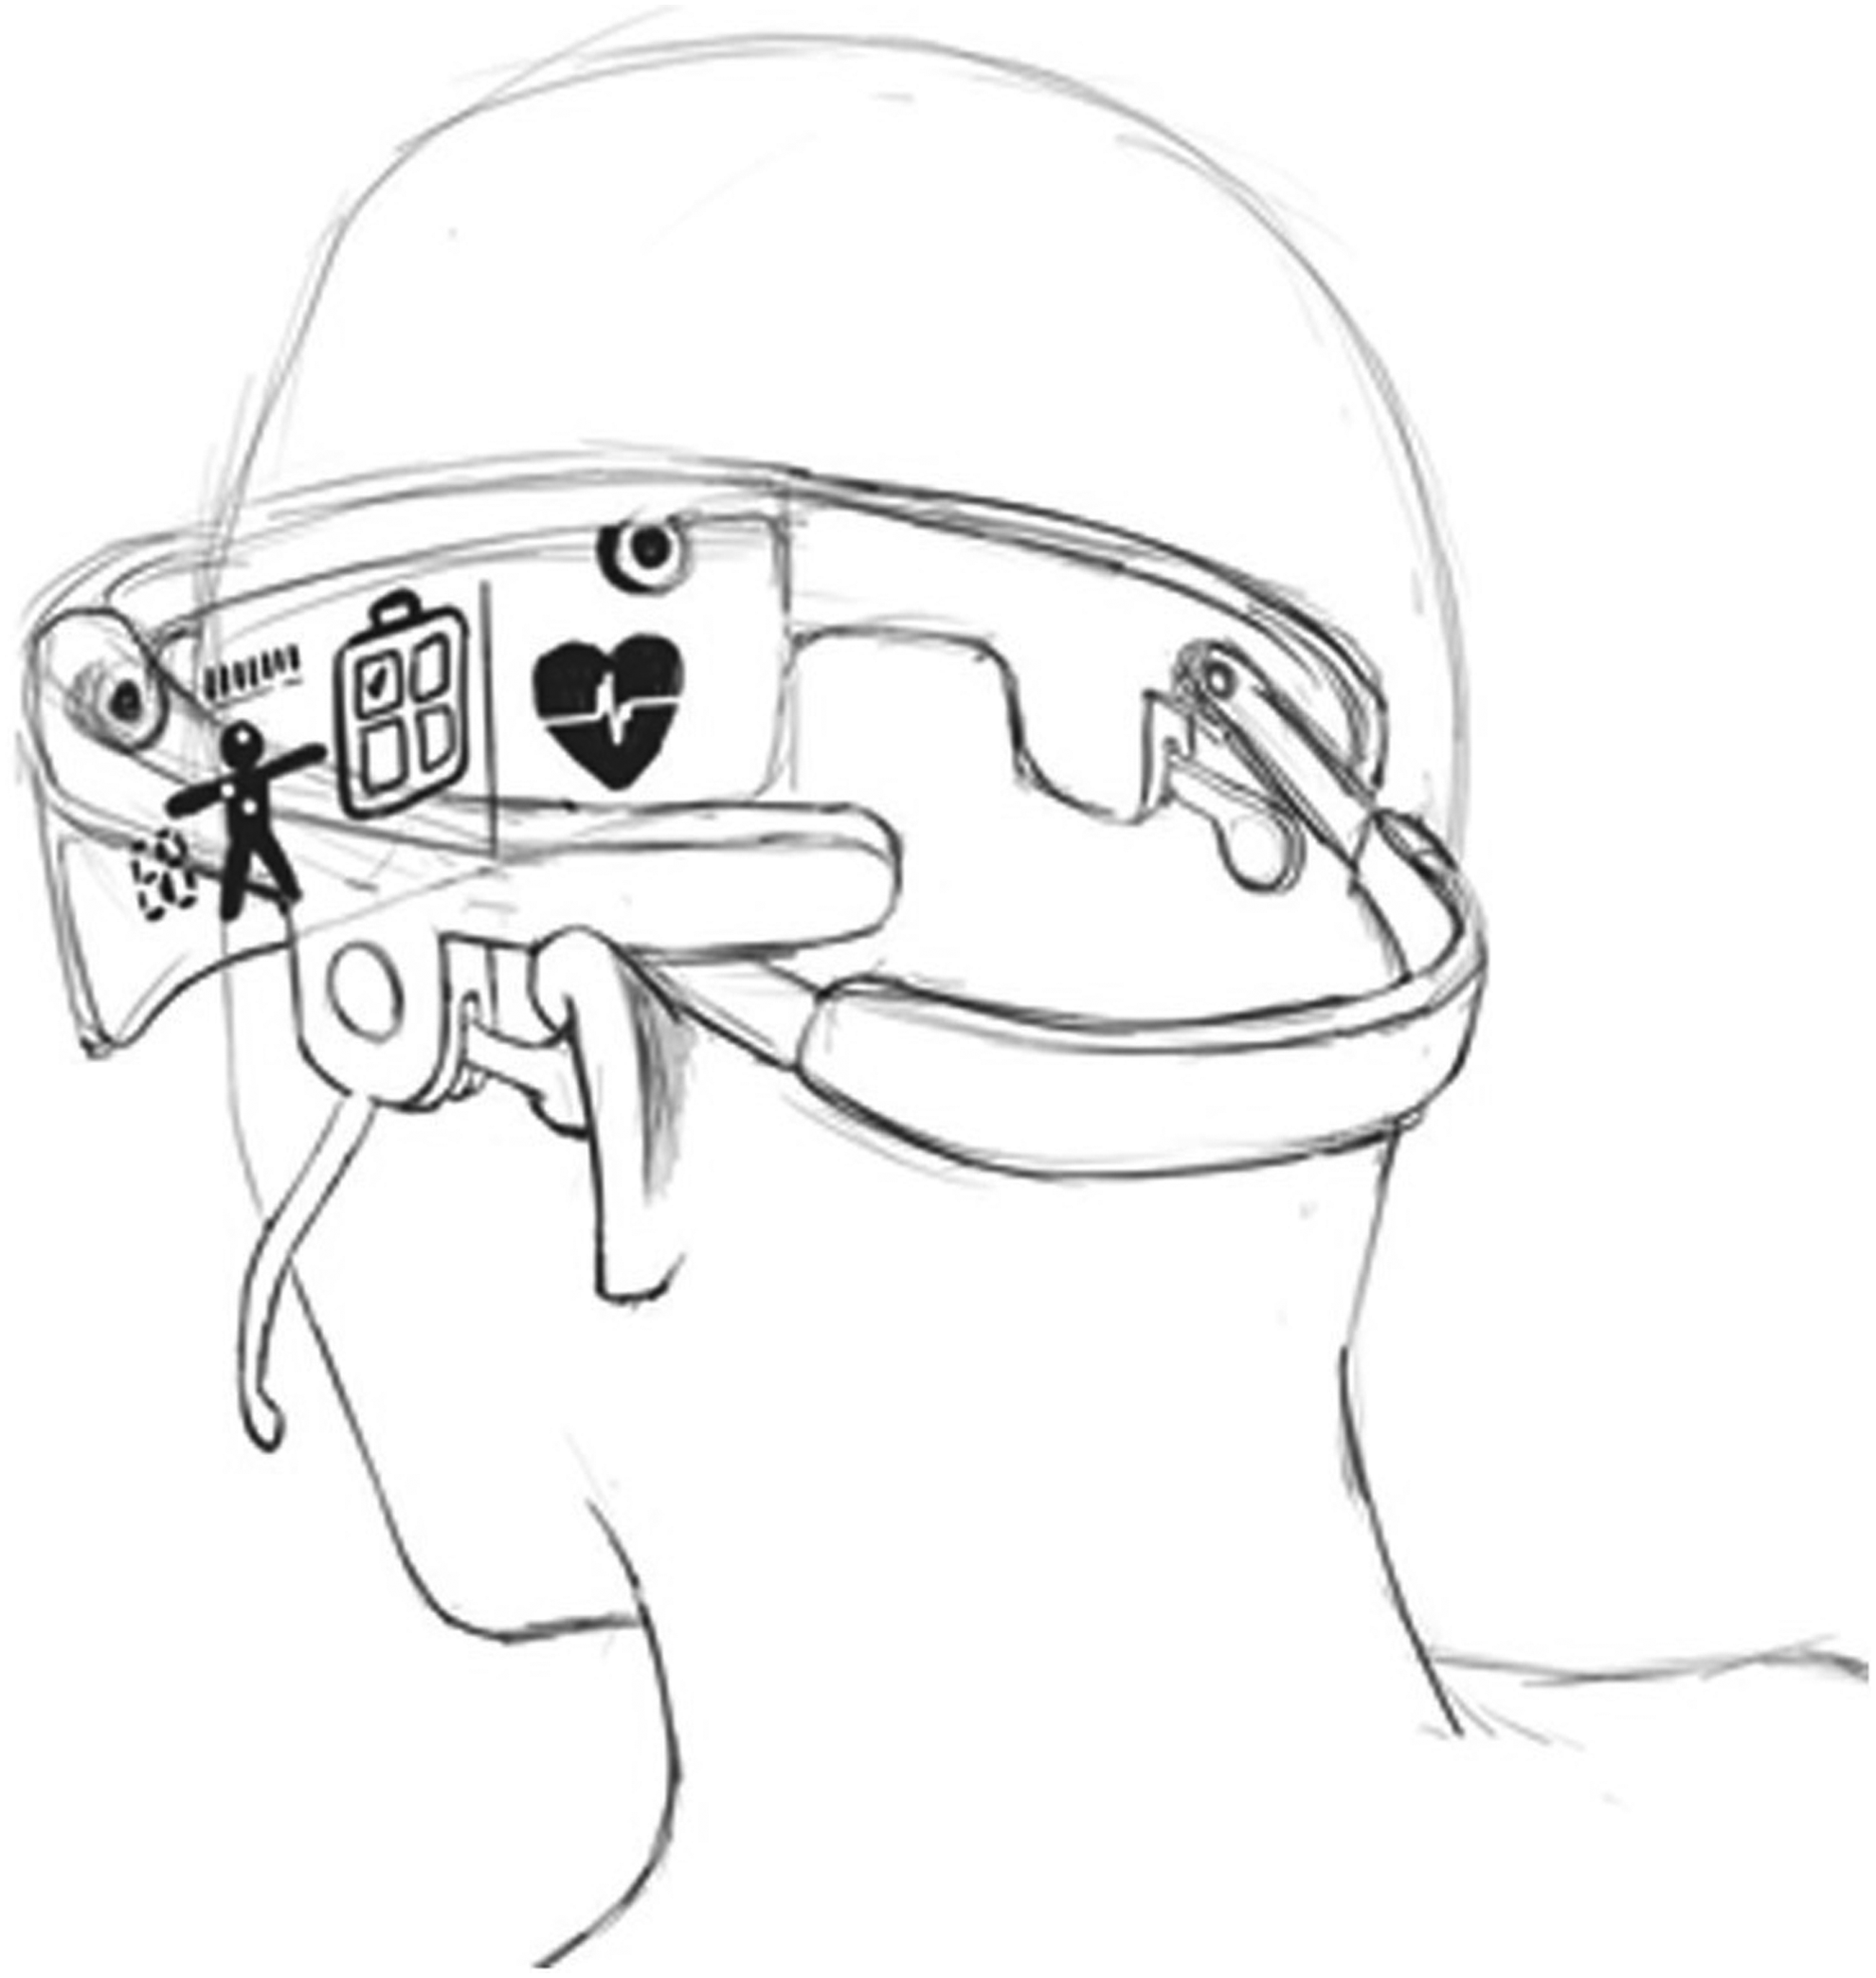
Augmented reality device example.
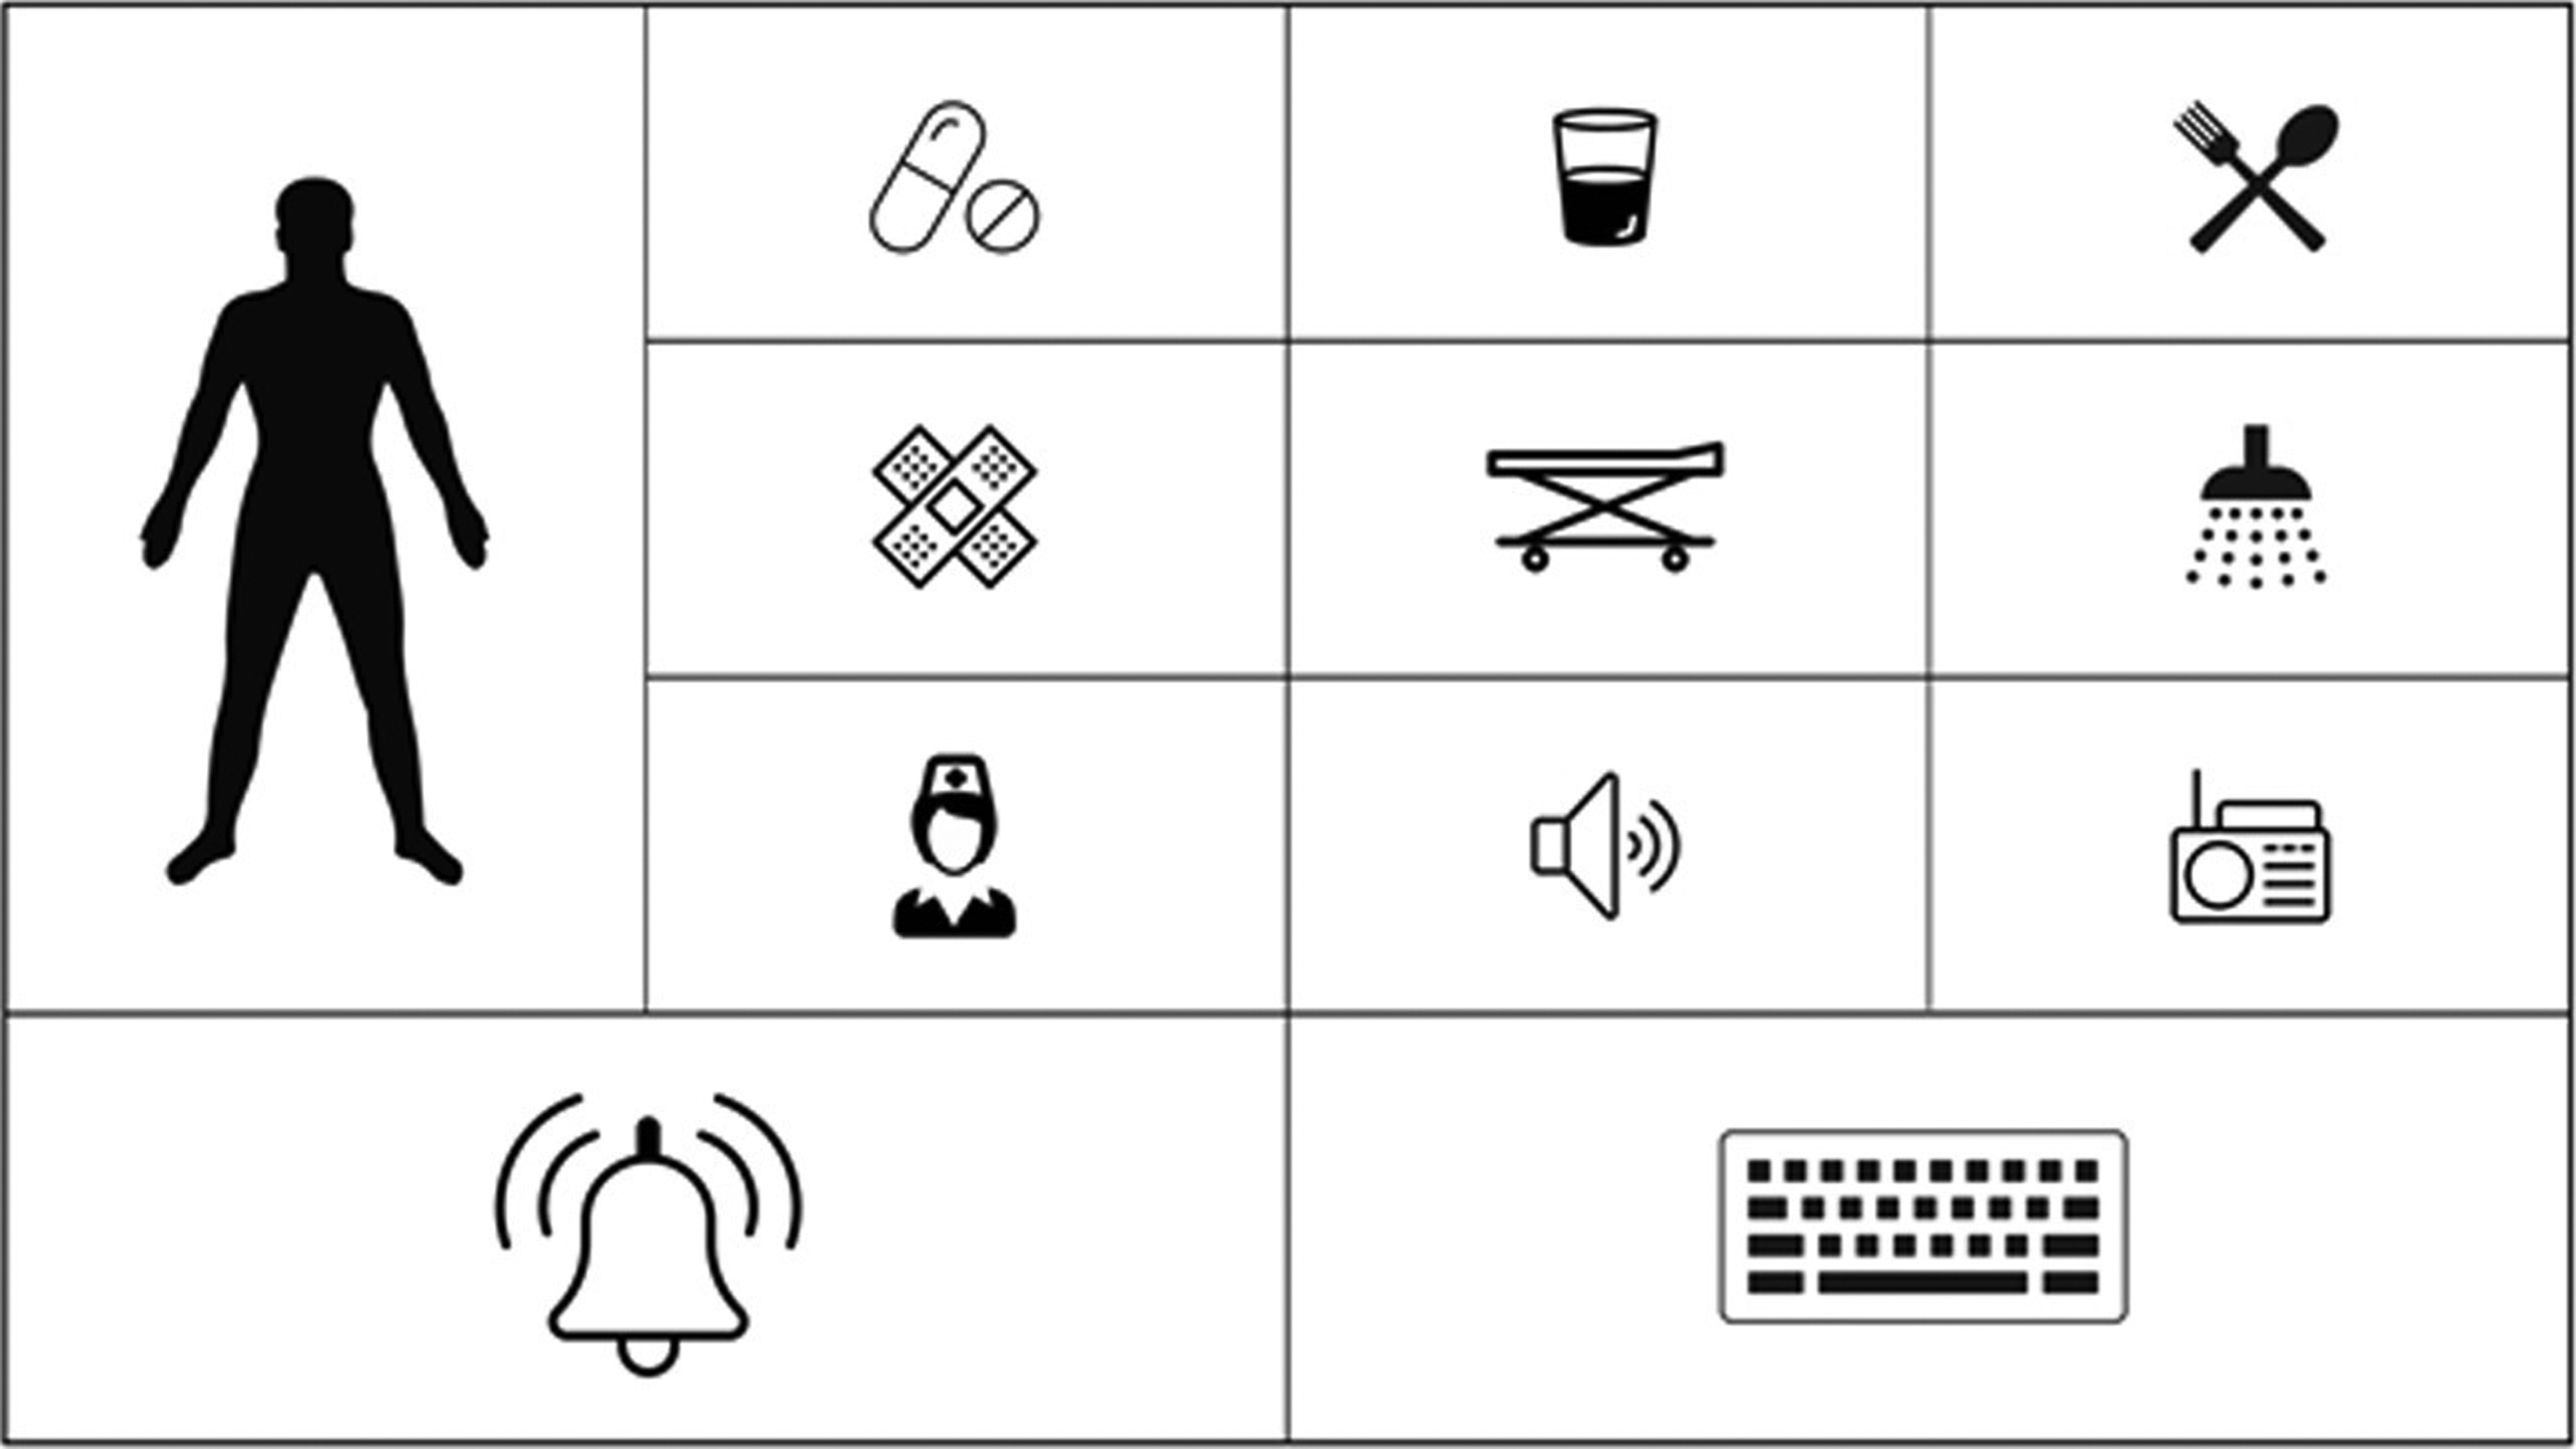
Example of main interface screen.
The task is, of course, much more complex than it sounds. A simplified solution might not be universal over linguistic and cultural divisions; therefore, the choice of pictograms could not be accidental because symbols and their meaning can vary across cultures. The pictograms we designed are intuitive and do not require teaching. They also do not cause cultural or general ambiguity. Their meaning was studied and normalized within the borders of European Union, United States, Russia, Canada, China, India, and Japan.
Another challenge was implementing a proper user interface. We had to define which information is most important, which is less important, and how to group it correctly. We had to deal with the field of view problem, because it may differ depending on the headset, head size, patient age, or sickness that reduces eye movement. Furthermore, we discovered that different nose size and shape may reduce the scope of sensor scanning (Fig. 6).
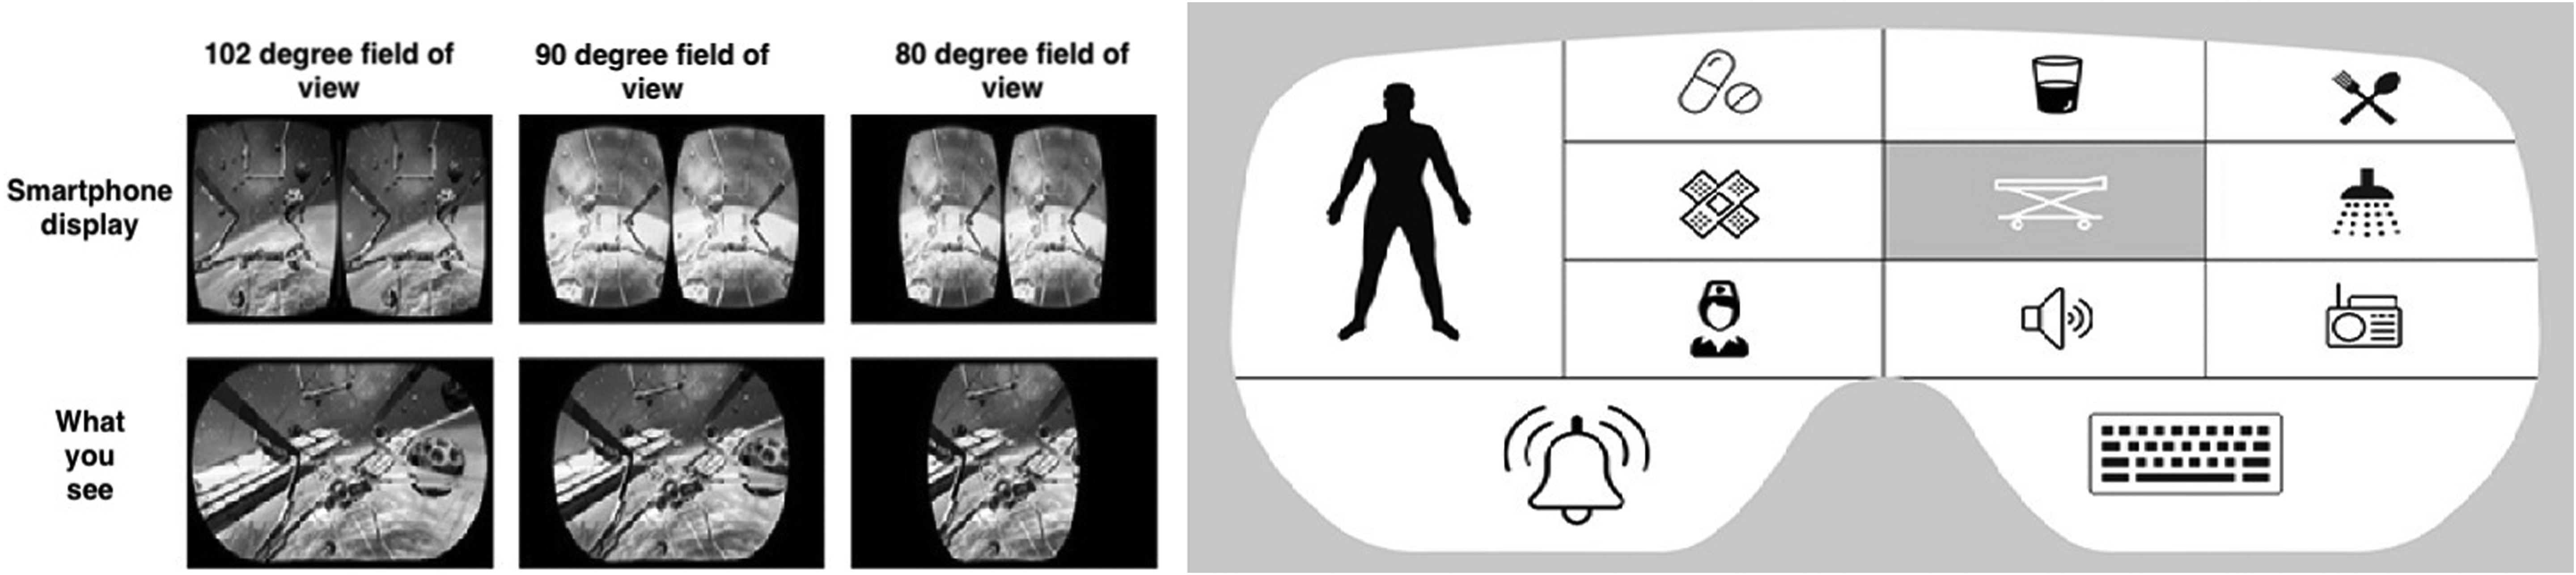
Field of view in different glasses.
All this significantly impacted the application interface size, shape, and organization. Summing up, the device could be described as a light headset similar to thicker sunglasses. It has partially transparent lenses with an OLED display melded into it. This allows augmentation of the users' reality with our pictogram-based interface. On the inner side of the glass frame there is a set of IR sensors and IR led lights that follow the user's gaze. A speaker is embedded, so that the pictogram the patient focuses on would be read and synthesized for the physicians. In addition, for patients with less severe diseases, the device has a microphone and headphones to provide services like TTS, ASR, MT, or even sequence to structure. 17
Such an application would have clear benefits for many users. For example, a person with cognitive disabilities or impairments could very quickly and easily use simple icons to convey basic information about injuries, emotions, pain level, or basic needs to medical personnel. Similarly, medical personnel could use this application to assist someone who is injured or paralyzed. Quick and easy communication is vital in emergency medical situations, especially keeping in mind foreigners and children.
Usability Testing
An iterative paper prototype was developed and evaluated in agreement with the process described by Albert and Tullis 18 during the firth phase of the design of the application and during early brainstorming. Full usability report is available in Supplementary Data. This method relies on creating hand-drawn sketches and simple mock-ups that are then appraised by users. These preliminary usability and accessibility tests helped develop the designs for the patient–physician communicator prototype 19 before it was fully implemented. One important consideration was making sure that patients with impaired eyesight (e.g., cataracts) could still take advantage of this system and recognize the pictograms. The images provide a simple and user-friendly interface while each individual application feature is represented by a pictogram tied intuitively to its specific function. The color scheme and layout are also attractive and simple to avoid eye strain, making it more accessible for patients with visual impairments.
Our usability review of the augmented reality communicator prototype was conducted with the help of 50 people of varying ages and genders, selected randomly and online. The process was conducted remotely in some of the cases, and participants were given the device along with a user manual. The testing was already carried out in an interactive version of the tool that was at first showed in
Mental/intellectual health and postbrain trauma categories accounted for the largest percentage of reported disabilities, each figuring at 33 percent. A further breakdown by mental disability revealed that autism was the next most common, with 34 percent. Of the visual impairments reported by 16 percent of the participants, 40 percent had hyperopia and 30 percent suffered from macular degeneration. Twenty percent had color vision deficiencies, of which protanopia and deuteranopia each shared 50 percent.
Ninety-six percent of the participants were able to complete the three assigned tasks successfully. Ninety-two percent reported completing them without difficulty, and learning disabilities were responsible for 100 percent of the failed tasks. Between all three, the highest percentage of participants took between 31 and 60 seconds to complete each task. On a scale of 1 to 5, with 5 representing “very easy,” most tasks were rated as either 4 or 5 by a significant margin. A similar scale was presented to the participants (1 representing “strongly disagree” and 5 representing “strongly agree”) for four additional statements. Forty-two percent of users reported a score of 5 in answer to a question of whether the function of each button was immediately understood, and 50 percent reported a score of 4 to the same question. In answer to the statement “the buttons were well organized and easy to find,” participants answered with ratings of 4 and 5, at 48 percent for each score. Sixty-six percent found the application easy to navigate with a score of 5, and 28 percent scored the same statement with a score of 4. Finally, 66 percent of users strongly rated their use and impression of the application as positive, with a score of 5, and 32 percent rated it with a score of 4.
To conclude, the results showed that the application functioned well regardless of age, gender, nationality, or disability. There was no correlation present that indicated a need for concern or correction, and overall feedback from the users was highly positive (Fig. 7).
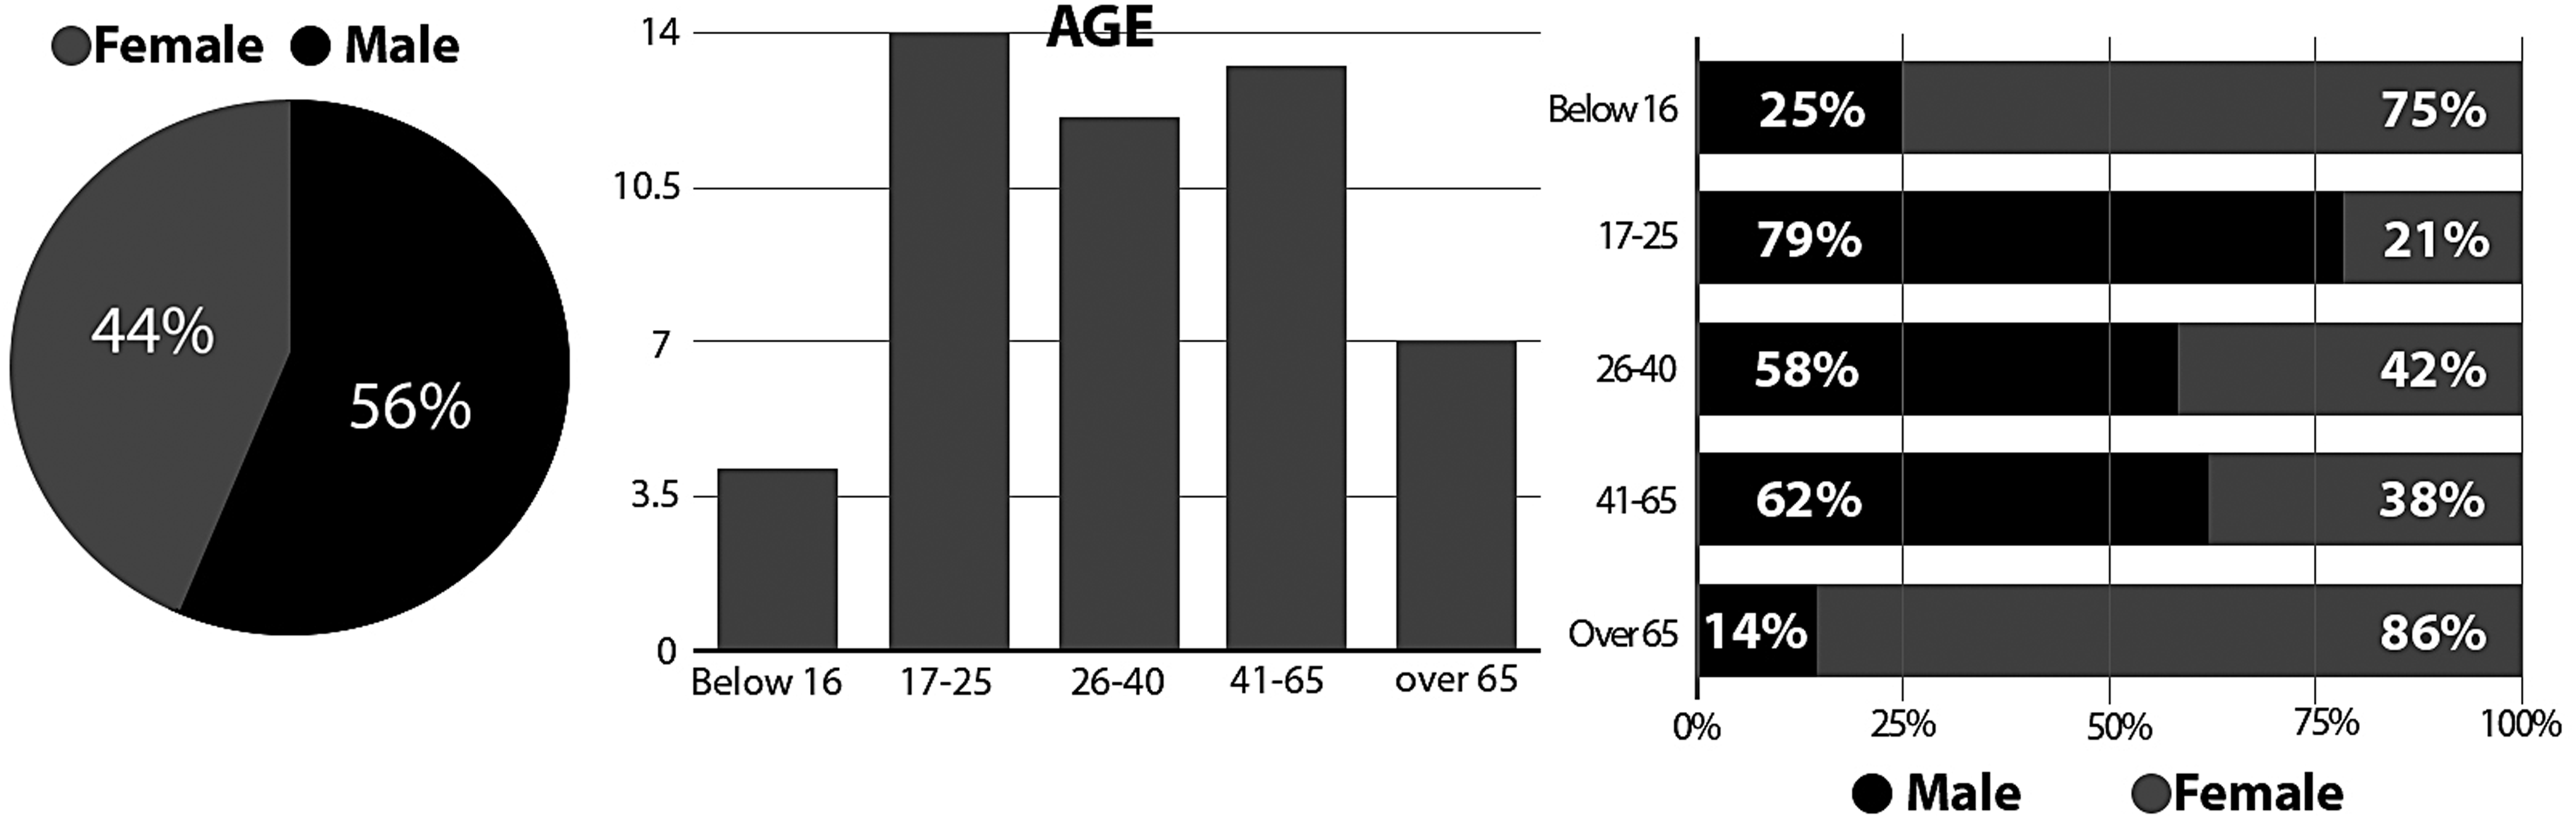
Specifications of test group.
We identified that Poland has the largest majority of each age range besides the under 16 category. As Poland represents 40 percent of the overall percentage, these results are to be expected. Of the 40 percent of Polish users, 50 percent (10) stated they did not have a disability. A total of 10 worldwide users (excluding Poland) declared they did not have a disability.
Tasks
We provided users with three tasks to complete. Each task was analyzed to identify three areas of interest:
Did the user complete the task? How long did it take to complete the task? How easy did they find the task to complete?
The first task was “Select the feature on the application that indicates you require rest.”
In this test, 96 percent of users were able to complete task 1. Fourteen percent of the “over 65” category and 7 percent of the 17–25 age category were unable to complete the task. One hundred percent of users who were unable to complete the task had a disability. One hundred percent of the disabilities were “learning disabilities.” The largest percentage lies within the 26–40 age group and was 31–60 seconds. This was within expectation as this is the average age and average time. The over 65 age group had the highest percentage of time taken with 43 percent. The 17–25 age group had the highest percentage of the fastest time with 57 percent of users completing the task in <30 seconds. The under 16 age category had the highest average of a 4.5 rating. The over 65 category had the lowest average score with 3.6 (Table 1).
From the Data We Can Identify That the Lowest Rating Came from Users with Learning Disabilities (Task 1)
As learning disabilities account for 100 percent of users who did not complete the task, this result is expected. Lowest average—learning disability (1.5), highest average—physical disability (4.8).
The second task was “Select the feature on the application that indicates you have medium pain in your left leg.”
In this test, 100 percent of users were able to complete this task. How long did it take? The largest percentage lies within the over 65 age group, which was >61 seconds. The under 16 and 17–25 age group shared the highest percentage of the fastest time, with 55 percent of users completing it in >30 seconds (Table 2).
From the Data We Can Identify That the Lowest Rating Came from Users with Learning Disabilities (Task 2)
Lowest average—mental disability (2.5), highest average—physical disability (5) and deaf/hearing loss (5).
The third task was “Select the feature on the application that indicates you are hungry.” Of this test, 100 percent of users were able to complete this task. How long did it take? The largest percentage lies within the over 65 age group, and was >61 seconds. The “17–25” group displayed the fastest time with 55 percent of users completing it in <30 seconds (Table 3).
From the Data We Can Identify That the Lowest Rating Came from Users with Learning Disabilities (Task 3)
Lowest average—mental disability (2.5), highest average—physical disability (5) and deaf/hearing loss (5).
Conclusion
A simple picture can help save a person's life. Studies show that images and eye-coded communication are helping patients with serious communication difficulties to receive medical assistance and communicate with other people. Pictograms improve comprehension of medical instructions and information, and supplement written text, especially in cases of patients who can only communicate using their eyes.
The application proposed has worked well with no bias for age, gender, nationality, or disability. Feedback and reviews from users across the board has been extremely positive. Making the application available on smart watches has additionally increased its accessibility. The simple and direct approach of using pictograms in visual communication seems to be an excellent one, as it is appropriate for users with a wide array of disabilities and communication impairments. Patients take to quality visual communication quickly and interpret it naturally.
The approach we have proposed takes full advantage of the incredible versatility and power of visual communication. It is designed to be fast, intuitive, and simple to use, and it is specifically tailored for emergency medical application. There is no knowledge of sign language necessary, no gesture control, and hearing and high cognitive abilities are likewise inessential. The potential of our approach has been tested and demonstrated in an initial usability review.
Footnotes
Author Disclosure Statement
No competing financial interests exist.
References
Supplementary Material
Please find the following supplemental material available below.
For Open Access articles published under a Creative Commons License, all supplemental material carries the same license as the article it is associated with.
For non-Open Access articles published, all supplemental material carries a non-exclusive license, and permission requests for re-use of supplemental material or any part of supplemental material shall be sent directly to the copyright owner as specified in the copyright notice associated with the article.