




Abstract
Fitbit wearable devices provide users with objective data on their physical activity and sleep habits. However, little is known about how users develop their usage patterns and the key mechanisms underlying the development of such patterns. In this article, we report results from a longitudinal analysis of Fitbit usage behavior among a sample of college students. Survey and Fitbit data were collected from 692 undergraduates at the University of Notre Dame across two waves. We use a structural equation modeling strategy to examine the relationships among three dimensions of Fitbit usage behavior corresponding to three elements of the habit loop model: trust in the accuracy of Fitbit physical activity and sleep data (cue), intensity of Fitbit device use (routine), and adjustment of physical activity and sleep behaviors based on Fitbit data (reward). More than 75 percent of participants trusted the accuracy of Fitbit data and nearly half of the participants reported they adjusted their physical activities based on the data reported by their devices. Participants who trusted the Fitbit physical activity data also tended to trust the sleep data, and those who intensively used Fitbit devices tended to adjust both their physical activities and then sleep habits. Psychological states and traits such as depression, extroversion, agreeableness, and neuroticism help predict multiple dimensions of Fitbit usage behaviors. However, we find little evidence that trust, Fitbit usage, or perceived adjustment of activity or sleep were associated with actual changes in levels of sleep and activity. We discuss the implications of these findings for understanding when and how this new monitoring technology results in changes in people's behavior.
Introduction
Existing research has provided evidence that Fitbit devices can drive users to overexercise.1–3 As a well-designed product, Fitbit devices can trigger obsession and even addiction, as research on other wearable devices such as the Apple Watch has shown. 4 However, to our knowledge there is no peer-reviewed study to date looking into whether Fitbit usage behavior can lead to similar outcomes.
In this study we examine the mechanisms underlying Fitbit usage behavior among a sample of college students. We adopt habit loop theory to explain how Fitbit usage behavior is developed: first there are cues that stimulate the behavior, next the behavior is adopted and/or reinforced as a routine, and then the behavior delivers a reward that makes replicating the behavior in the future desirable; over time the behavior becomes more automatic and ingrained as people keep repeating the loop while putting little or no conscious thought into it.4–6
Nowadays, successful designers of technology products are also successful designers of behavior. Fitbit devices provide external cues containing detailed physical activity and sleep information likely to influence what the user will do next: Should I trust the accuracy of data? Should I check the data frequently? Should I set a daily goal for myself? If so, should I achieve the goal whatever happens that day? When I meet a goal, should I show off achievement on social media? Should I adjust physical activity and sleep habits based on the data?
Moreover, the user's psychological profile can act as an internal cue linking Fitbit data to his/her feelings, emotions, thoughts, and desires.
For example, not only are heavy Internet user likely to be heavy smartphone users,7,8 they share common psychological characteristics, including higher levels of neuroticism, loneliness, and depression and lower levels of extraversion, self-esteem, and self-regulation.9–14 Previous research suggests that those using wearable devices to habitually monitor their behavior develop a reinforcing cue–routine–reward loop that keeps them more engaged and even addicted to the feedback (cues) provided by the devices. 4 Therefore, users' psychological needs are enhanced by getting continuously updated data to keep self-motivated, stay physically active and healthy, set/accomplish goals that make them feel capable of meeting challenges, and receive social support from family and friends.
Consistent with habit loop theory,4–6 we measure three dimensions of Fitbit usage behavior from the self-reports of 692 college students over two time points: (1) the external cue: to what extent they trusted the accuracy of Fitbit physical activity and sleep data; (2) the routine: how intensely they used the Fitbit devices; and (3) the reward: whether they adjusted physical activities or sleep habits based on Fitbit data. First, we expect temporal stability on each dimension of Fitbit usage behavior.
H1: If a Fitbit user scores high on one dimension of Fitbit usage behavior (e.g., accuracy trust, use intensity, behavioral adjustment) at time 1, s/he will score high on that dimension at time 2.
Because the three dimensions are part of a connected reinforcing process, increases in one dimension should lead to increases in the other dimensions.
H2: If a Fitbit user scores high on one dimension of Fitbit usage behavior at time 1, s/he will score high on the other two dimensions at time 2.
In this study we also collected Fitbit physical activity and sleep data. The body of literature linking Fitbit devices with overexercise1,2 indicates the cue–routine–reward loop can lead to a vicious cycle of increasing activity.
H3: The higher a user scores on three dimensions of Fitbit usage behavior at time 1, the more physically active s/he will be at time 2.
Finally, as noted earlier, engagement in the cue–routine–reward loop is more or less likely for users with certain psychological traits and dispositions.
H4: Users who score high on neuroticism, feel depressed, or feel lonely will score high on three dimensions of Fitbit usage behavior, whereas those who score high on extraversion, have higher self-esteem, and have higher levels of self-regulation are less likely to do so.
By testing these four hypotheses, this study will contribute to our understandings about Fitbit usage behavior and its association with psychological traits.
Methods
Participants
In Fall 2015 the University of Notre Dame admitted 2,007 freshmen, including 1,069 men and 938 women. Since the study population was predominantly white and Catholic, the NetHealth project team adopted a stratified sampling strategy to select 692 freshmen based on a specific percentage of each gender-race-religious preference strata and enrolled them for 2 years in the study.15,16 This project was approved by the Institutional Review Board at the University of Notre Dame in 2015. All participants signed informed consents.
Procedure
The participants received a new Fitbit Charge HR wristband and installed official Fitbit app on their smartphones. Whenever the app was active, data on physical activities and sleep habits were backed up to the Fitbit cloud and then synchronized to a server maintained by the project team. The participants also installed an app developed by the project team on their smartphones to back up communication events including voice calls and text messages, the contents of which were not stored. Participants also took a survey every semester.
Measures
The main dependent variables come from the surveys in Winter 2016 and Summer 2016, with response rates of 75.3 percent and 73.4 percent, respectively. We repeatedly measured a participant's three dimensions of Fitbit usage behavior, that is, whether s/he:
(1) trusted the accuracy of Fitbit physical activity or sleep data (from “1-Not accurate at all” to “4-Very accurate”);
(2) intensively used Fitbit device (a latent factor derived from 13 items, including the frequency in a typical week a user checked steps, heart rate, calories burned, miles walked/jogged/run, floors/stairs climbed, active minutes, sleep data, the frequency in a typical day the user checked Fitbit data during nonexercising time, and whether the user used various functions including setting a goal, sharing data on social media and with friends and family members, and creating challenges for himself/herself and with friends and family members; Comparative Fit Index or CFI = 0.92, Tucker–Lewis Index or TLI = 0.88, standardized root-mean-square residual or SRMR = 0.06, root-mean-square error of approximation or RMSEA = 0.08 during Winter 2016; CFI = 0.93, TLI = 0.90, SRMR = 0.05, RMSEA = 0.07 during Summer 2016; and
(3) indicated that s/he has adjusted his/her physical activity or sleep habit based on Fitbit data (“0-No” and “1-Yes”).
To test Hypothesis 3, we used physical activity and sleep duration collected through Fitbit devices. We used 18 items measuring physical activity, including low range calories/minutes, fat burn calories/minutes, cardio calories/minutes, peak calories/minutes, steps, floors, sedentary minutes, lightly active minutes, fairly activity minutes, very active minutes, marginal calories, activity calories, calories in basal metabolic rate, and calories out. (More details are available from the
As in another Fitbit study, 16 we set the compliant percentage's threshold at 80 percent to avoid underestimating the user's physical activity and sleep duration that day. After the threshold is applied, we generate a daily physical activity variable as a standardized factor score from the foregoing 18 items (α = 0.88) and compute the means and standard deviations of daily physical activity and sleep minutes for each participant between the 90 days before the survey date and the date s/he took Winter 2016 survey and Summer 2016 survey. We pick the period length of 90 days so that each time window contains a sufficient number of days in which the participant was on campus and on break and the two time windows do not overlap.
Individual psychological traits were collected in Winter 2016 survey. Based on the big five factors in personality trait ratings, 17 extraversion was included as a latent factor derived from 8 items (CFI = 0.93, TLI = 0.90, SRMR = 0.06, RMSEA = 0.08), agreeableness from 9 items (CFI = 0.96, TLI = 0.95, SRMR = 0.04, RMSEA = 0.05), conscientiousness from 9 items (CFI = 0.98, TLI = 0.96, SRMR = 0.04, RMSEA = 0.04), neuroticism from 8 items (CFI = 0.90, TLI = 0.85, SRMR = 0.07, RMSEA = 0.08), and openness from 10 items (CFI = 0.83, TLI = 0.77, SRMR = 0.08, and RMSEA = 0.09).
We included depression as a latent factor derived from 20 items in the Center for Epidemiologic Studies Depression Scale (CFI = 0.88, TLI = 0.86, SRMR = 0.10, RMSEA = 0.07), 18 self-regulation on physical activity as a latent factor derived from 16 items regarding “Motivation for Exercise” in the Exercise Self-Regulation Questionnaire (CFI = 0.91, TLI = 0.85, SRMR = 0.08, RMSEA = 0.08), 19 general self-regulation as a latent factor derived from 12 items in the Self-Regulation Questionnaire (items 6, 8, 20, 30, 33, 34, 35, 40, 42, 45, 47, and 62; CFI = 0.93, TLI = 0.90, SRMR = 0.06, RMSEA = 0.06), 20 self-esteem as a latent factor derived from 10 items (CFI = 0.97, TLI = 0.96, SRMR = 0.04, RMSEA = 0.06), 21 and loneliness as a latent factor derived from 15 items in the Social and Emotional Loneliness Scale for Adults (CFI = 0.85, TLI = 0.69, SRMR = 0.10, RMSEA = 0.13). 22
The covariates include the participant's gender (1 = Men, 2 = Women), race (1 = White, 2 = Latino, 3 = Black, 4 = Asian, 5 = Other), religious preference (1 = Catholic, 2 = Protestant, 3 = Other religion, 4 = No religion), body mass index (BMI; weight/height 2 ), to what extent the participant had confidence in stating that if s/he wanted s/he could be more physically active or get enough sleep (from “1-Definitely false” to “7-Definitely true”), body-image index (to what extent the participant was satisfied with his/her physical appearance; from “1-Very dissatisfied” to “7-Very satisfied”) collected through surveys, and nodal degree (i.e., how many other participants the focal participant communicated with during the first 90-day period) from the smartphone app.
We include race and religious preference as the majority (whites and Catholics) and the minority (nonwhites and non-Catholics) might have different Fitbit usage patterns.
Statistical analysis
We estimate a structural equation model (SEM) using Stata V15.0. SEM is ideal for several reasons.
First, our dependent variables have multiple causes and our selected psychological traits and covariates have multiple outcomes, all of which work interactively and dynamically following multiple pathways. SEM allows us to test all four hypotheses efficiently by specifying causal paths between antecedents and outcomes simultaneously.
Second, SEM produces standardized path coefficients that can be compared directly with one another 23 making the interpretation of the results easier.
Third, SEM allows for a structural error term for an endogenous construct to be correlated with other structural error terms, thereby partialling out the shared common variance not explained by the model. The inclusion of correlated error terms can reduce bias in parameter estimates and improve confidence interval coverage as well as model fit.24,25
Fourth, SEM handles missing data efficiently, takes advantage of all cases through full information maximum likelihood, and produces unbiased parameter estimates and standard errors when values are missing at random or missing completely at random.26,27
Finally, SEM can test the overall fit of the model. In this study, we use CFI and RMSEA to evaluate model fit, both of which are found to be robust to sample size biases. 28
Results
Descriptive statistics
Table 1 shows that most participants were women (52 percent), whites (65 percent), and Catholics (73 percent). Regarding accuracy trust and behavioral adjustment owing to Fitbit data, based on Summer 2016 survey, most believed that the Fitbit data were very accurate or pretty accurate most of the time (78 percent for physical activity data and 76 percent for sleep data) and did not change their activity based on the Fitbit data (51 percent for physical activity and 88 percent for sleep).
Descriptive Statistics of Control Variables and Dependent Variables
BMI, body mass index.
The average compliance percentage was 85.6 percent (SD = 21.4 percent) during Winter 2016 and 86.5 percent (SD = 21.2 percent) during Summer 2016. During Winter 2016 an average participant slept about 417 minutes a day, with a standard deviation of 141 minutes. The mean increased 16 minutes and the standard deviation decreased 13 minutes during Summer 2016.
An average participant had a BMI of 23 and a body-image score of 4 on a 7-point scale, communicated with 16 other participants, and were more confident in being more physically active than getting enough sleep (i.e., 6 vs. 4 on a 7-point scale).
Table 2 shows that the participants used Fitbit devices more intensively during Winter 2016 than during Summer 2016 on 11 of the 13 items, except for sharing data on social media and with family and friends.
Descriptive Statistics of 13 Items Used to Construct Measure of Fitbit Device Usage Intensity
SEM estimates
We apply CFI (ideally >0.95; >0.90 is good) and RMSEA (ideally <0.06; 0.06–0.08 is good) as criteria indicating whether a given model fits the observed data. 29 In addition, we use TLI (ideally >0.95; the higher, the better) and SRMR (ideally <0.08; the lower, the better) along with Akaike Information Criterion (the lower, the better) and Bayesian Information Criterion (the lower, the better) to select the best-fitting model among its variants.
Table 3 provides the goodness-of-fit indices from the baseline model, the baseline model +10 psychological variables (as given in Fig. 1), and the baseline model +10 psychological variables (as given in Fig. 1) + 13 covariates (as given in Fig. 2). Our selected SEM adequately fits the observed data (χ 2 = 1,738.03, p < 0.001; CFI = 0.96, TLI = 0.96, RMSEA = 0.06, SRMR = 0.08). We present the model's parameter estimates that are statistically significant (i.e., p < 0.05) in Figures 1 and 2 to avoid overlapping findings. Positive and statistically significant coefficient paths are shaded red, whereas negative effect paths are blue.

SEM of dependent variables with psychological traits. Notes: pa_accuracy—trust in the accuracy of Fitbit physical activity data; sleep_accuracy—trust in the accuracy of Fitbit sleep data; Usage_intensity—intensity of Fitbit device usage; pa_adjustment—adjustment of physical activity; sleep_adjustment—adjustment of sleep habit; avg_daily_pa—average of daily physical activity; sd_daily_pa—standard deviation of daily physical activity; avg_sleepmins—average of sleep minutes; sd_sleepmins—standard deviation of sleep minutes; t1—Winter 2016; t2—Summer 2016; Self_regulation_pa—self-regulation on physical activity; General_self_regulation—general self-regulation; Self_esteem—self-esteem. Results from the full model are available from
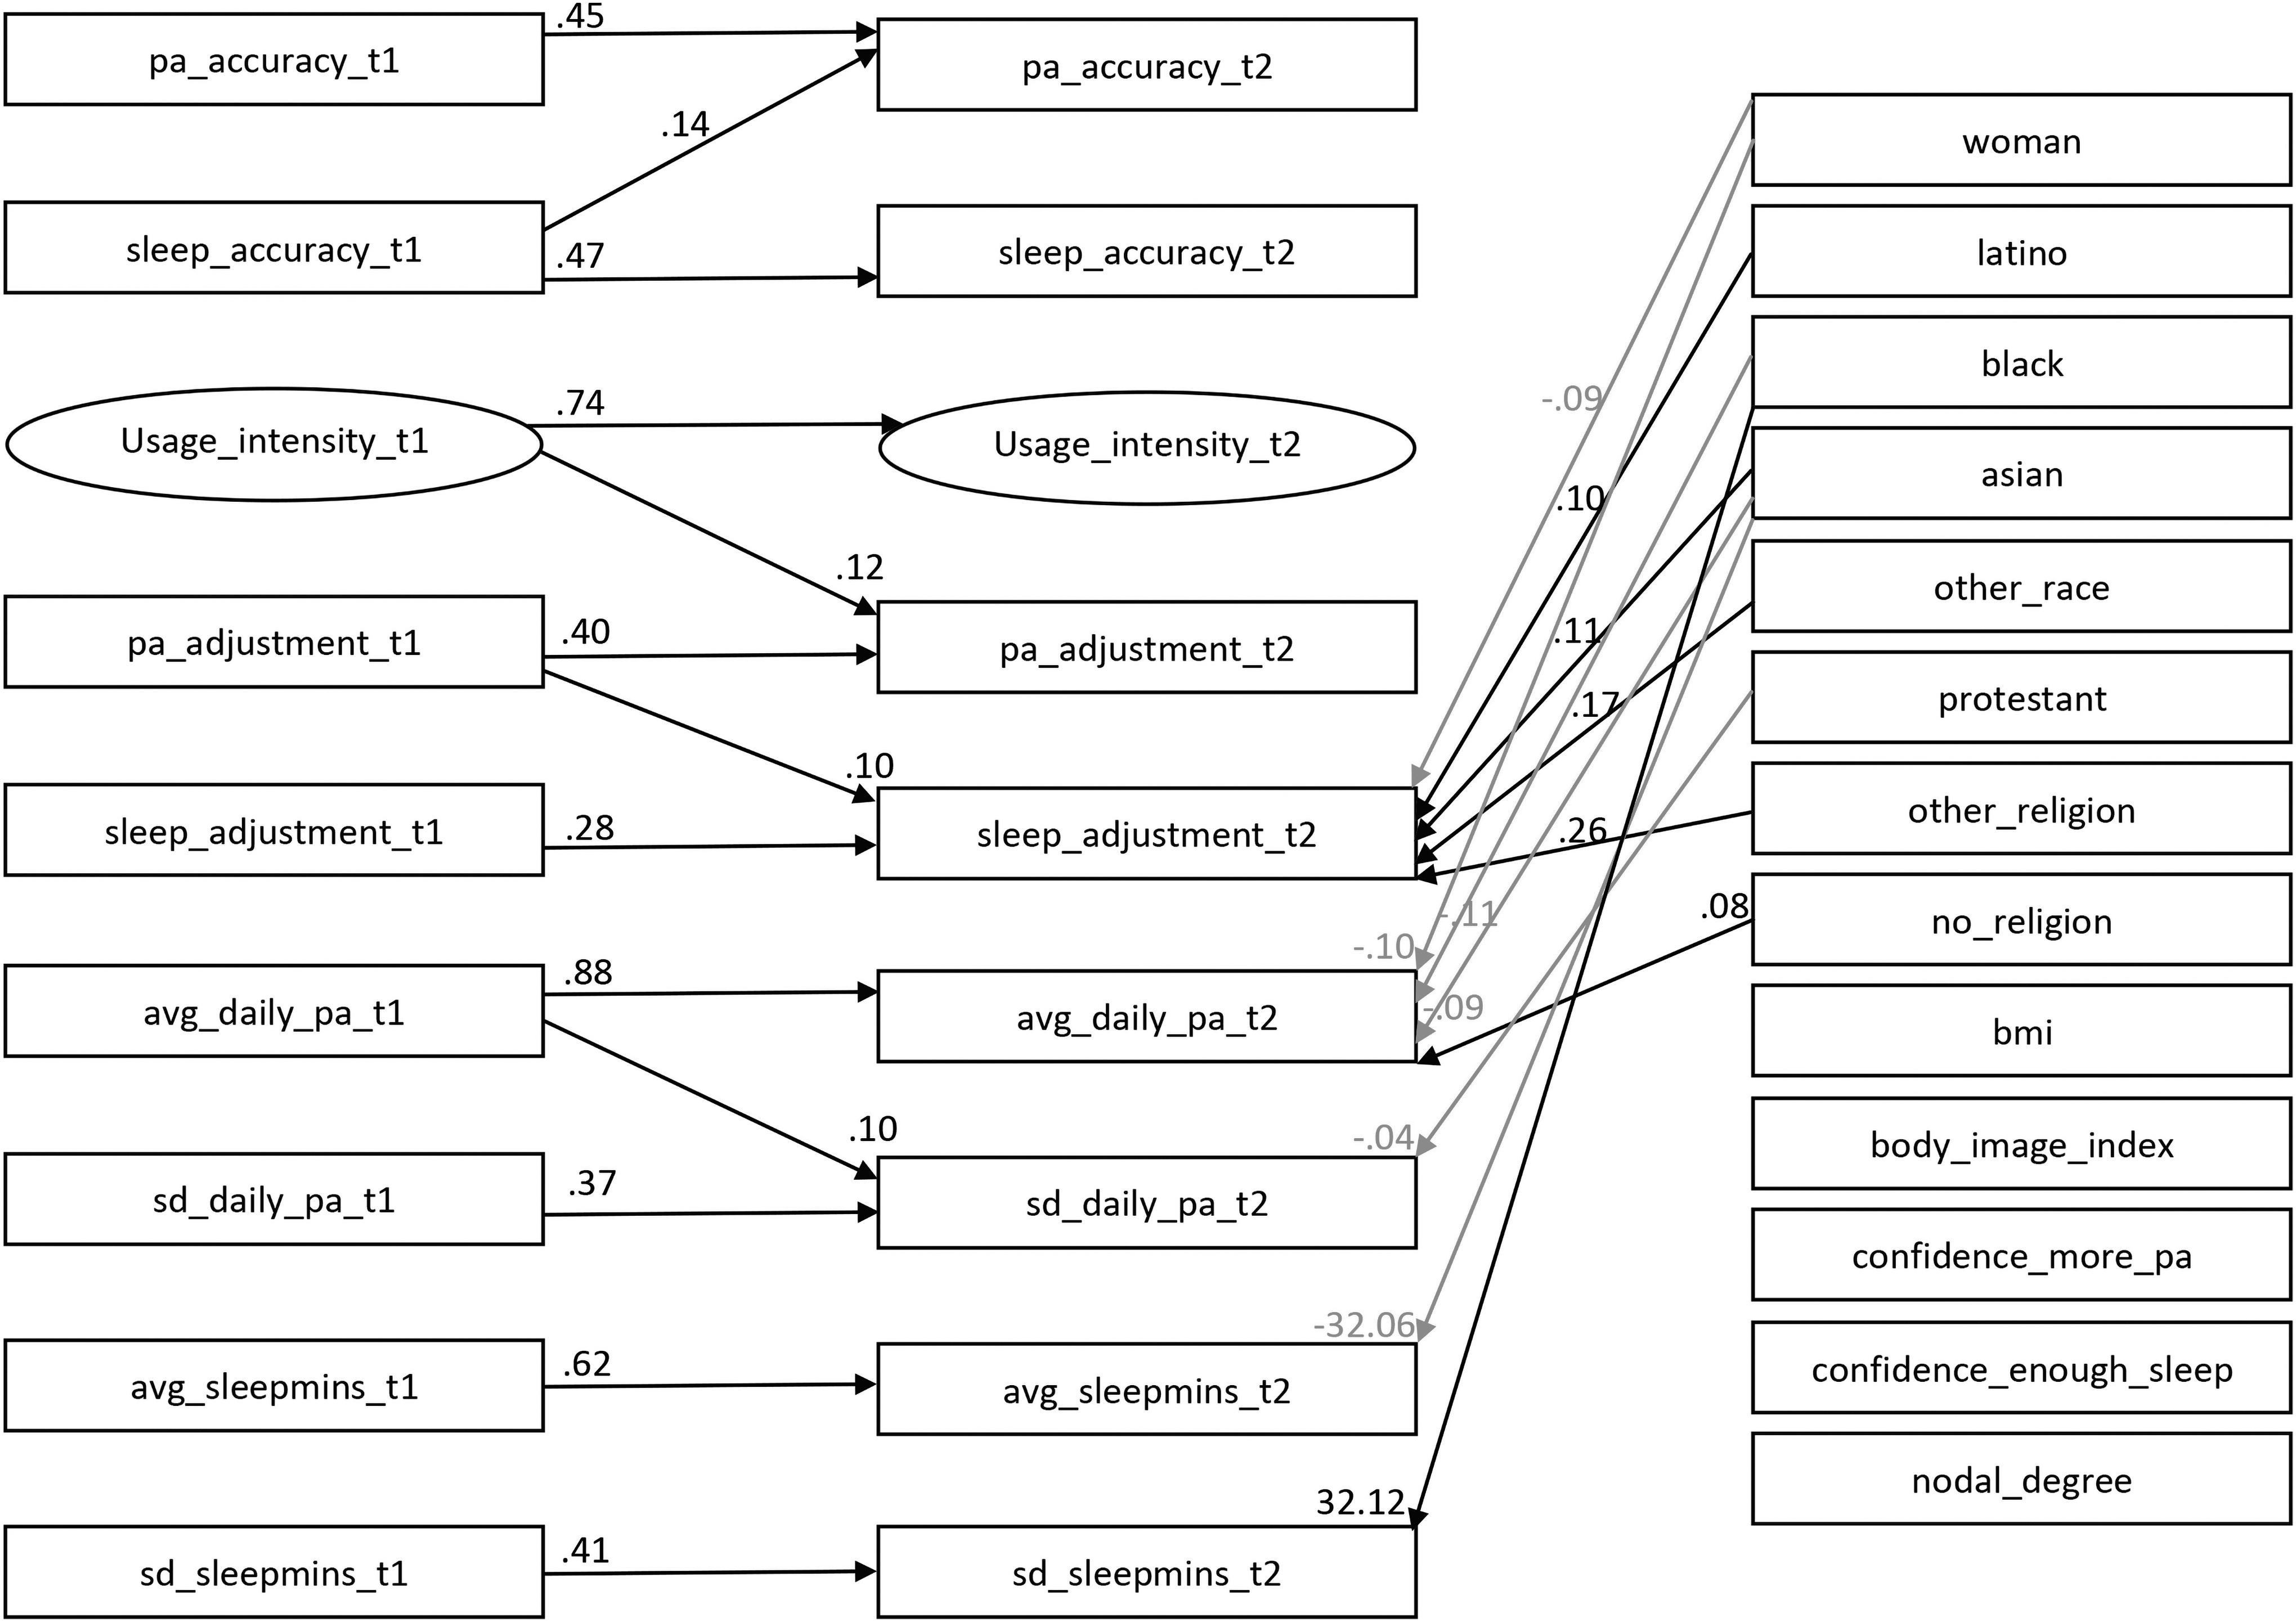
SEM of dependent variables with covariates. Notes: pa_accuracy—trust in the accuracy of Fitbit physical activity data; sleep_accuracy—trust in the accuracy of Fitbit sleep data; Usage_intensity—intensity of Fitbit device usage; pa_adjustment—adjustment of physical activity; sleep_adjustment—adjustment of sleep habit; avg_daily_pa—average of daily physical activity; sd_daily_pa—standard deviation of daily physical activity; avg_sleepmins—average of sleep minutes; sd_sleepmins—standard deviation of sleep minutes; t1—Winter 2016; t2—Summer 2016; bmi—body mass index; body_image_index—satisfaction with one's physical appearance; confidence_more_pa—confidence in stating that if s/he wanted s/he could be more physically active; confidence_enough_sleep—confidence in stating that if s/he wanted s/he could get enough sleep; nodal_degree—number of contacts during the first 90-day period. Results from the full model are available from
Goodness-of-Fit Indices for The Estimated Models
CFI, Comparative Fit Index; d.f., degrees of freedom; RMSEA, root-mean-square error of Approximation; SRMR, standardized root-mean-square residual; TLI, Tucker–Lewis Index.
The essential path coefficients between dependent variables and psychological traits are given in Figure 1 (results from the full model are available from
Second, Hypothesis 2 is only partially supported by the significantly positive association between Fitbit usage during Winter 2016 and physical activity adjustment during Summer 2016. Failing to support the hypothesis, Fitbit usage during Winter 2016 did not predict sleep adjustment during Summer 2016 or accuracy trust during Summer 2016. In addition, accuracy trust during Winter 2016 did not predict Fitbit usage during Summer 2016 or behavioral adjustment during Summer 2016. Finally, behavioral adjustment during Winter 2016 did not predict either Fitbit usage during Summer 2016 or accuracy trust during Summer 2016.
Third, Hypothesis 3 is not supported. The three dimensions of Fitbit usage behavior during Winter 2016 (accuracy trust, use intensity, and behavioral adjustment) did not predict actual levels of either physical activity or sleep during Summer 2016.
Fourth, Hypothesis 4 is partially supported. Participants with higher physical activity self-regulation trusted the accuracy of Fitbit physical activity data less. Extravert participants used Fitbit devices intensively, the opposite of what we have expected. Participants with higher depression levels used Fitbit devices intensively, whereas those with higher self-esteem levels did not. Participants with higher levels of agreeableness and depression were more likely to adjust their physical activities owing to Fitbit data, and those who were neurotic were more likely to adjust their sleep habits.
Finally, there are some notable unexpected findings. For example, the mean values and standard deviations of daily physical activity and sleep minutes were positively linked over time. The larger a user's daily physical activity level at time 1, the larger the standard deviation of daily physical activity at time 2. Participants with higher levels of self-regulation on physical activity tended to have both higher mean values and standard deviations for daily physical activity, whereas those with higher levels of conscientiousness had lower standard deviations for daily physical activity.
We included essential path coefficients between dependent variables and covariates in Figure 2 (results from the full model are available from
Women participants were less likely to adjust their sleep habits, but Latinos, Asians, and those identifying other races and religions tended to do so. The latter could reflect a resocialization process as members of minority groups attempted to fit into the disproportionately white and Catholic undergraduate student body. Women, Black, and Asian participants saw declines in daily physical activity, whereas those with no religion saw increases. Protestant participants had lower standard deviations for daily physical activity. Asian participants slept about 32 minutes less compared with whites. Black participants saw an increase of 32 minutes in the variance of sleep duration compared with whites.
Discussion
In this study we extend habit loop theory to investigate the development of Fitbit usage patterns among 692 participants from the NetHealth project. Our analysis yields findings fitting the habit loop model. However, we also uncover unexpected results needed further investigation in future work. First, regarding the external cues, more than three-fourth participants thought that the Fitbit physical activity and sleep data were very accurate or most of the time pretty accurate. As for the reward, nearly half participants said they adjusted their physical activities owing to Fitbit data.
Second, in line with habit loop theory,4–6 several psychological traits were found to serve as internal cues that drove Fitbit usage behavior. Results highlight two primary path sequences: “extraversion/depression/low self-esteem → intense use of Fitbit device → adjust physical activity → adjust sleep habit” and “agreeableness/depression → adjust physical activity → adjust sleep habit,” among which depression is an important initiating factor.
Third, similar to findings from Internet and smartphone usage studies,9,11 results indicate that participants with higher levels of self-regulation on physical activity were less likely to trust Fitbit physical activity data, and those who were neurotic tended to adjust their sleep habits.
There are some unexpected findings. First, accuracy trust in Fitbit data did not predict Fitbit use intensity or behavioral adjustment. This could result from the fact that most participants already trusted Fitbit data, leading to little variation in this predictor variable. Many new technology products, with either marginal or significant improvement to the existing solutions from competitors, have failed in market because they cannot win their customers' trust, which prevents the habit loop from running. Fitbit seemed to have avoided this problem in this sample.
Second, the three self-reported dimensions of Fitbit usage behavior did not predict either physical activity or sleep duration reported by Fitbit devices. Although participants claimed they had behavioral adjustment, this was not observed in the objective data. This finding is consistent with hundreds of studies reporting discrepancies between self-reported and objectively measured physical activity and sleep duration across various samples.30–33 As such, it is not too surprising that the perceived world did not perfectly match with their actual behavior.
Third, loneliness was found to predict intensive use of Internet and smartphones,11–13 but not Fitbit usage behavior. Although usage patterns of Fitbit devices do share similarities with that related to other technology products, it has its own property.
Fourth, Fitbit usage behavior was not predicted by fitness-related variables (BMI and the participant's confidence in getting more physical activity). This suggests that the participants in this sample were not particularly health-benefit oriented.
One previous study found that patients with high BMIs tended to share their personal fitness tracker data with medical researchers for risk protective consideration, 34 but another study revealed that there were unexpectedly far more healthy individuals adopting fitness trackers and other health-monitoring devices than patients with chronic illnesses who were supposed to benefit from these technology products. 35 Future research is needed to understand when fitness trackers have the potential to promote healthy behaviors for everyone and why participants across various contexts experience different decision-making processes and strength of the connection between motivation and behavior.
Finally, there were minimal differences across gender, ethnoracial, and religious affiliation lines on Fitbit usage behavior, except for adjustment of sleep habits. It should be noted that, as given in Table 1, there were far fewer participants reporting sleep habit adjustment than those reporting physical activity adjustment and the confidence of getting enough sleep was also lower than that of getting more physical activity.
There are a couple of limitations to note. First, the NetHealth project collected data only from one college that is predominately white and Catholic. We found both similarities and discrepancies between the usage patterns of Fitbit devices and other technology products. More studies are needed to generalize our findings to more heterogeneous college-based populations. Second, the three dimensions of Fitbit usage behavior were based on participants' self-reports. Participants could overestimate or underestimate actual behaviors owing to social desirability and cognitive biases. Ideally, we can better understand Fitbit usage behavior if there are objective measures of how and how much people use devices to retrieve information such as automatic on-device logs. With such data, researchers can assess how people actually use their devices.
Despite these limitations, our findings have implications for future research. Fitbit is a useful tool. It provides information that facilitates, if not directly drives, health promotive behaviors. 36 The potential harm that could result from obsession or addiction of Fitbit devices is minimal: Fitbit devices do not require as much time and money as smartphone apps, nor do they significantly deprive users of sleeping time. Therefore, Fitbit devices seem to have few unintended consequences from other technology products.
Along with existing literatures on heavy users of Internet and smartphones, this study provides a window into the world of technology product usage patterns among college students: what kinds of people are more vulnerable and likely to be early adopters of behavior designed in technology products, to what extent various dimensions of a technique product usage behavior reinforce one another over time, and how the usage patterns fulfill various psychological needs into a self-sustaining loop. All these knowledge give us clues on obsessive or even addictive behaviors designed by technology products with worse outcomes.
Conclusion
Fitbit devices have the potential to produce long-term changes in routines and habits by providing steams of information on behaviors users can retrieve and monitor. In this study we adopt the cue–routine–reward model to examine the associations between accuracy trust, Fitbit use intensity, and behavioral adjustment. Although we found that participants trusted data from Fitbit devices and used them intensively, we did not find that participants' actual behaviors were altered by using Fitbit devices; even they said so. Given this gap between perceived and actual impacts of usage on behavior, future research needs to directly explore when and under what conditions people's beliefs about how useful these new technology products motivate them to alter their behavior.
Footnotes
Authors' Contributions
C.W.: conceptualization, data curation, methodology, formal analysis, write and edit the article. O.L.: funding acquisition, project supervision, edit the article. D.S.H.: funding acquisition, project supervision, edit the article.
Author Disclosure Statement
The authors declare no conflict of interest.
Funding Information
This study is supported by the National Institutes of Health Grant No.1 R01 L117757-01A1.