




Abstract
Recent studies have documented increases in anti-Asian hate throughout the COVID-19 pandemic. Yet relatively little is known about how anti-Asian content on social media, as well as positive messages to combat the hate, have varied over time. In this study, we investigated temporal changes in the frequency of anti-Asian and counter-hate messages on Twitter during the first 16 months of the COVID-19 pandemic. Using the Twitter Data Collection Application Programming Interface, we queried all tweets from January 30, 2020 to April 30, 2021 that contained specific anti-Asian (e.g., #chinavirus, #kungflu) and counter-hate (e.g., #hateisavirus) keywords. From this initial data set, we extracted a random subset of 1,000 Twitter users who had used one or more anti-Asian or counter-hate keywords. For each of these users, we calculated the total number of anti-Asian and counter-hate keywords posted each month. Latent growth curve analysis revealed that the frequency of anti-Asian keywords fluctuated over time in a curvilinear pattern, increasing steadily in the early months and then decreasing in the later months of our data collection. In contrast, the frequency of counter-hate keywords remained low for several months and then increased in a linear manner. Significant between-user variability in both anti-Asian and counter-hate content was observed, highlighting individual differences in the generation of hate and counter-hate messages within our sample. Together, these findings begin to shed light on longitudinal patterns of hate and counter-hate on social media during the COVID-19 pandemic.
Introduction
The COVID-19
Although anti-Asian hate in the context of COVID-19 is a recent phenomenon, there has been extensive work demonstrating the negative impacts of racism on its targets. 9 For instance, previous research has found that Asians targeted by racially motivated harassment are at greater risk for poorer mental and physical health outcomes, including depression, anxiety, chronic stress, and chronic disease.10–12 In fact, during the first few months of the pandemic (i.e., January–March 2020), there was a 39 percent increase in Asian Americans who were identified as experiencing severe anxiety through Mental Health America's online mental health screening tool.13,14 Speaking on the effects of racism online, research by Yang and colleagues 15 indicated that Asian Americans who encountered discrimination in their passive use of social media during the COVID-19 pandemic reported lower subjective well-being. Of note, this finding was mediated by increased worry about encountering discrimination again.
Rather than focus on the psychological outcomes of racially motivated attacks, this research seeks to shed light on temporal trends in anti-Asian and counter-hate content on social media, the understanding of which may offer insights about other hate campaigns online. That is, a crucial question that has yet to receive sufficient empirical attention is how anti-Asian hate, as well as positive messages to combat the hate, have varied in online spaces over time throughout the pandemic.
One of the few efforts to explore anti-Asian and counter-hate messages on social media during the pandemic comes from recent work by He and colleagues, 4 who developed a machine learning model to classify anti-Asian hate, counter-hate, and neutral (irrelevant) content in a large corpus of Twitter data. In addition to generating a labeled dataset and performing a range of linguistic and social network analyses, the researchers also provided a brief descriptive overview of an observed “ebb and flow of hate and counter-speech” over a 14-month span. Specifically, these researchers found large initial spikes of anti-Asian activity during the early stages of the pandemic that then decreased at a steady rate. In contrast, there were large spikes in counter-hate activity following violent in-person attacks against Asian Americans (e.g., the Atlanta spa shootings). Other researchers found similar bursts of activity in anti-Asian and counter-hate content16,17; however, because the assessment of temporal trends was not a primary focus, crucial insights about the evolution of anti-Asian hate and counter-hate can be gained from additional longitudinal analyses.
In this study, we used latent growth curve analysis to investigate temporal changes in the frequency of anti-Asian and counter-hate messages on Twitter throughout the first 16 months of the COVID-19 pandemic—a longer time frame than most included in previous studies. Whereas other studies have evaluated trends pertaining to sentiment,17,18 geographic location, 19 and moral beliefs, 20 we are unaware of any prior studies that have used latent growth curve analysis to evaluate patterns in the frequency of this content during the pandemic. That is, we believe this methodology can provide invaluable insights for modeling between-user differences within the context of within-user changes, further illuminating how trends in the use of certain keywords change over time. 21
We predicted that the frequency of both anti-Asian and counter-hate messages would vary considerably over time. Specifically, we hypothesized that the frequency of anti-Asian content would fluctuate in a curvilinear pattern, given the descriptive patterns reported in previous research,4,16,17 evolving public health circumstances (e.g., lockdowns, social distancing recommendations), the highly political nature of responses to the pandemic, 16 and a shifting political landscape.16,22 In contrast, we were unsure which of two alternative hypotheses might be supported in our investigation of counter-hate messages. On one hand, the frequency of counter-hate messages might also fluctuate in a curvilinear pattern, in response to shifts in the public health and political landscape. On the other hand, counter-hate messages might steadily increase over time, in response to the increased prevalence and salience of anti-Asian hate in both online and offline spaces.
Materials and Methods
As part of a broader data collection effort investigating anti-Asian prejudice on Twitter during the COVID-19 pandemic
23
(Wheeler B, et al. Technical Report: Global Prevalence Patterns of Anti-Asian Prejudice on Twitter During the COVID-19 Pandemic. Loyola eCommons; in review,
For each date in this timeframe, we obtained a count of the number of times 12 specific anti-Asian hashtags and keywords (#batsoup/batsoup, #chinavirus/chinavirus, #gobacktochina/gobacktochina, #chinesevirus/chinesevirus, #chineseplague/chineseplague, #gook/gook, #chinaliedpeopledied/chinaliedpeopledied, #kungflu/kungflu, #wuflu/wuflu, #chingchong/chingchong, #makechinapay/makechinapay, #ccpvirus/ccpvirus) and five counter-hate hashtags and keywords (#hateisavirus/hateisavirus, #Iamnotavirus/Iamnotavirus, #racismisavirus/racismisavirus, #washthehate/washthehate, #stopasianhate/stopasianhate) appeared in the Twitter feeds of publicly available accounts. Versions of each designated keyword with and without a preceding hashtag were included in the frequency count. We selected these keywords based on relevant literature, 4 news publications,25–27 and social media posts discussing anti-Asian attitudes during the early months of the pandemic.
A total of 13,008,053 tweets were queried from 3,298,940 distinct users. An initial dataset was created containing the number (count) of each anti-Asian and counter-hate keyword for each date across the 16-month timeframe.b From this initial dataset, we extracted a random subset of 1,000 users who had used one or more anti-Asian or counter-hate keyword using the sample() R function. 28 This function gathers a random sample of user ID numbers without duplicates, where the probability of a user being selected in the sample is proportional to the remaining users. 28 The sample size (N = 1,000) was chosen based on simulation studies29–31 demonstrating adequate statistical power when evaluating linear and quadratic trends across 16 time points. A count reflecting the number of times each individual used an anti-Asian or counter-hate keyword was then tallied for each of the 16 months of data collection.
As shown in Figure 1, the total number of anti-Asian keywords (among all users in the sample) ranged from 0 to 46 in a given month, with the highest number of anti-Asian keywords occurring in March 2020. The total number of counter-hate keywords (among all users in the sample) ranged from 0 to 60, with the highest number of counter-hate keywords occurring in March 2021. Moreover, at the level of individual users, the cumulative total number of anti-Asian keywords across the 16-month data collection period ranged from 0 to 142, whereas the total number of counter-hate keywords ranged from 0 to 62. Compared with the full dataset, the random sample of Twitter users showed comparable user frequencies (Fig. 1a–c), providing evidence of the representativeness of this subsample.
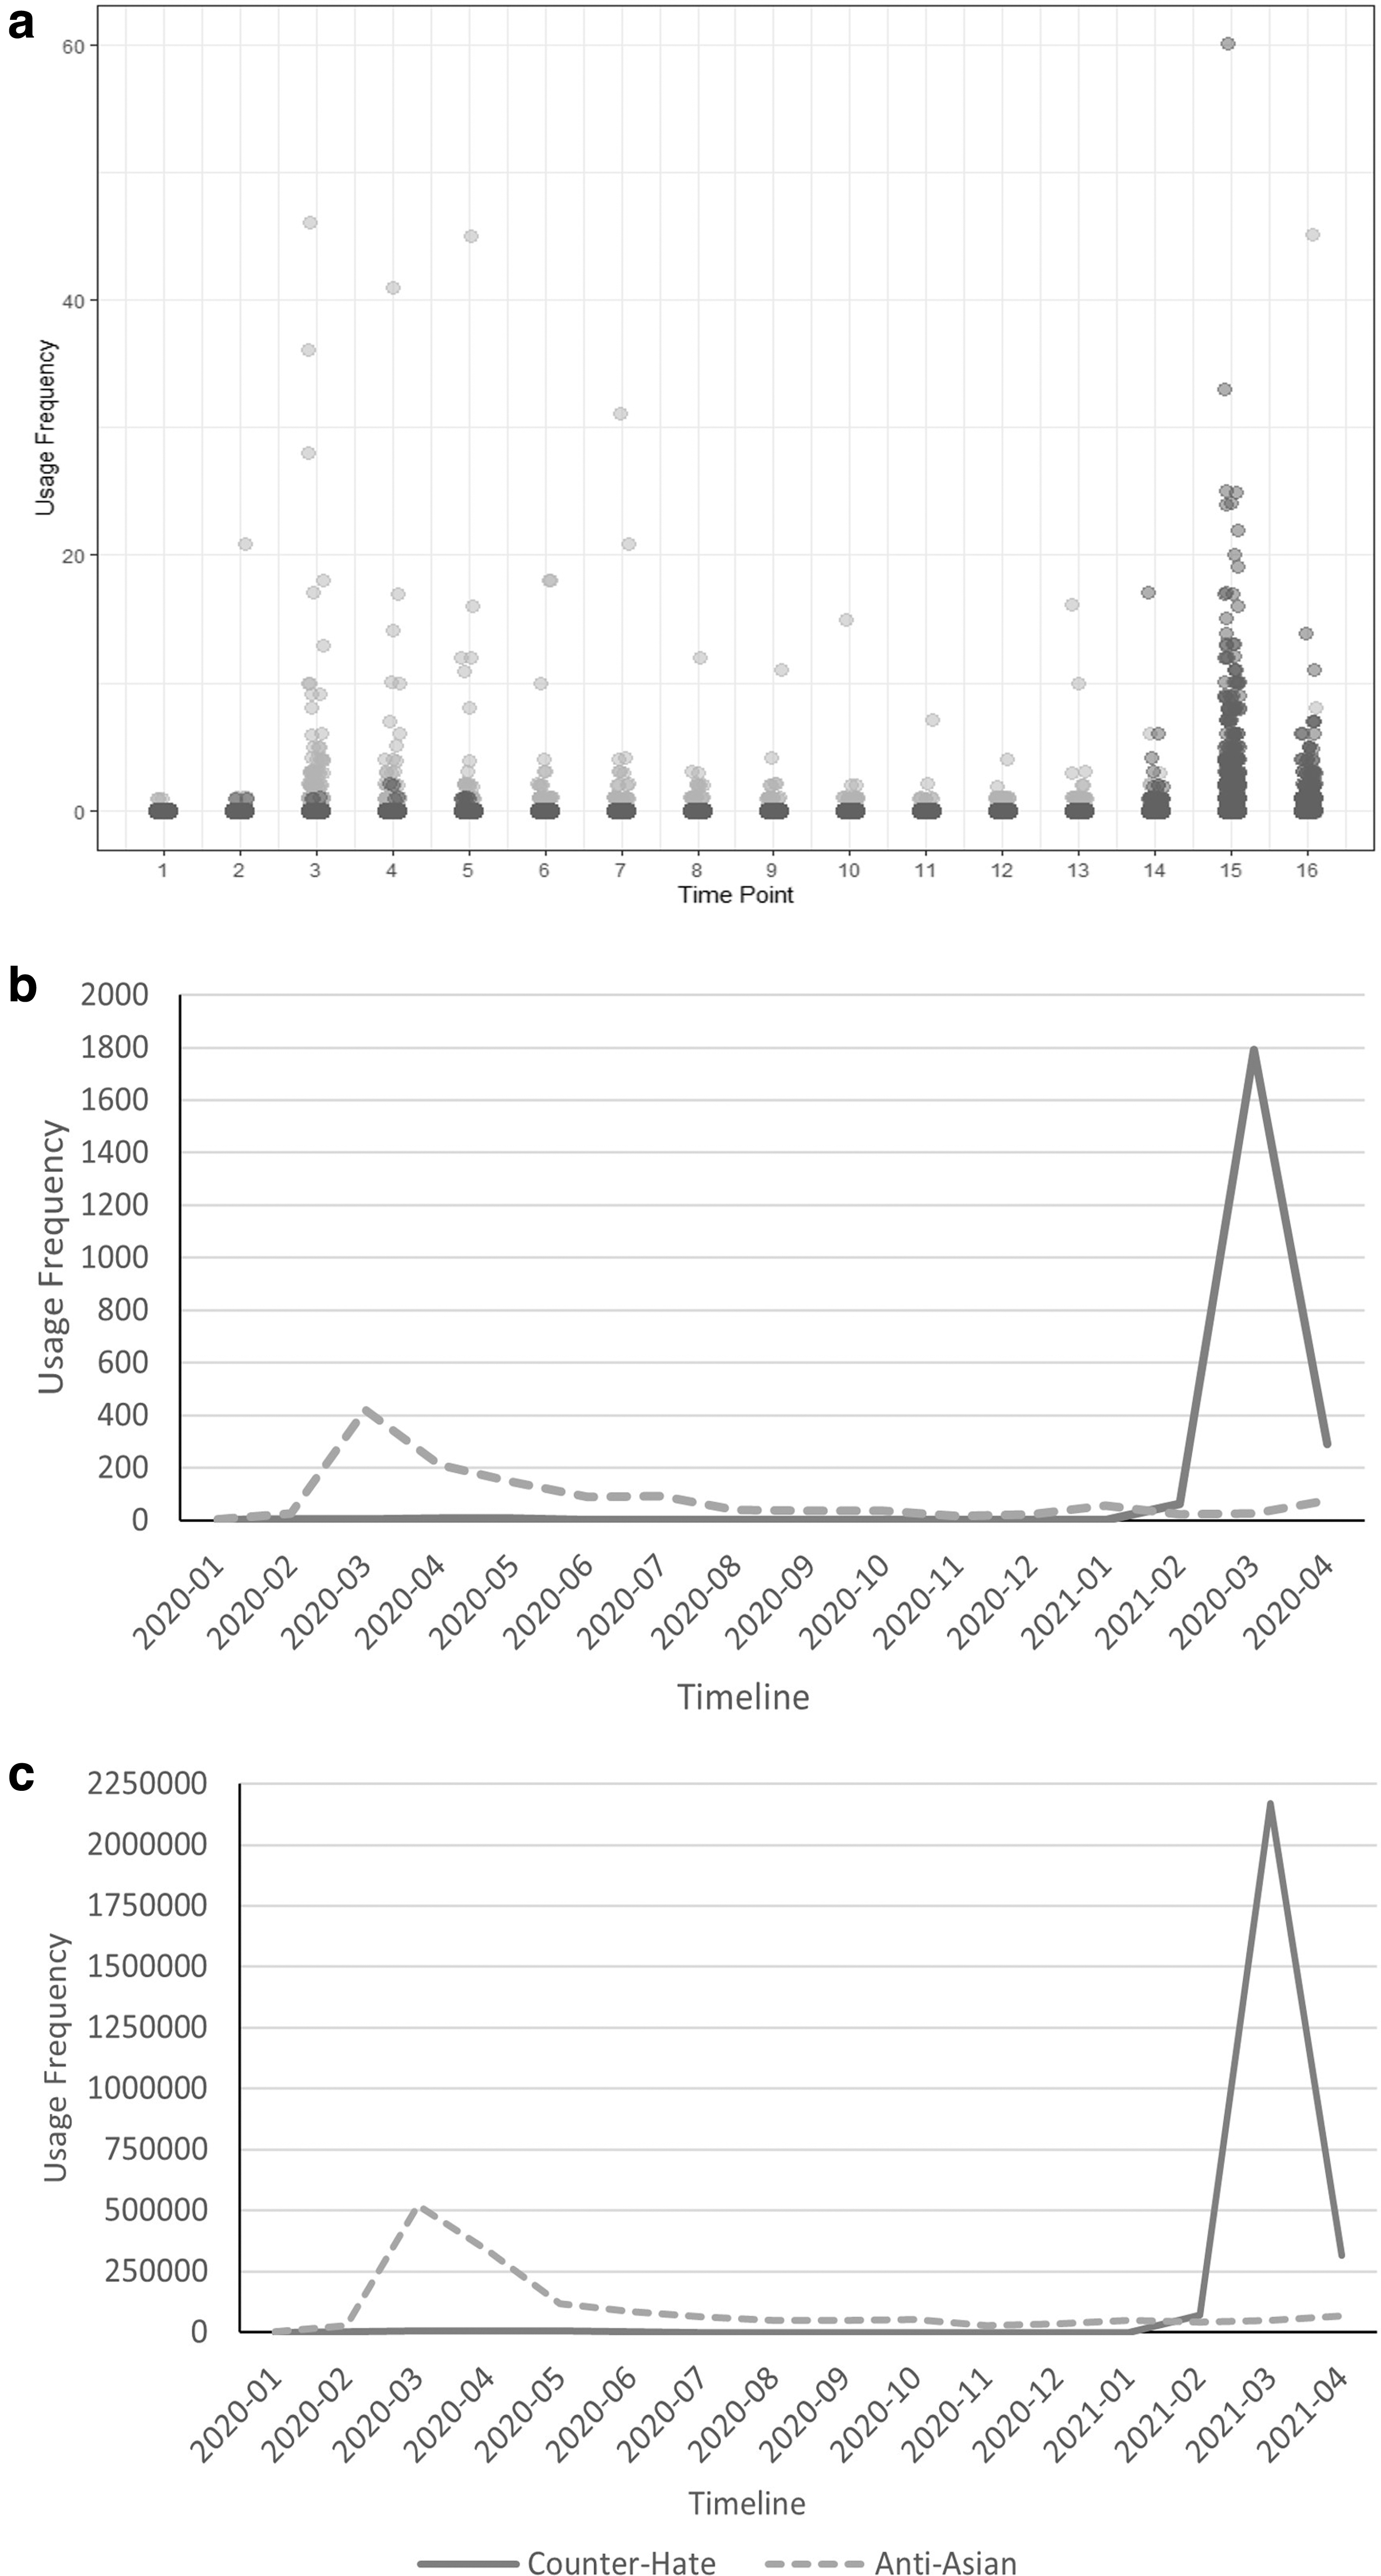
Frequency of anti-Asian and counter-hate keywords for the random sample of Twitter users
Analytical plan
A series of latent growth curve models were performed using Mplus 8.532 to investigate changes in anti-Asian and counter-hate activity over time. For all models, the frequency of keyword use at each time point was specified as a count variable with a negative binomial distribution and was estimated using maximum likelihood estimation. Specifically, for our (separate) analyses of anti-Asian and counter-hate frequencies, we tested three models. The first model (Fig. 2) was an intercept-only model, which assumes that users showed no change in their frequency of (anti-Asian or counter-hate) keyword use over time. The second model was a linear growth model (Fig. 3), which assumes that users showed linear increases or decreases in their anti-Asian or counter-hate keyword use over time, with the intercept of the model centered at the first time point for which there was a nonzero keyword count.c

Path diagram of the intercept-only models for anti-Asian

Path diagram of the linear growth curve models for anti-Asian
The third model (Fig. 4) was a quadratic growth model, which assumes that users can have a quadratic (i.e., curvilinear) increase or decrease in anti-Asian or counter-hate keyword use over time. To more easily identify differences between the linear and quadratic growth models and to prevent the correlation between these two latent variables from being too large, the intercepts of the quadratic growth models were set to a timepoint midway through the data collection period (i.e., September 2020 for the anti-Asian model and May 2020 for the counter-hate model).d Because the data consisted of counts, the difference between the −2 log-likelihood (LL) values was used to compare the fit between models. In addition, because the coefficients produced by Mplus were in a log metric, the values were exponentiated before interpretation.
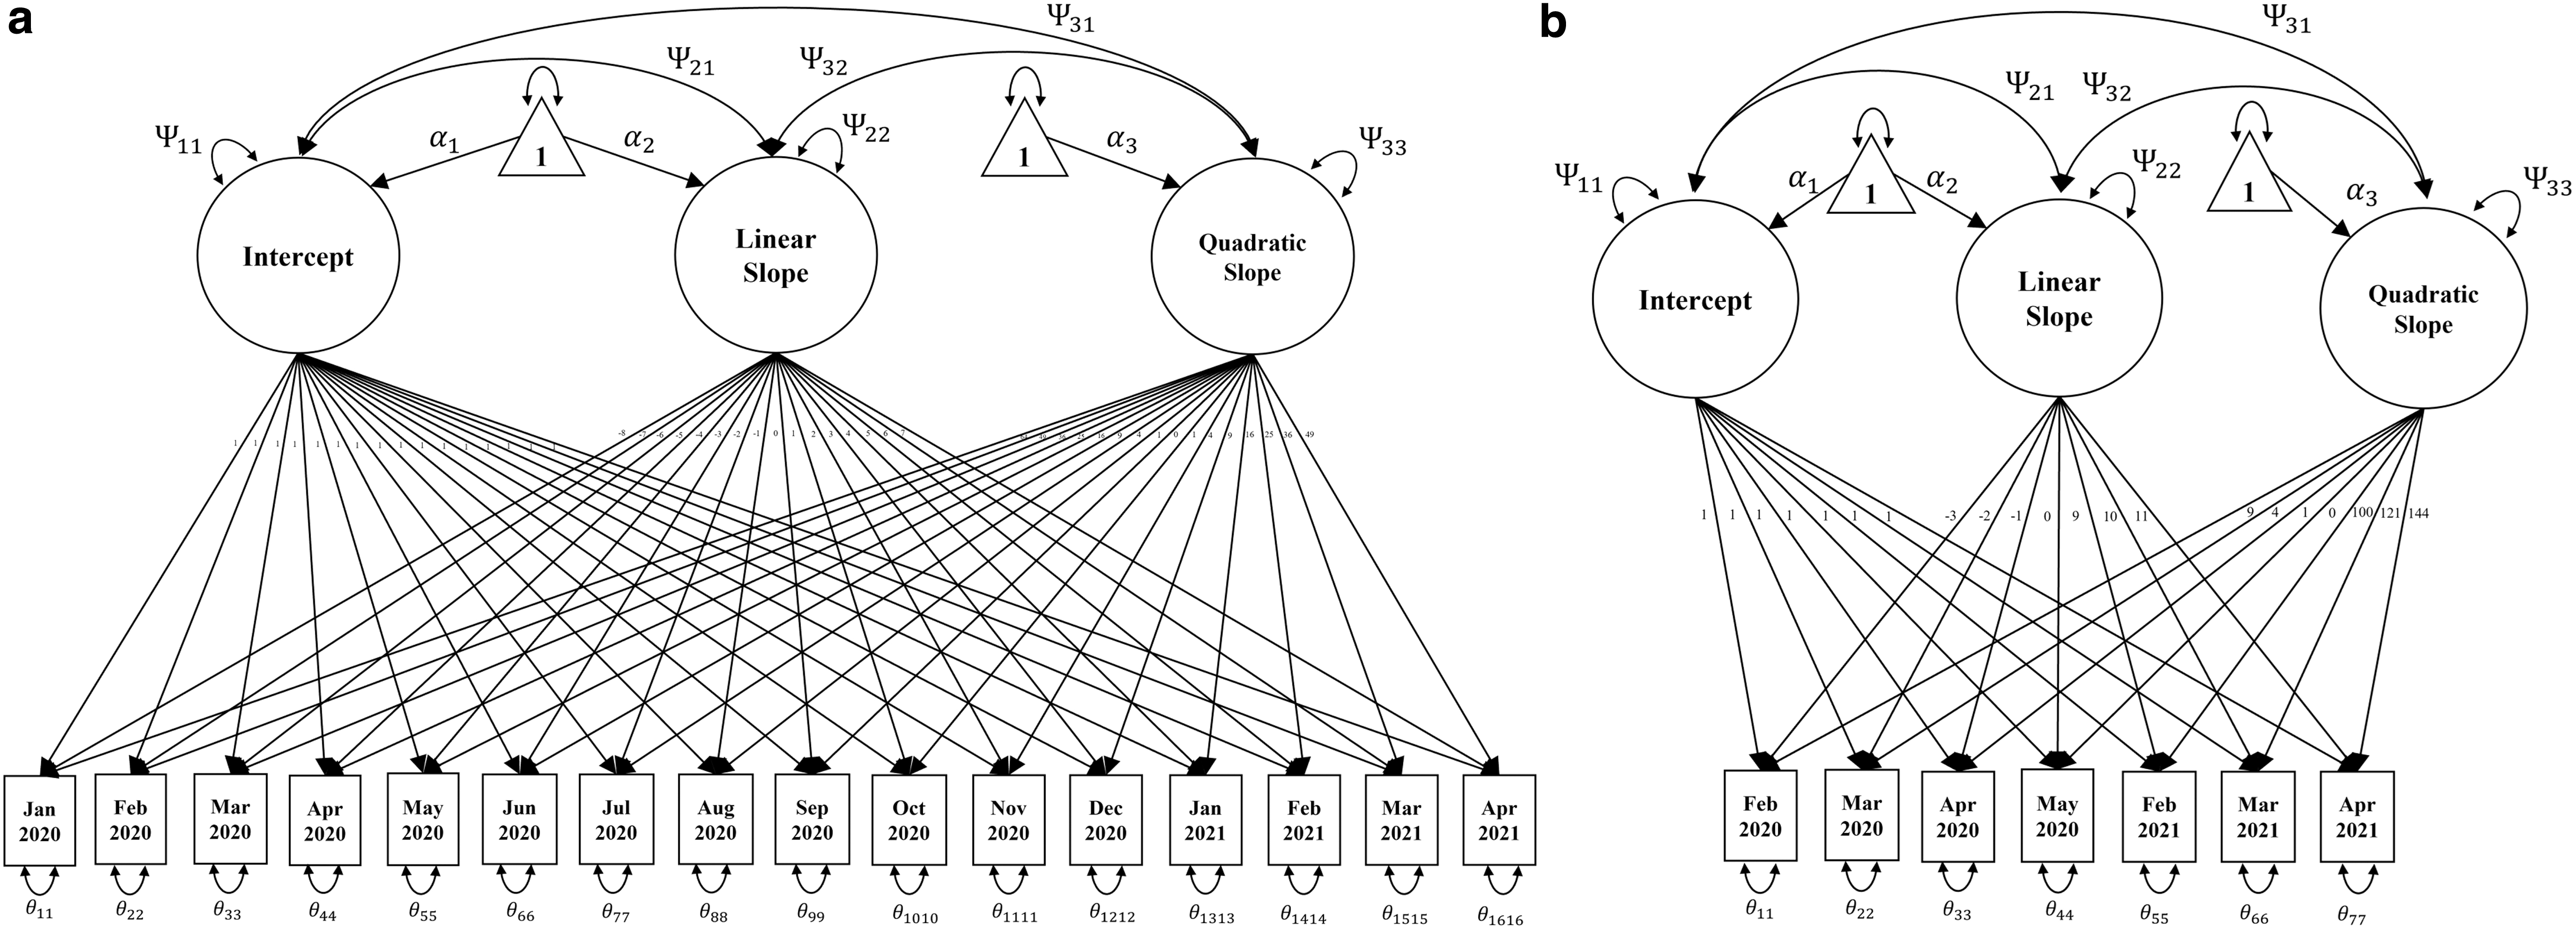
Path diagram of the quadratic growth curve model for anti-Asian
Results
Anti-Asian keyword use
Whereas the linear (Δ −2LL = 46.85, df = 3, p < 0.001) and quadratic (Δ −2LL = 437.06, df = 7, p < 0.001) growth models showed significantly better fit than the intercept-only model, the quadratic growth model fit the data significantly better than the linear growth model (Δ −2LL = 483.91, df = 4, p < 0.001). Therefore, we moved forward with the interpretation of the quadratic growth model only. As shown in Figure 5, the frequency of anti-Asian keywords quickly rose in the first few months and then declined over time, with the curvilinear pattern supported by the significance of the quadratic slope (Ѱ3 = 1.03, SE = 1.02, p < 0.001).

Individual quadratic growth trends of anti-Asian keyword use. Each line represents the growth trend for one user over the data collection period.
Significant covariances between the intercept and the linear slope (Ѱ21 = 1.12, p = 0.016), between the intercept and the quadratic slope (Ѱ32 = −0.96, p < 0.001), and between the linear slope and the quadratic slope (Ѱ31 = −1.00, p = 0.025) were found, indicating that greater anti-Asian keyword use at the model's intercept (September 2020) was associated with a slower rate of deceleration and confirming the superior fit of the quadratic model over the intercept-only and linear growth models. Finally, there was evidence of significant between-user variability in the frequency of anti-Asian keyword use in September 2020 (Ѱ11 = 57.63, SE = 1.76, p < 0.001), between-user differences in (linear) rates of change (Ѱ22 = 1.04, SE = 1.01, p < 0.001), and between-user differences in (quadratic) rates of acceleration (Ѱ33 = 1.00, SE = 1.00, p = 0.001) over time. This variability between users is also reflected in Figure 5, as some users showed positive quadratic trends, whereas others showed negative quadratic trends.
Counter-hate keyword use
The linear growth model fit the data significantly better than the intercept-only model (Δ −2LL = 26.94, df = 3, p < 0.001). Of note, the quadratic model for counter-hate keyword use did not converge, even after increasing the number of iterations, suggesting that a quadratic trend was not a good fit for the data. 33 Therefore, only the results of the linear model were interpreted. In the linear growth model, there were no significant covariances between the intercept and the linear slope (Ѱ21 = 0.99, ns), indicating no relation between individuals' frequency of counter-hate keywords in February 2020 (i.e., the intercept of the linear model) and their rate of change throughout the data collection period.
The linear slope (α2 = 1.47, SE = 1.00, p < 0.001) reflected that with each 1-month increase in time, the model predicted a corresponding increase of 1.47 counter-hate keywords, on average. Whereas there was no significant between-user variability in the frequency of counter-hate keyword use in February 2020 (Ѱ11 = 1.02, SE = 1.38, ns), there were, however, between-user differences in the (linear) rate of change over time (Ѱ22 = 1.01, SE = 1.00, p < 0.001; Fig. 6).

Individual linear growth trends in counter-hate keyword use. Each line represents the growth trend for one user over the data collection period.
Discussion
We performed latent growth curve analysis to investigate temporal changes in the frequency of anti-Asian and counter-hate messages on Twitter between January 30, 2020 and April 30, 2021. Anti-Asian content, reflected in the use of keywords such as #chinavirus/chinavirus and #gobacktochina/gobacktochina, increased steadily throughout the early months of the COVID-19 pandemic before declining, with a pattern best captured by a quadratic growth curve model. Whereas these initial spikes in anti-Asian content followed by a steady decline is consistent with previous studies,4,16,17 no prior studies used latent growth models to evaluate these trends over time.
In addition to overall trends in anti-Asian activity, our analysis revealed significant individual differences in the frequency and rates of change in the use of anti-Asian keywords among the Twitter users in our sample. Specifically, those who used anti-Asian keywords more frequently at the midpoint of our data collection (September 2020) showed significantly slower rates of deceleration in their use in subsequent months. This variability may reflect differences in exposure to and the perceived acceptability of terms like “china virus” within relatively homogenous social networks, thereby creating an echo chamber effect where the exposure to anti-Asian content coincides with an increased likelihood that users adopt similar language in future social media posts.
In contrast, temporal changes in the frequency of counter-hate messages (e.g., #washthehate/washthehate) were best captured by a linear growth model, reflecting a linear increase, particularly toward the end of our data collection range. This is consistent with the finding that counter-hate messages, in the context of other online social movements, can help activists disseminate information and encourage online discussion immediately following a catalyzing event.34–36 We were somewhat surprised by the low frequency of counter-hate keywords throughout much of the period of our data collection, especially before September 2020. This, paired with the significant uptick in counter-hate keywords in February, March, and April 2021—most likely in response to salient violent physical attacks against Asian victims (e.g., the Atlanta-area spa shootings on March 16, 2021 37 )—seemed to be a major factor in the linear growth trend.
This trend is similar to descriptive patterns found in previous research.4,38,39 It is worth noting, however, that although a linear trend emerged in this study, it is possible that a quadratic trend might have emerged if data collection continued beyond April 2021. Previous research evaluating social movements online (e.g., #MeToo) has, in fact, found declines in the use of and engagement with relevant hashtags after an initial peak of activity. 40 An exploratory post hoc analysis looking only at dates before March 2021 confirmed a significant linear increase in the frequency of counter-hate keywords during this truncated period, however, the extent to which counter-hate messages denouncing anti-Asian prejudice may have mirrored the ebb and flow of other movements involving “hashtag activism”40–42 remains to be seen.
Regardless, we believe our findings represent a crucial initial step toward understanding temporal fluctuations in prejudice and hate, on the one hand, and support for those targeted by the hate, on the other, on social media. Understanding these trends is especially important given the profound impact social media can have on its users. For example, repeated exposure to specific media content (e.g., anti-Asian messages) can increase users' adherence to the ideals the content advocates, 43 intolerance of alternative views, 44 and violent intentions. 45 Indeed, future research that speaks more broadly to the complex and potentially bidirectional relations between online and off-line hate and counter-hate can be particularly informative.
A few limitations of this study warrant mention and highlight additional directions for future research. First, our sample was not representative of Twitter users, as a whole. Data were only collected from users who had engaged in some way—through the use of one or more anti-Asian or counter-hate keywords—in a post reflecting or speaking out against anti-Asian prejudice during the COVID-19 pandemic (N = 3,298,940). This precluded an investigation of changes in the frequency of nonrelevant keywords for comparison purposes. In other words, one could argue that Twitter use increased or fluctuated, in general, throughout this time period. Evidence against this, however, comes from the finding that Twitter use is reflected in an average of approximately 400 million tweets from 300 million distinct users per day, and that this level of activity remained consistent across the data collection period in our study. 46
Needless to say, future research that queries a larger and more diverse population of users could offer different and equally beneficial insights. Furthermore, the analyses discussed in this article were performed with a subset of the full data set. Whereas the frequency of the use of anti-Asian and counter-hate keywords among our random sample of 1,000 Twitter users appeared to closely mirror the frequencies for the full data set, future studies would further support the generalizability of our findings. Finally, our data were collected during a select window of time. Given that the pandemic and the global sociopolitical landscape have continued to evolve, our findings should be interpreted within the context of our specific data collection time frame. Nevertheless, we believe much can be gained from analyses that shed light on longitudinal patterns of hate and counter-hate on social media.
Notes
a. Data were accessed using Twitter Academic Research accounts and in compliance with the Twitter Developer Agreement and Policy.
b. A descriptive summary of the frequency of anti-Asian and counter-hate keywords over time is discussed in greater detail in Wheeler et al. (2022).
c. For the anti-Asian linear growth model, the intercept was centered at January 2020. For the counter-hate linear growth model, the intercept was centered at February 2020, as there were no counter-hate keywords used in January 2020.
d. September 2020, the ninth time point, was chosen as the intercept for the anti-Asian quadratic growth model. May 2020 was chosen as the intercept for the counter-hate quadratic growth model, as it marked the midpoint in the data collection time frame when considering only months with at least one counter-hate keyword.
Footnotes
Acknowledgments
The analyses reported in this article were performed on data collected as part of a larger study investigating anti-Asian prejudice and counter-hate on Twitter during the early stages of the COVID-19 pandemic. The data collection process and a range of descriptive analyses are discussed in greater detail in Wheeler et al. (in review,
Authors' Contributions
B.W.: Conceptualization, methodology, software, formal analysis, investigation, writing—original draft preparation, writing—review and editing, visualization, supervision, project administration. S.J.: Methodology, software, formal analysis, investigation. D.L.H.: Methodology, investigation, writing—original draft preparation, writing—review and editing, supervision, project administration. M.P.: Software, formal analysis, investigation, writing—review and editing. Y.S.: Methodology, software, formal analysis, investigation, writing—review and editing, supervision, project administration.
Author Disclosure Statement
No competing financial interests exist.
Funding Information
This research was funded by the National Science Foundation Awards No. 2227488, No. 2036127, and No. 1719722. All data were collected according to Twitter's data collection guidelines and using the proper API access provided to researchers.