
Abstract
Background and Aims:
Continuous glucose monitoring (CGM) devices could be useful for real-time management of diabetes therapy. In particular, CGM information could be used in real time to predict future glucose levels in order to prevent hypo-/hyperglycemic events. This article proposes a new online method for predicting future glucose concentration levels from CGM data.
Methods:
The predictor is implemented with an artificial neural network model (NNM). The inputs of the NNM are the values provided by the CGM sensor during the preceding 20 min, while the output is the prediction of glucose concentration at the chosen prediction horizon (PH) time. The method performance is assessed using datasets from two different CGM systems (nine subjects using the Medtronic [Northridge, CA] Guardian® and six subjects using the Abbott [Abbott Park, IL] Navigator®). Three different PHs are used: 15, 30, and 45 min. The NNM accuracy has been estimated by using the root mean square error (RMSE) and prediction delay.
Results:
The RMSE is around 10, 18, and 27 mg/dL for 15, 30, and 45 min of PH, respectively. The prediction delay is around 4, 9, and 14 min for upward trends and 5, 15, and 26 min for downward trends, respectively. A comparison with a previously published technique, based on an autoregressive model (ARM), has been performed. The comparison shows that the proposed NNM is more accurate than the ARM, with no significant deterioration in the prediction delay.
Conclusions:
The proposed NNM is a reliable solution for the online prediction of future glucose concentrations from CGM data.
Introduction
Traditionally self-monitoring of blood glucose requires the drawing of a blood spot several times a day. The number of capillary blood glucose measurements (CBGMs) is reduced mainly because of the pain associated with testing. Nowadays, the availability of continuous glucose monitoring (CGM), which provides information in real time, makes it possible to obtain a subcutaneous glucose reading every few minutes. 2 In this new scenario patients have to interpret a huge amount of continuous information in order to calculate the necessary insulin dose and bring blood sugar levels as close to normal as possible.
Most of the CGM systems available in the market are minimally invasive systems that measure the glucose in the interstitial fluid compartment and not directly from plasma. Thus, there is a distortion between the glucose in the interstitial fluid with regard to the blood glucose levels, with a temporal delay that can become longer than 10 min. 2 A glucose predictor would enhance the CGM with valuable information on the expected glucose level in a time horizon. The predictor could aid the patient in anticipating his or her actions, but a predictor model is useful if the prediction horizon (PH) is long enough to allow the patients to anticipate their decisions, and that also depends on the relative delay between the CGM system measurement and the blood glucose value.
Artificial neural networks could be especially recommended to solve problems that cannot be easily described by mathematical algorithms that are highly nonlinear or when the variables can evolve from the initial conditions. For these reasons neural network techniques have been used in the past for predicting glucose levels using CBGM values as input 3 –5 and also within glucose control systems. 6,7 Some examples are reported below.
Sandham et al. 3 presented a neural network model (NNM) that used CBGMs, insulin doses, and intake as input data, for predicting blood glucose levels. It also considered other relevant information, if available, like exercise, stress, illness, or surgery. The network was evaluated with data from two patients.
Mougiakakou et al. 4 proposed a hybrid system based on the combination of a compartmental model (CM) and a NNM for blood glucose prediction. The CM generates an estimation of the insulin and intake effect, and the NNM used this estimation and two previous CBGMs to predict the subsequent blood glucose levels. The CM used information about insulin type and doses as well as the description of food intake. The network was evaluated with data from a type 1 diabetes patient over a period of 69 days.
Tresp et al. 5 also presented a hybrid CM-NNM system. The CM simulates the delay in carbohydrate intake absorption, the physical exercise, and the administered insulin dynamics. The NNM uses the CM estimation and the current and previous estimates of the blood glucose to predict the next glucose value. Data were used from one patient monitored over 63 days at 15-min intervals.
All of the predictors referred to the use of self-CBGM 3 –5 and required auxiliary details like insulin and intake data, hypoglycemic events, and exercise, among others. The availability of CGM opens a new scenario: glucose measurement is continuous information, and any method suitable for time-series analysis could be explored in the attempt to find a solution for the prediction problem. 8
Sparacino et al. compared the predictive performance of a first-order polynomial model 9 with that of a first-order autoregressive model (ARM), 10 both with time-varying parameters. The inputs of the models were past glucose data. The models were evaluated with data of diabetes patients wearing the GlucoDay® CGM System (A. Menarini Diagnostics, Florence, Italy), which provides glucose levels every 3 min. The results demonstrated that glucose prediction was feasible with the two prediction methods and concluded that for the dataset used and a prediction interval of 30 min, the ARM was the more reliable for obtaining a clinically significant prediction performance.
Reifman et al. 11 used a 10th-order data-driven ARM. The inputs of the model were the previously observed glucose levels. It was trained and evaluated with data of the iSense® CGM system (iSense Corp., Portland, OR). The CGM measurement rate was one sample per minute. The results demonstrated that the predictions for a PH of 30 min were quite accurate.
Palerm et al. 12 proposed an algorithm to predict glucose levels based on the estimation of glucose and its rate of change, using a Kalman filter. They applied the algorithm to predict hypoglycemia using data from a series of hypoglycemic clamps in which a CGMS® System (Medtronic-Minimed, Northridge, CA) was used. 13 For 30 min of PH and an alarm threshold of 70 mg/dL, the algorithm was effective in predicting hypoglycemia (sensitivity of 90% and specificity of 79%).
Artificial NNMs have also been applied in the prediction of glucose concentrations using CGM data. Pappada et al. 14 presented a NNM trained with data from the CGMS Medtronic System in combination with other data manually recorded by the patient in an electronic diary (i.e., CBGM, insulin dosages, carbohydrate intakes, hypoglycemic and hyperglycemic symptoms, lifestyle activities, events, and emotional state). Unfortunately, the prediction accuracy cannot be compared with that reported in other works in the literature 9 –11 because they calculated the mean percentage absolute difference of the model's predictive abilities instead of the commonly used evaluation parameters. They concluded that the model tended to underestimate extreme hyperglycemic values and overestimate hypoglycemic values.
In this article we propose a new real-time prediction algorithm based on a NNM for CGM. The model is trained using only CGM data as inputs, and the validation is performed by exploiting two datasets from two different commercial CGM devices. The results show that the accuracy of NNM prediction is satisfactory. Furthermore, the NNM is more accurate than the ARM developed by Sparacino et al., 10 with no significant deterioration in the prediction delay. The proposed NNM algorithm is therefore a reliable solution for the online prediction of future glucose concentrations based on CGM data.
Materials and Methods
Subjects and dataset
The evaluation of the prediction algorithm was performed using data from the Guardian® Real-Time CGM System (Medtronic-Minimed) and the FreeStyle Navigator® CGM System (Abbott Laboratories, Abbott Park, IL). The Guardian provides a single output measurement every 5 min (288 samples per day). The FreeStyle Navigator produces a single output measurement every minute (1,440 samples per day).
The Guardian dataset includes data from nine patients with type 1 diabetes. The patients wore the CGM system intermittently for 72 h/week over a 4-week period. The dataset includes 12 daily profiles for every patient: six full-day and six half-day recordings. 15
The FreeStyle Navigator dataset includes data from six patients with type 1 diabetes. The patients wore the CGM system for around 72 h. The dataset includes two complete daily profiles for every patient. 16
Figure 1 shows two profiles extracted from the respective datasets.
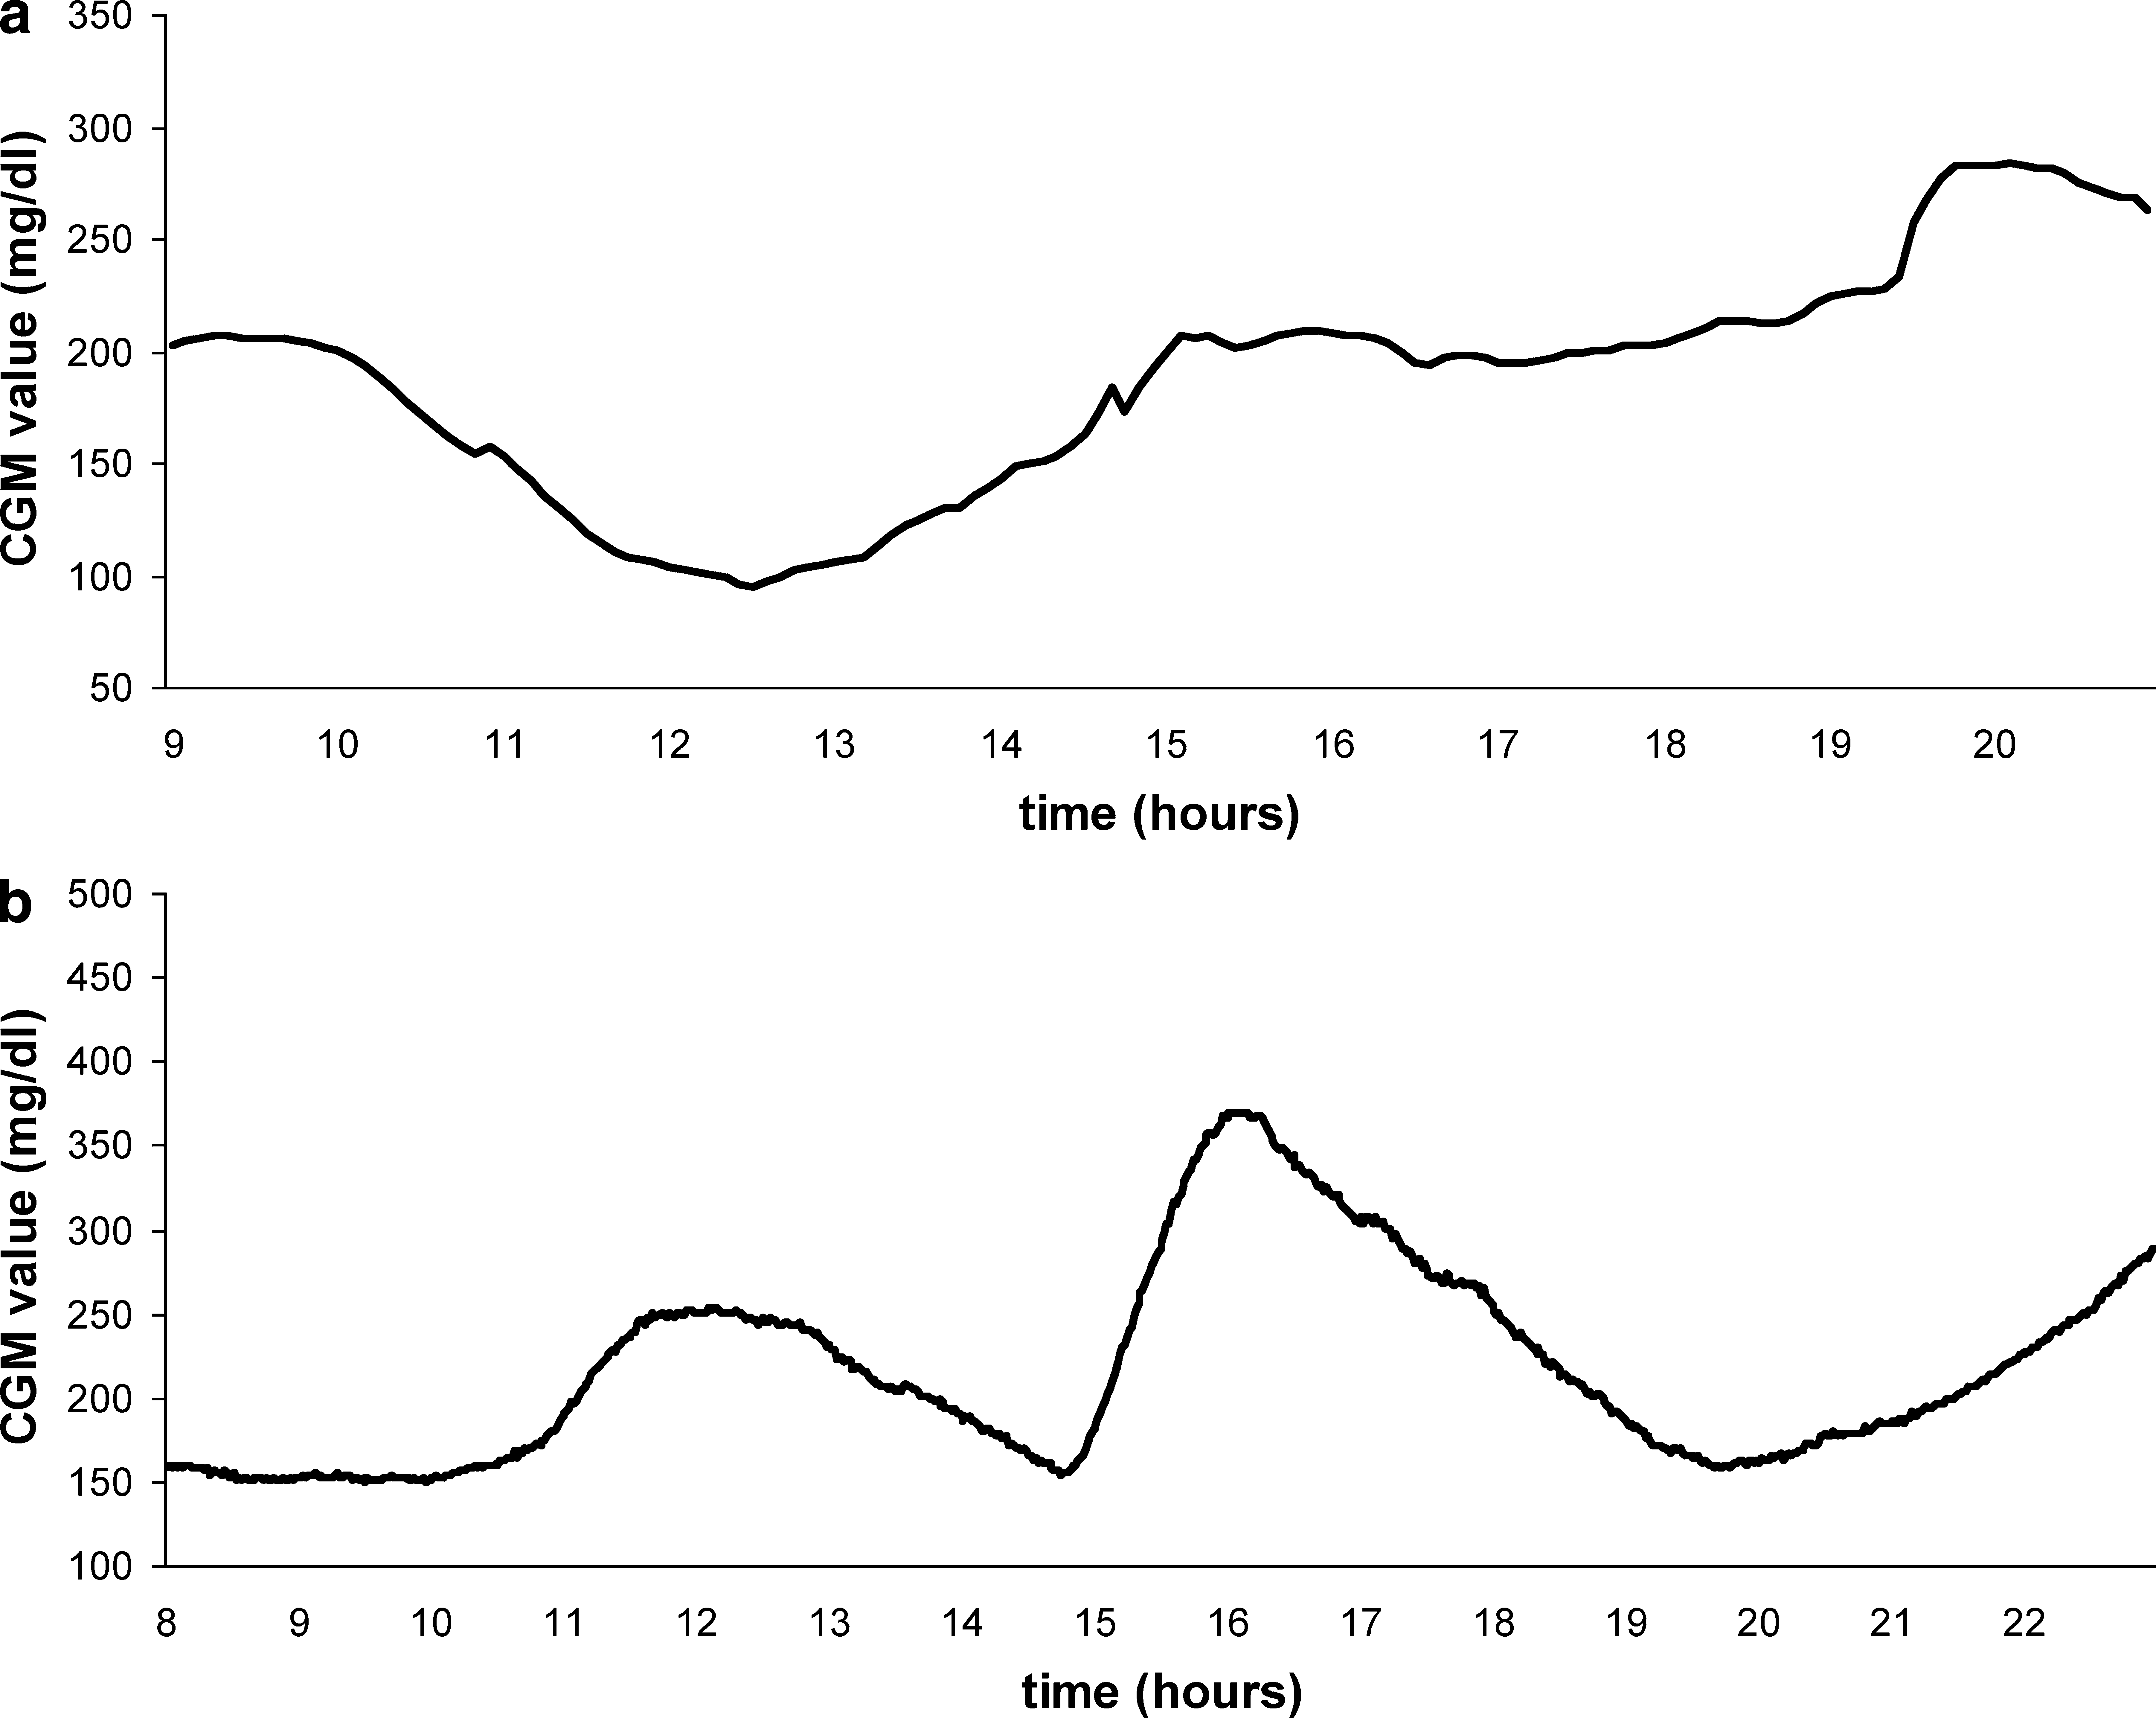
Two representative CGM profiles from (
Note that before feeding the prediction algorithm, it was found convenient to reduce the effect of noise in the FreeStyle Navigator profiles (1-min sampling) by prefiltering them using a causal Kalman filtering method. 17 However, the quantitative assessment of the prediction methodology in Evaluation methodology below is done by taking the original profiles as reference.
Description of the NNM
The network architecture has three layers with a first layer of 10 neurons and a second layer of five neurons. 15 The transfer function is sigmoidal in both layers. Neurons are totally connected and feed forward. The output layer has one neuron with linear transfer function.
The network input information is the current glucose measurement and its timestamps together with a limited number of previous glucose samples from the CGM system. The NNM takes into account the glucose measurements up to 20 min before the current time. Because the sampling rate varies from one CGM system to another, the number of the NNM inputs is different for each dataset. The output of the network is the glucose prediction at the PH time.
Figure 2 shows the NNM architecture using the Guardian data. In this case, the sensor registers the glucose every 5 min, so this model needs five CGM samples as inputs to work with a memory of 20 min. Using the FreeStyle Navigator, the NNM presents 20 CGM samples as inputs. The current time is provided as the order number of the sample throughout the day.
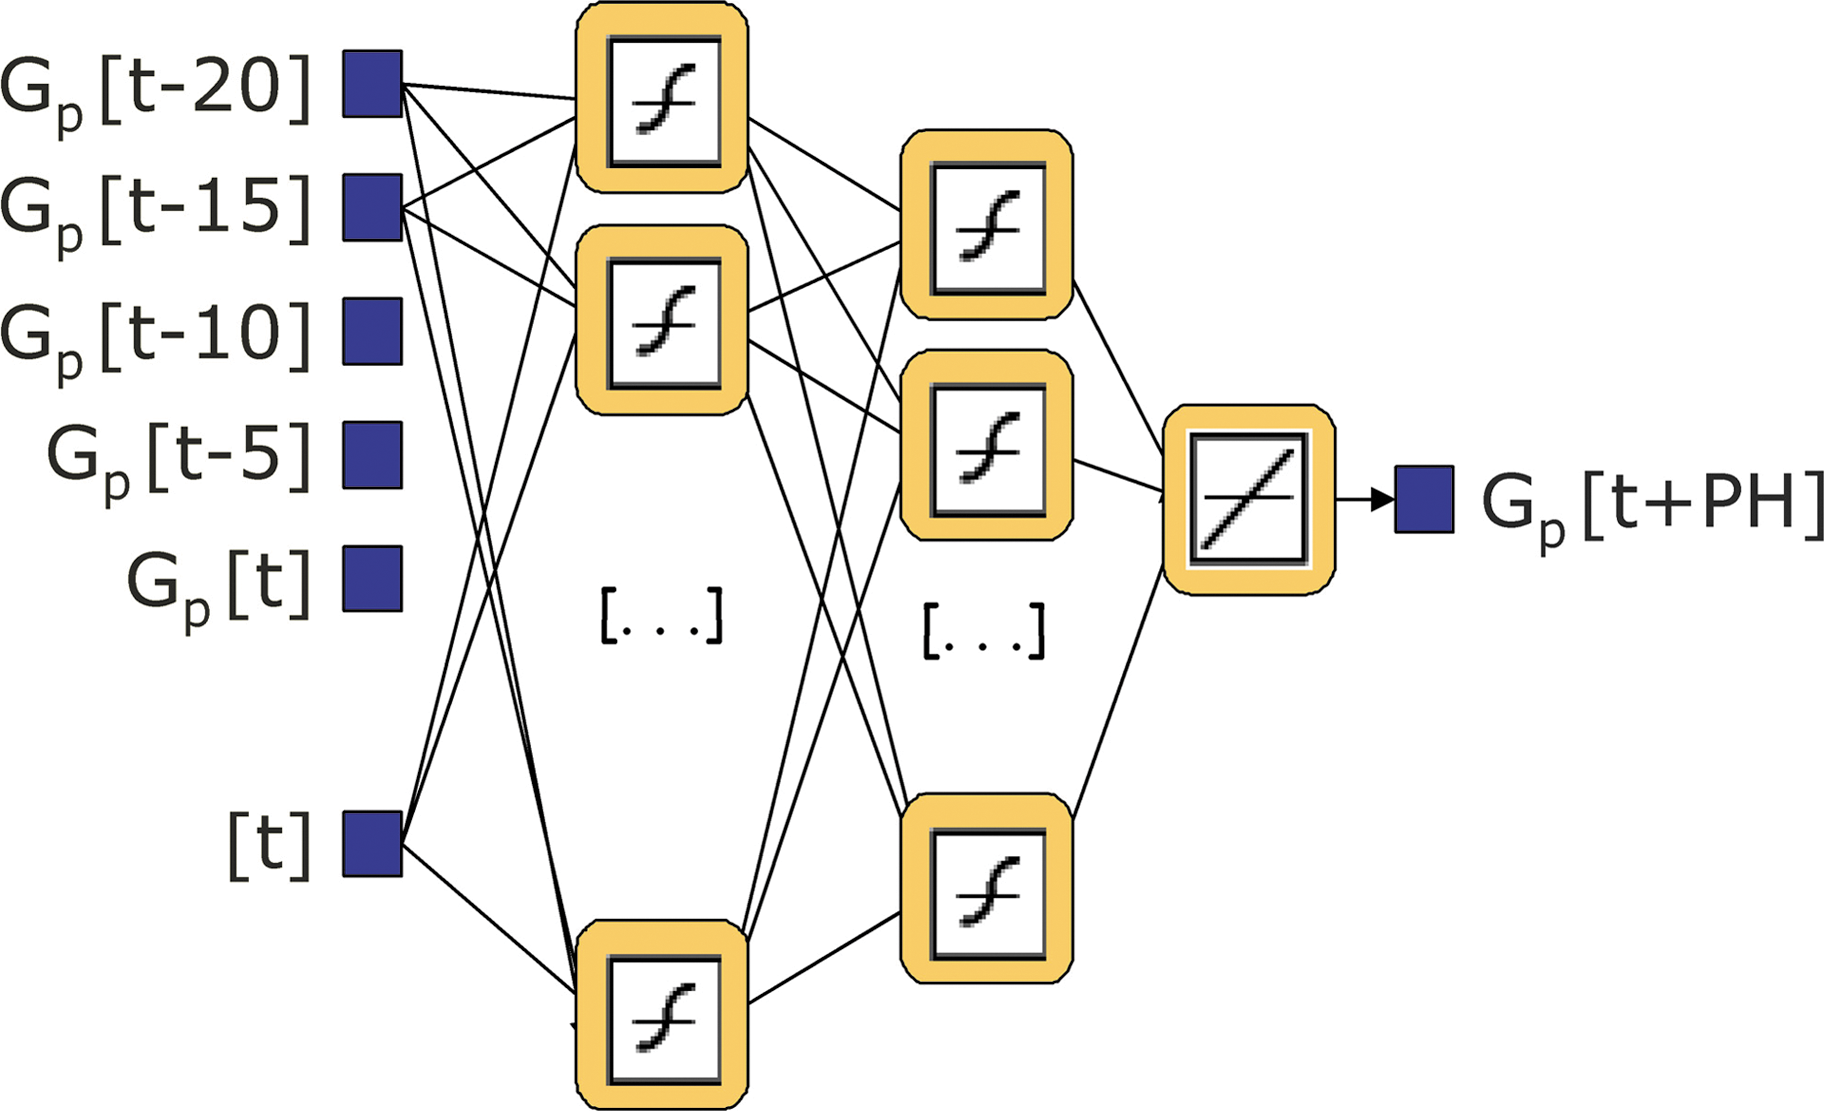
NNM architecture when the Guardian sensor (5-min sampling) is used. Color images available online at
Network parameters (weights and bias) are randomly initialized and, afterwards, are updated according to a back-propagation Levenberg-Marquardt optimization training algorithm. The training algorithm is applied in a batch mode, in which weights and biases are only updated when all the inputs and targets are presented. Three NNMs have been trained to predict glucose after 15, 30, and 45 min in order to evaluate the network performance depending on the PH.
For each dataset, three subjects (each with two daily profiles) were used for training the NNM. Missing samples have been calculated using spline techniques to recover missing samples before using the glucose profiles for training. Patients in the training set did not take part in the validation.
Description of the ARM
The ARM proposed here is the same first-order model used in Sparacino et al.,
10
which corresponds to the time-domain equation:
In Eq. 1, i … = 1, 2, … , n denotes the order of glucose samples collected up to the n
th sampling time tn
, and {wi
} is a random white noise process with zero mean and variance equal to σ
2
. Letting θ = (a, σ2) denote the vector of the parameters of the model, at each sampling time tn
, a new value of θ is determined by fitting past glucose data u
n
, u
n − 1, u
n − 2, … by a weighted linear recursive least squares algorithm. Once θ is determined, the model is used to calculate the prediction of glucose level Q steps ahead, i.e. ûi
+Q
. where Q · Ts
= PH (Ts
is the sensor sampling period). All the past data participate, with different relative weights, in the determination of
A different optimal μ value has been chosen for each dataset and for each PH, minimizing the root mean square error (RMSE) (in mg/dL) between the original data of the training set and the predicted values obtained applying the ARM to it. The training set was the same as that for the NNM (see Description of the NNM for details).
For the Guardian dataset this optimization step suggested the use of μ = 0.695, 0.795, and 0.87 for PH = 15, 30, and 45 min, respectively. For the FreeStyle Navigator dataset, the parameters were μ = 0.92, 0.938, and 0.985 for PH = 15, 30, and 45 min.
Evaluation methodology
Patients in the training set did not take part in the NNM and ARM validation. The validation set for the Guardian monitor included six patients and six profiles per patient. The validation set for the FreeStyle Navigator monitor included three patients and two profiles per patient. The profiles in the training set have been suitably chosen in order to represent both low and high glucose levels, e.g., they contain several hypo- and hyperglycemic events.
Figures 3 and 4 show the original CGM profile and the predictions from the NNM and ARM for 15, 30, and 45 min of PH for the same examples shown in Figure 1a and b, respectively.
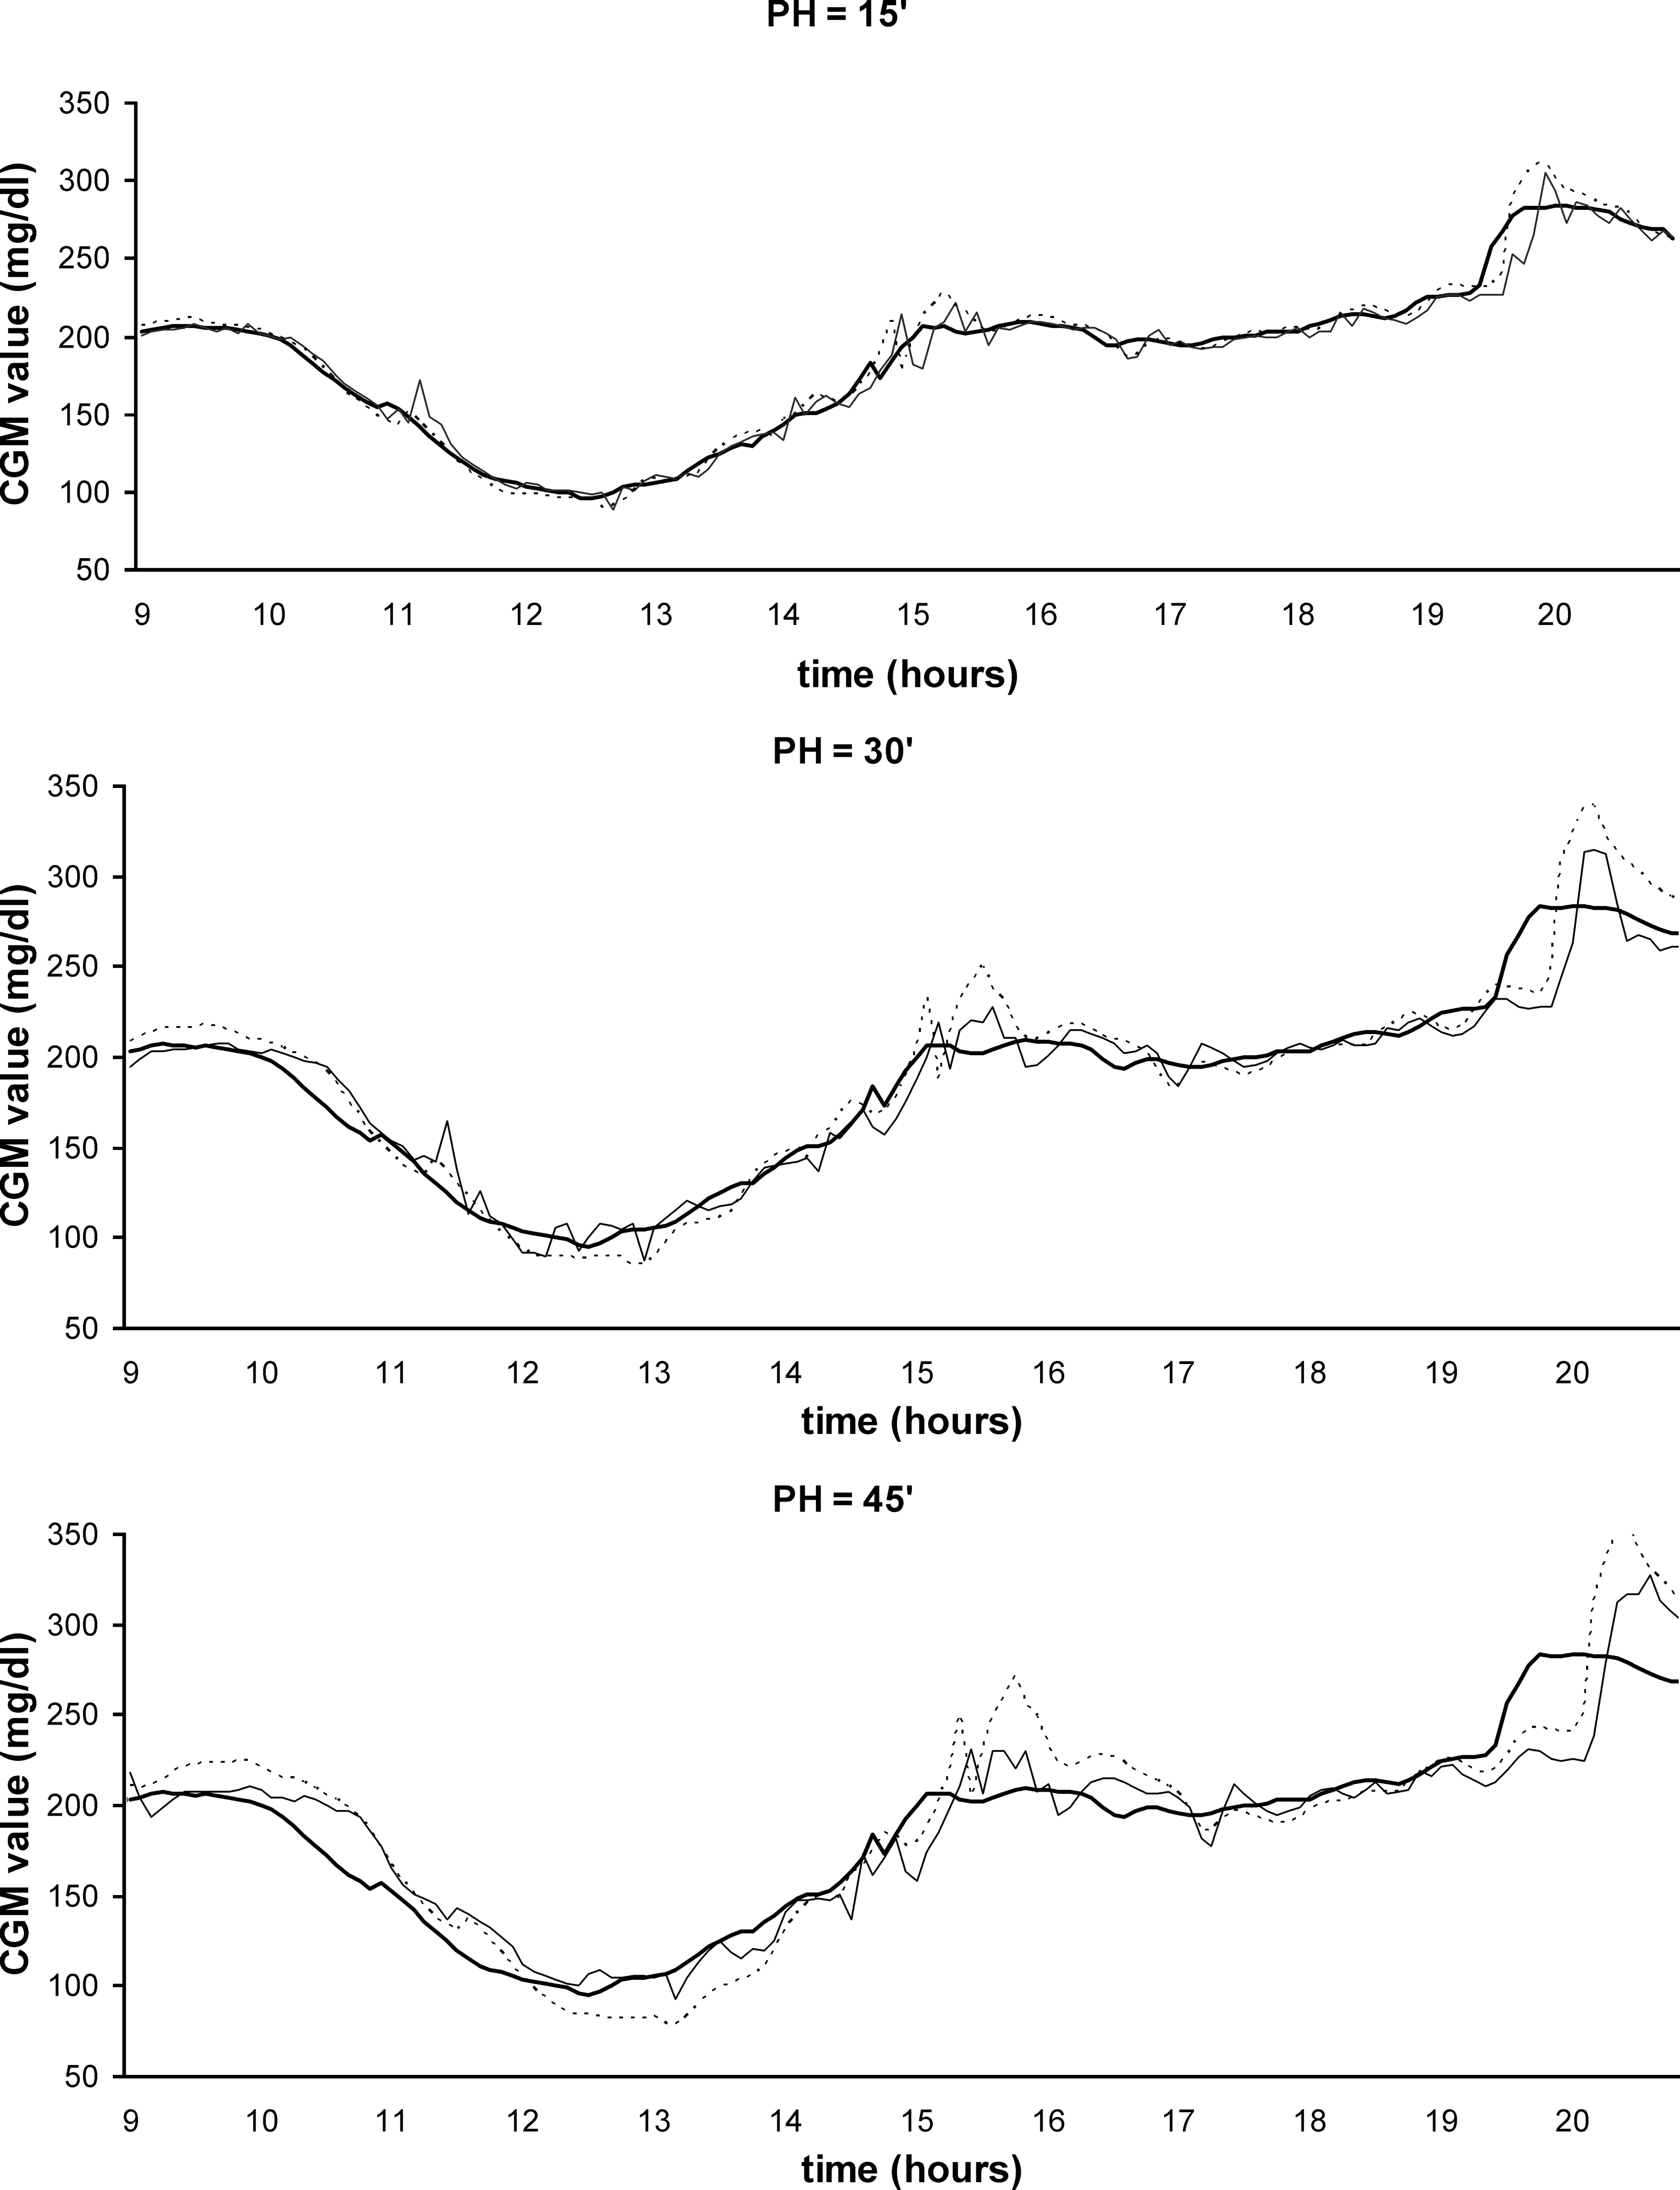
Original Guardian profile (

Original FreeStyle Navigator profile (
To assess the performance of each model, we calculate the model accuracy and the model delay and we evaluate the influence of different PHs (15, 30, and 45 min) on the two parameters.
The model accuracy has been evaluated as the RMSE (in mg/dL) of the predicted profiles versus the original ones.
The model delay has been estimated calculating the delays between the original and the predicted profiles when they cross three different thresholds, defined in the following way. First, peaks and nadirs are identified in the original sensor profile. Then, thresholds are placed at 25%, 50%, and 75% of the nadir-to-peak (P 1 − P′1)/peak-to-nadir (P 2 − P′2) distance for positive/negative trends, respectively (Fig. 5). The final model delay is calculated as the average of threshold delays for every positive and negative trend. Notably, for the Navigator data, the calculated delay includes a contribution due to the use of the prefiltering procedure described in Subjects and dataset.
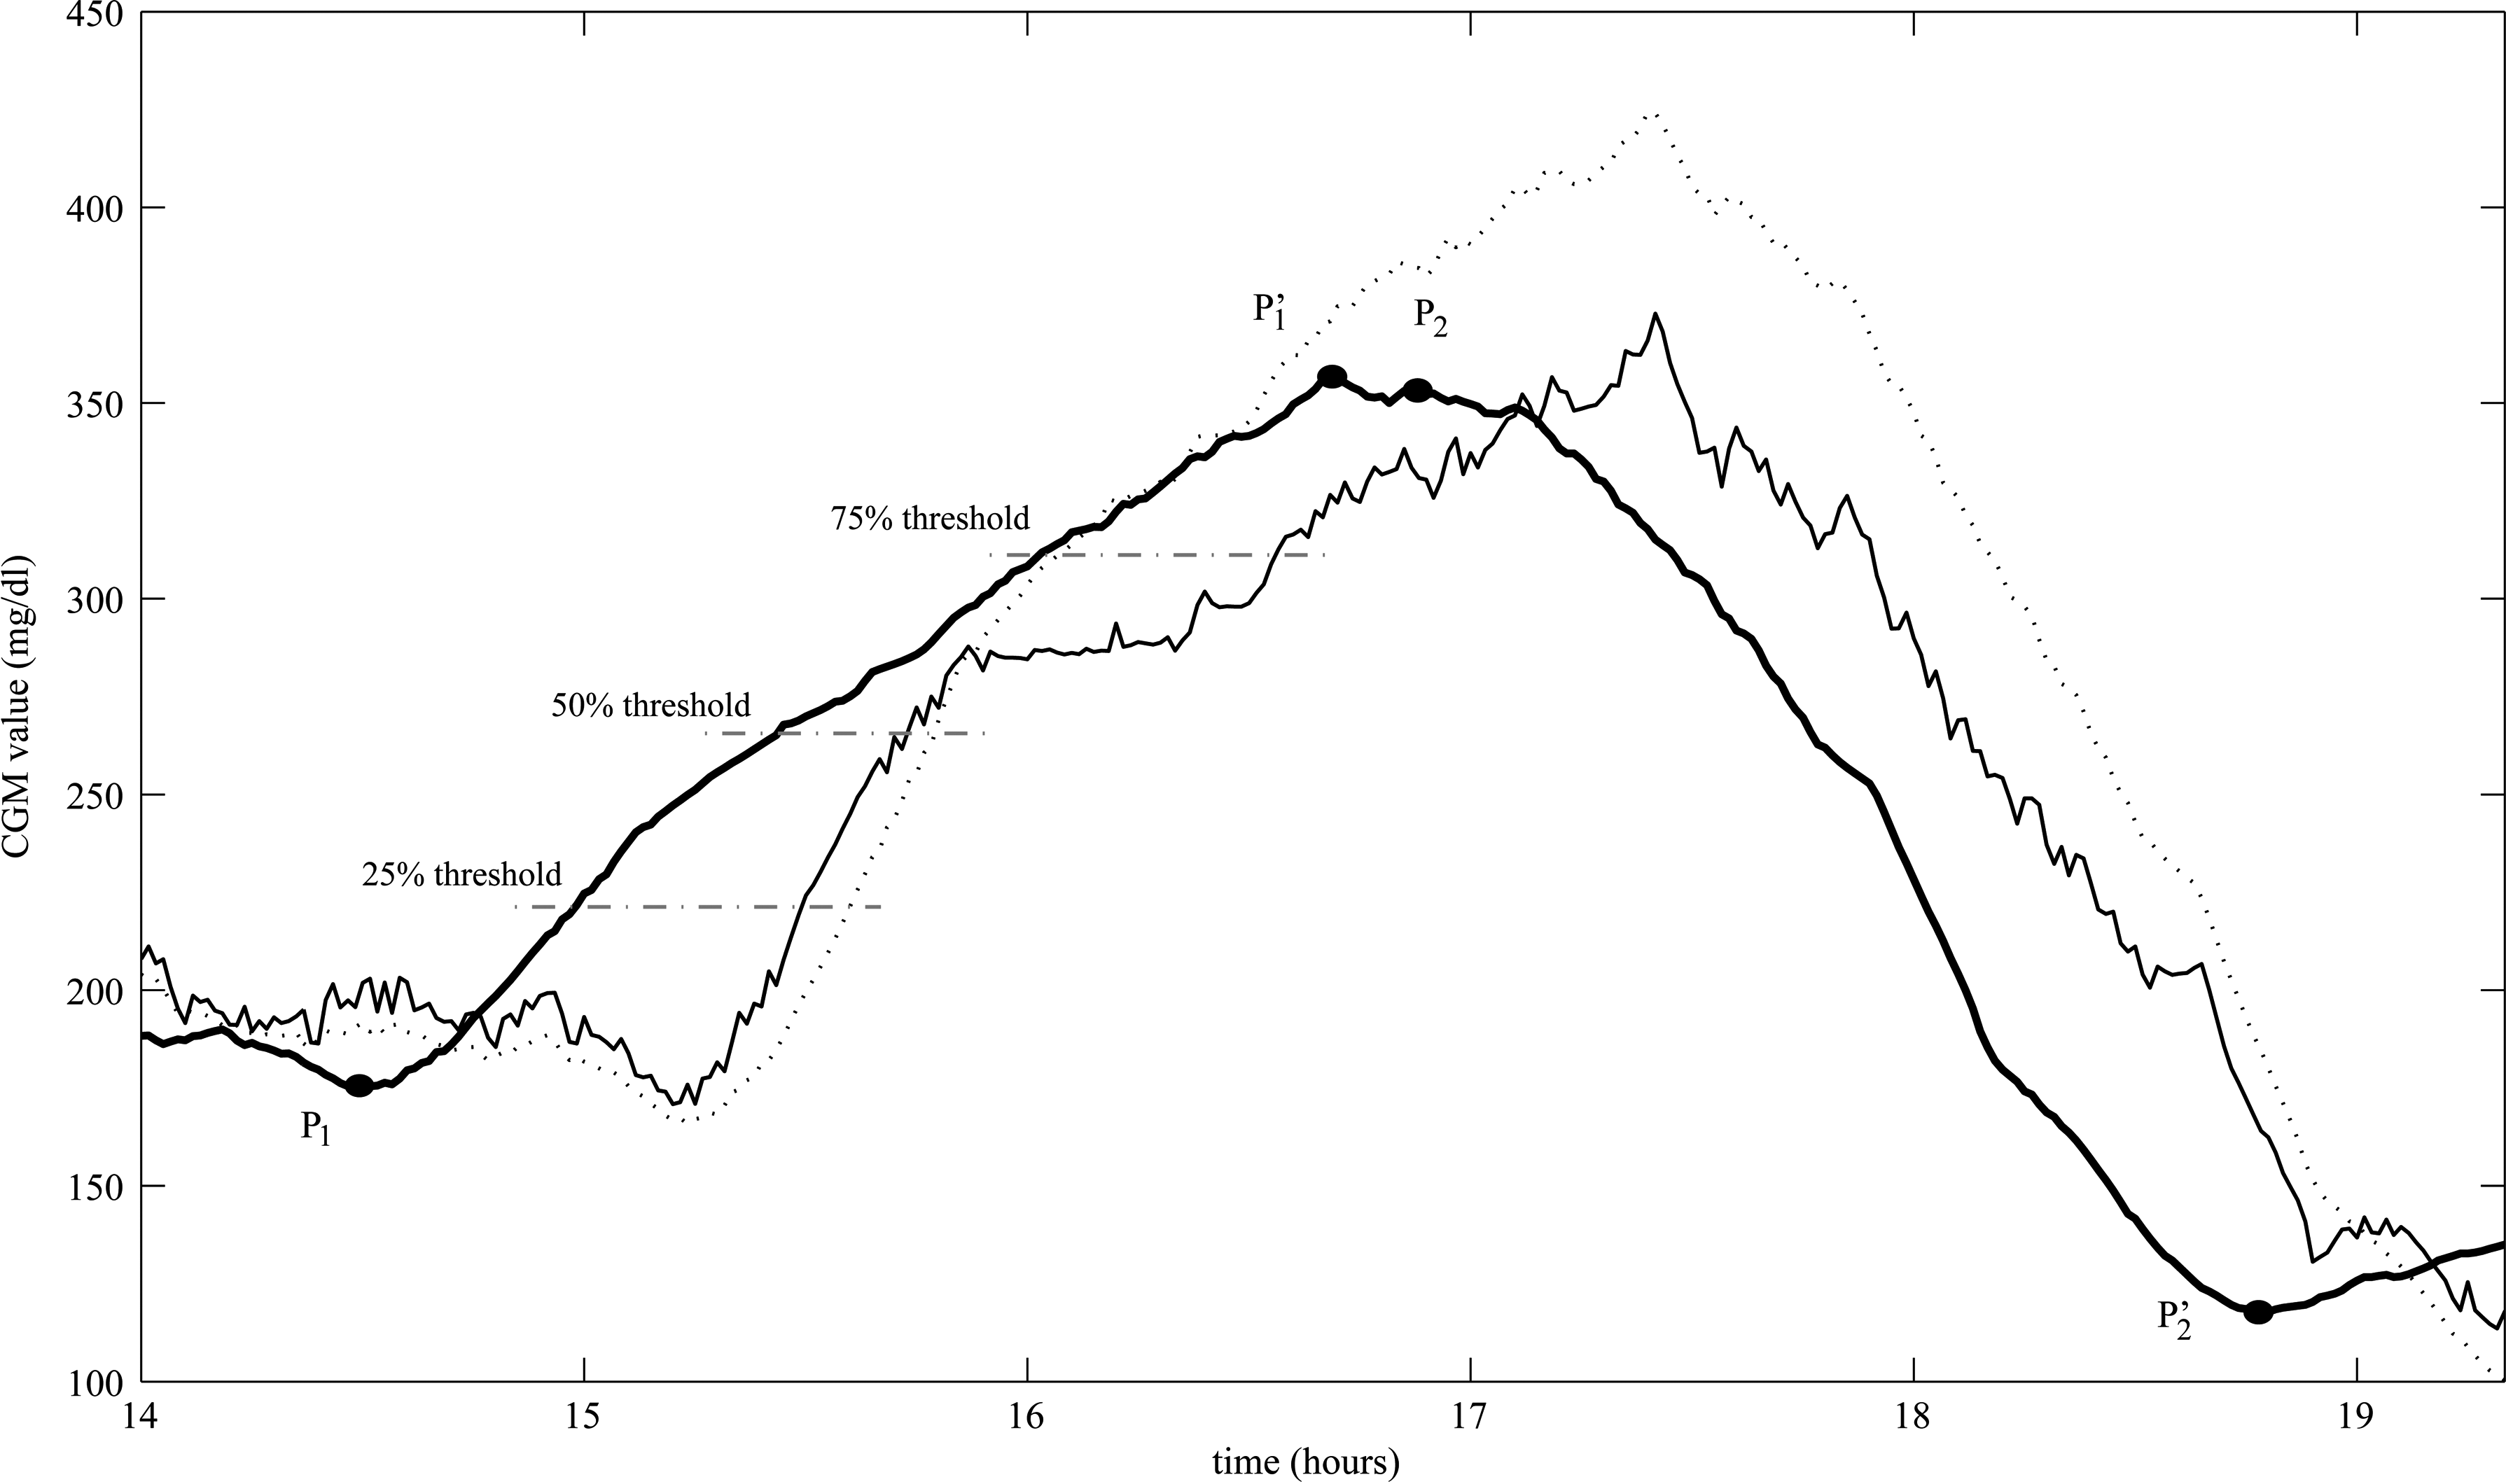
Algorithm to calculate the model delay.
Note that in order to identify threshold crossings more easily, given the retrospective nature of the assessment, the original and the predicted profiles have been filtered by a first-order Butterworth low-pass filter, with normalized cutoff frequency ω n = 0.1 and ω n = 0.03 for the Guardian and FreeStyle Navigator systems, respectively.
The differences in RMSE between the Guardian and the FreeStyle Navigator systems are analyzed with the nonparametric Mann-Whitney U test.
Results
Tables 1 and 2 show the average prediction error, RMSE (in mg/dL) and the standard deviation (SD), for each model (NNM and ARM) when applied to, respectively, the Guardian and the FreeStyle Navigator validation sets. The results are calculated for 15, 30, and 45 min of PH.
Tables 3 and 4 show the respective average delay in minutes and the SD, considering positive (upward) and negative (downward) trends.
The precision of the NNM and the ARM (RMSE values in Tables 1 and 2) is quite similar and very accurate for PH = 15 min (around 10 mg/dL for both models). However, considering PH = 30 and 45 min, the NNM is more accurate than the ARM, presenting lower RMSE values (18 mg/dL vs. 22 mg/dL for PH = 30 min and 27 mg/dL vs. 35 mg/dL for PH = 45 min).
For PH = 15 min the mean delay with the NNM is usually around 3 min longer than for the ARM. When the PH increases, for PH = 30 and 45 min, the ARM is more rapid than the NNM in all cases except for upward trends and FreeStyle Navigator. The delay (Tables 3 and 4) shows that the NNM is useful for PH = 30 and 45 min in helping type 1 diabetes patients to prevent hypo- and hyperglycemic events.
It is interesting to note that both models are more rapid in upward than in downward slopes (Tables 3 and 4). This could be explained by the fact that, for physiological reasons, the upward trends are usually more rapid than the downward trends, and the upward-to-downward changes are usually more marked than downward-to-upward changes. For this reason both models exhibit greater overshooting in the upward-to-downward zones, and the subsequent downward trend is dogged by this effect, so both models exhibit a greater delay in crossing the threshold in the subsequent downward trend.
The nonparametric Mann-Whitney U test shows that the RMSE is lower for the Guardian than for the FreeStyle Navigator system for both the NNM and the ARM (NNM 15 min, NNM 30 min, NNM 45 min, ARM 15 min, ARM 30 min, and ARM 45 min). The differences were always significant (P < 0.01).
Conclusions
From the results, we can conclude that the NNM predictor is a reliable solution to the problem of predicting glucose values from CGM systems. The method presented here is totally causal and can be applied for online glucose prediction. The training algorithm can be executed on a common PC. For the training set size used (six profiles), the training algorithm takes from 1.5 to 2.5 h for Guardian data (it depends on the configuration of the learning algorithm parameters) and from 7.5 to 8.5 h (because of the more frequent sampling rate) for FreeStyle Navigator data. It is important to point out that, once the NNM is trained, the algorithm that calculates the prediction could run in real time even on a portable PDA system.
The results obtained by applying the NNM are very encouraging. In this work, we successfully tested the possibility of applying the NNM by exploiting as input data only the previously collected CGM values. We have proved that, even if the NNM has been trained with a reduced number of profiles, coming from several subjects (excluding individual data) and representing a variety of situations (including hypo- and hyperglycemic events), the prediction is sufficiently accurate. This fact allows us to speculate that if the training set is incremented, almost any changes in glucose profile due to individual metabolic fluctuations may be accurately assessed by the NNM.
However, the fact that only past CGM data are used as input of the NNM introduces some limitations, i.e., it does not allow the NNM to rapidly detect possible sudden changes in the time derivative of the signal due to intrinsic changes (i.e., individual metabolic fluctuations) as well as extrinsic changes (i.e., meal intake and/or insulin injections). Integrating into the model quantitative information concerning, for example, insulin injections and meal intakes could be beneficial to the prediction (i.e., it could also allow the use of a wider PH and facilitate tracking of rapid changes in glucose). However, how to do it is still rather unexplored in the literature (also because of the lack of these pieces of information in the majority of the available databases).
At present, we are investigating new models that take into account intake and insulin delivery in different ways (as simple as possible for the patient) as input data. In order to improve the NNM structure, a new trial protocol has been designed in which meals and insulin delivery are tracked.
The results show that the prediction accuracy is better with the Guardian, even though its sample rate is lower than that of the FreeStyle Navigator.
Several other aspects could be studied in the future. For instance, because the quantitative performance of the predictor seems to be quite dependent on the specific CGM system, it might be interesting to evaluate the NNM with other CGM systems. It could be of interest to analyze the impact on predictors of different sampling rates and different noise variances. In addition, the possibility of predicting the blood glucose rather than the interstitial glucose could be taken into account, i.e., by combining the model with an online deconvolution procedure based on a physiological model for comparing plasma and interstitial fluid glucose kinetics.
Footnotes
Acknowledgments
This work was partially supported by the Spanish FIS grant from the Ministry of Health and Consumer Affairs “ADVISING”—FIS PI060437 and CIBER-BBN (PREDIRCAM) and by the grant “Simulation models and filtering/prediction techniques for the development of an artificial pancreas” from the Italian Ministry of Education, University and Research (PRIN 2007). Prof. Boris Kovatchev (University of Virginia Health System, Charlottesville, VA) is acknowledged for having provided part of the data published in Kovatchev et al. 16
Author Disclosure Statement
The authors have no conflicts of interest.