
Abstract
Background:
The purpose of the analysis was to compare the clinical utility of data from traditional self-monitoring of blood glucose (SMBG) to that of continuous glucose monitoring (CGM).
Methods:
A clinical study of the clinical accuracy of the FreeStyle Navigator® CGM System (Abbott Diabetes Care, Alameda, CA), which includes SMBG capabilities, was conducted by comparison to the YSI blood glucose analyzer (YSI Inc., Yellow Springs, OH) using 58 subjects with type 1 diabetes. The Continuous Glucose-Error Grid Analysis (CG-EGA) was used as the analytical tool.
Results:
Using CG-EGA, the “clinically accurate,” “benign errors,” and “clinical errors” were 86.8%, 8.7%, and 4.5% for SMBG and 92.7%, 3.7%, and 3.6% for CGM, respectively. If blood glucose is viewed as a process in time, SMBG would provide accurate information about this process 86.8% of the time, whereas CGM would provide accurate information about this process 92.7% of the time (P < 0.0001). In the hypoglycemic range, however, SMBG is more accurate as the “clinically accurate,” “benign errors,” and “clinical errors” were 83.5%, 6.4%, and 10.1% for SMBG and 57.1%, 8.4%, and 34.5% (P < 0.0001) for CGM, respectively.
Conclusions:
While SMBG produces more accurate instantaneous glucose values than CGM, control of blood glucose involves a system in flux, and CGM provides more detailed insight into the dynamics of that system. In the normal and elevated glucose ranges, the additional information about the direction and rate of glucose change provided by the FreeStyle Navigator CGM System increases the ability to make correct clinical decisions when compared to episodic SMBG tests.
Introduction
Continuous glucose monitoring (CGM) is designed to approximate this process in its entirety, reflecting trends and rate of change. It is intuitively clear that not only the position (momentary value) of BG, but also its direction and rate of change, would provide better guidance for making more informed treatment choices. This notion was reflected in a consensus guideline for the use of CGM, where the following benefits are listed
3
: Provides patients with “real-time” information about rate and direction of glucose change and alerts them to trends that could lead to hypoglycemia and hyperglycemia Allows patients to more tightly manage their diabetes Promotes understanding of how food, exercise, stress, and other factors affect BG
However, despite the potential advantages of CGM, an individual CGM glucose reading taken in isolation from its adjacent readings is typically not as accurate as a traditional self-monitoring of BG (SMBG) test. Uncertainty about the accuracy of the available CGM devices has been a barrier to their adoption into clinical practice. 3 The question is whether the information provided by CGM for clinical action is represented well by measuring the accuracy of isolated CGM data points. The answer is “certainly no”; the information provided by CGM also includes the trends of the BG process and the rate and direction of change. Any of these components may have a certain degree of inaccuracy, but the combination of all provides very valuable information for making clinical decisions, perhaps even more valuable than the more accurate episodic SMBG data points.
This article attempts to compare the relative value of the information from SMBG and CGM. Specifically, we address the question: what is the impact on clinical accuracy, e.g., actionable clinical information, when no trend or rate information is available?
The concept of clinical accuracy—the accuracy required to achieve the correct clinical outcome—has been particularly useful in evaluating glucose monitors. Clarke et al. 4 introduced the Error Grid Analysis (EGA) to address the clinical accuracy of SMBG measurements, and the technique has gained widespread acceptance. In the EGA, errors in SMBG reading are translated into zones according to the clinical implications: “clinically accurate” readings, “benign errors,” and “clinical errors,” including overtreatment, failures to treat, and erroneous treatment.
The advent of CGM required new measures of clinical accuracy. The consensus guideline for the use of CGm3 recognized the complexity of the CGM data stream and the information it provides and suggested that there should be a set of measures used for testing CGM accuracy, including accuracy of BG value, trend, and rate of change.
To improve the clinical information aspect of accuracy, the traditional EGA was expanded to include CGM in the Continuous Glucose-EGA (CG-EGA), 5 which was recently adopted by the Clinical and Laboratory Standards Institute as the standard for judging CGM clinical accuracy. 6 The CG-EGA, developed for interstitial glucose measuring devices, divides the time series of glucose readings into two assessments: accuracy of individual glucose values and accuracy of the associated rate of glucose change. Glucose values are evaluated with the Point-EGA (P-EGA), which is the same as the original EGA except for an accounting for the time lag of interstitial glucose versus fingertip capillary BG. If the rate of glucose change is known, there can be an accounting for lag. If the rate is small, within ±1 mg/dL/min, the P-EGA is identical to the original EGA.
The accuracy of the rate of glucose change is assessed by the Rate-EGA (R-EGA), which is designed similarly to the P-EGA where deviations from the reference are divided into zones based on clinical implications: “clinically accurate” readings, “benign errors,” or “clinical errors.” The overall accuracy of a CGM reading is assessed by combining the P-EGA and the R-EGA. Readings rated accurate in both grids are considered “clinically accurate.” A P-EGA assessment can be upgraded based on the R-EGA; for example, a “benign error” can be considered “clinically accurate” if an accurate rate would result in the correct clinical judgment. Likewise, a P-EGA reading can be downgraded if the rate is erroneous. In this report, CGM will be examined with particular attention to the effect of rate on clinical accuracy.
In essence, the CG-EGA elevates the concept of “accuracy” of CGM to the level of the utility of actionable information provided. The open question then is how to compare the value of information coming from SMBG to the value of information coming from CGM. Specifically, all the information available from SMBG is a set of isolated points in time; CGM adds to that trend, rate, and direction of BG change. This article attempts to compare these two approaches applying the CG-EGA to both SMBG and CGM data and making reasonable assumptions about the information missed by SMBG.
Research Design and Methods
Clinical study design
This study has been described previously 7,8 and was originally intended to compare FreeStyle Navigator® CGM System (Abbott Diabetes Care, Alameda, CA) interstitial glucose measurements (CGM) and the system's finger stick capillary measurements using FreeStyle test strips (SMBG) to venous glucose measurements with the YSI model 23A BG analyzer (YSI Inc., Yellow Springs, OH).
At three sites, a total of 58 subjects with type 1 diabetes were enrolled. Two sensors were inserted into each subject by a healthcare professional: one on the upper arm and one on the abdomen. Venous samples were obtained through intravenous placement of an angiocatheter, and YSI measurements were performed at 15-min intervals for a total of 50 h in two or three clinic sessions over the 5 days of the sensor lifetime. Subjects were given an insulin challenge and a glucose challenge to assure a wide range of glucose values. The average and SD of YSI readings at the three sites were 187 ± 72 mg/dL (Diablo Clinical Research, Walnut Creek, CA), 180 ± 79 mg/dL (Diabetes and Glandular Disease Clinic, San Antonio, TX), and 161 ± 66 mg/dL (Rainier Clinical Research Center, Renton, WA). Results from the three sites were homogeneous, and the data were pooled.
At the beginning of each clinic session, subjects performed two finger stick SMBG tests associated with each 15-min YSI readings for 2 h. Subjects also tested with SMBG as necessary to conduct their routine diabetes therapy and to calibrate CGM at 10, 12, 24, and 72 h after sensor insertion. The subjects and investigators were blinded to CGM glucose results, but calibration instructions, system error messages, and SMBG values were displayed. Because the purpose of this analysis is to compare SMBG to CGM, of the 20,362 CGM values paired with YSI obtained in the study, only the 2,737 that were matched with simultaneous SMBG tests were used in this analysis.
The study protocol was approved by an institutional review board, and all subjects gave informed consent.
Analysis methods
CGM and SMBG clinical accuracy was evaluated by comparison to YSI. YSI whole blood measurements were multiplied by 1.12 to obtain plasma equivalent values. 9 The reference value paired with the SMBG test was interpolated from the previous and subsequent YSI measurements. The rate calculated from the two YSI measurements was used as the reference rate. If the SMBG and YSI were performed simultaneously (within the same minute), the previous YSI reading was used to calculate reference rate. If the time difference between YSI measurements was >30 min, the data were excluded from the analysis.
When using a BG reading to make a clinical decision, the most reasonable assumption is that the glucose level is not changing sufficiently to influence the clinical action. This is common practice, and the CG-EGA recognizes the validity of this assumption; when the rate is within ±2 mg/dL/min, which is the most prevalent glycemic condition, the assumption of negligible rate does not reduce the clinical accuracy of a glucose value. In order to analyze SMBG data, we assigned rates of 0 mg/dL/min to the SMBG used for R-EGA analysis.
Two replicate SMBG readings were taken in most instances, and one CGM reading from the arm sensor and one from the abdomen sensor were selected for the CGM analysis. If there was a single SMBG reading, an arm sensor reading was used. In the complete analysis of the entire CGM data set, there was no statistical difference between the readings from the two sensor locations, and there was also no significant deterioration over time during the 5-day sensor lifetime. 7 CGM readings were paired with YSI values taken within the same minute, and the methodology for evaluating CGM is as described in the original CG-EGA publication. 5
For the entire P-EGA, R-EGA, and the P-EGA and R-EGA combined, SMBG and CGM were compared by a contingency analysis using a χ 2 test of significance. For the comparison of “clinically accurate,” “benign errors,” and “clinical errors,” a contingency analysis using a two-tail Fisher's Exact test for a significant difference between SMBG and CGM was used for these two-level comparisons. There exists a potential problem of statistical interdependence that occurs with some of the CGM readings that are close in time. To avoid oversampling errors, we adopt a conservative significance level of 0.005 for all results.
Results
Analysis of SMBG
All values reported in this section are summarized in Table 1 under the heading SMBG.
Hypo, hypoglycemia (glucose <70 mg/dL); Eu, euglycemia (glucose 70–180 mg/dL); Hyper, hyperglycemia (glucose >180 mg/dL); NA, not applicable.
For the entire P-EGA, R-EGA, the P- and R-EGA combined, and the data stratification, SMBG and CGM were compared by a contingency analysis using a χ 2 test of significance. For the comparison of “clinically accurate,” “benign errors,” and “clinical errors,” a contingency analysis using a two-tail Fisher's exact test for a significant difference between SMBG and CGM was used for these two-level comparisons. To avoid oversampling errors, the significance level for all results is 0.005.
In the P-EGA and R-EGA, the clinical errors were the sum of Zones C, D, and E.
P-EGA
Because the SMBG tests were assigned a rate of 0, the P-EGA is identical to the original EGA used to evaluate traditional SMBG monitors. 5 The SMBG measurements exhibited a slight high bias versus the venous YSI measurements (Fig. 1). Capillary BG is higher than venous BG by 2–5 mg/dL at fasting, and the positive bias increases after meals. 9 Despite this sampling error, the P-EGA assessment indicated acceptable performance in all glucose ranges: “clinically accurate” results were 90.8% in hypoglycemia (<70 mg/dL), 95.1% in euglycemia (70–180 mg/dL), and 97.4% in hyperglycemia (>180 mg/dL), and all data were rated 96.0% “clinically accurate,” 3.7% “benign errors,” and 0.4% “clinical errors.”
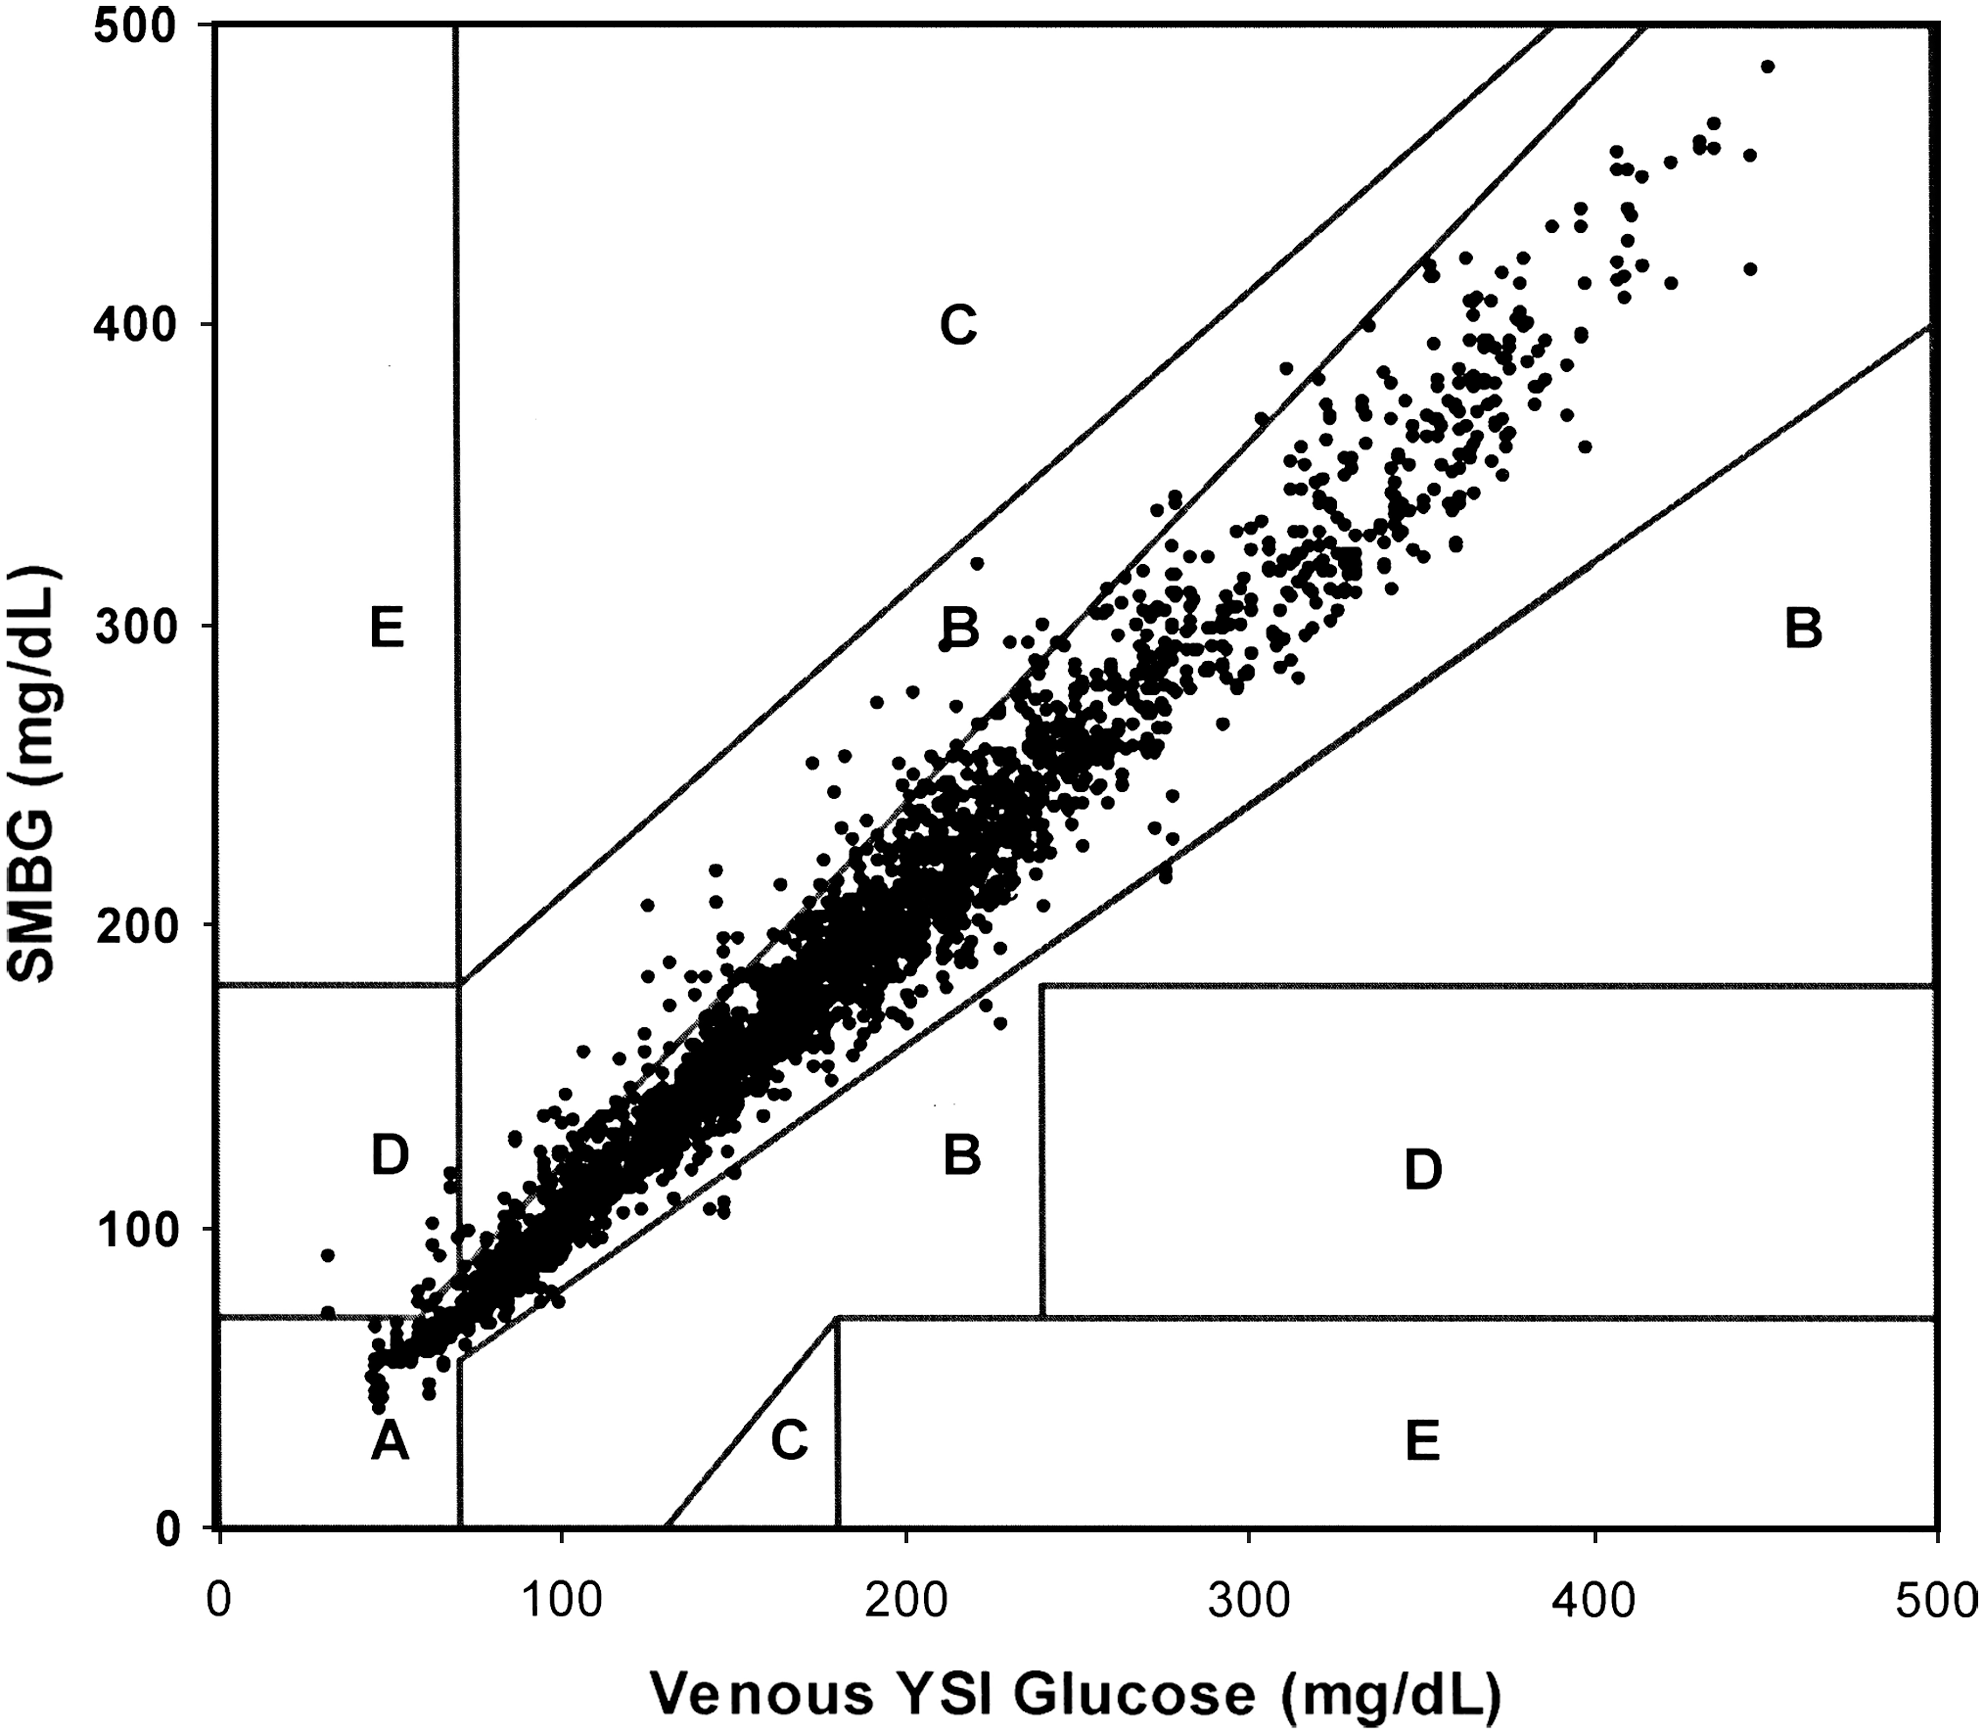
P-EGA of SMBG (FreeStyle Navigator BG readings): Zone A, clinically accurate; Zone B, benign or no treatment error; Zone C, overcorrection error; Zone D, potentially dangerous failure to detect hypo- or hyperglycemia; Zone E, erroneous treatment.
R-EGA
Because we assume that the rate of change of the SMBG data points is 0, the R-EGA applied to SMBG simply reflects the distribution of rates of change in the reference data (Fig. 2): 65.9% of all data were “clinically accurate,” which was the case when the reference rate was between ±1 mg/dL/min. An additional 21.2% of all data were “benign errors” (reference rate ±1–2 mg/dL/min), and 12.9% were “clinical errors” (reference rate greater than ±2 mg/dL/min). The “clinical errors” were D Zone failures to detect rapidly changing glucose.
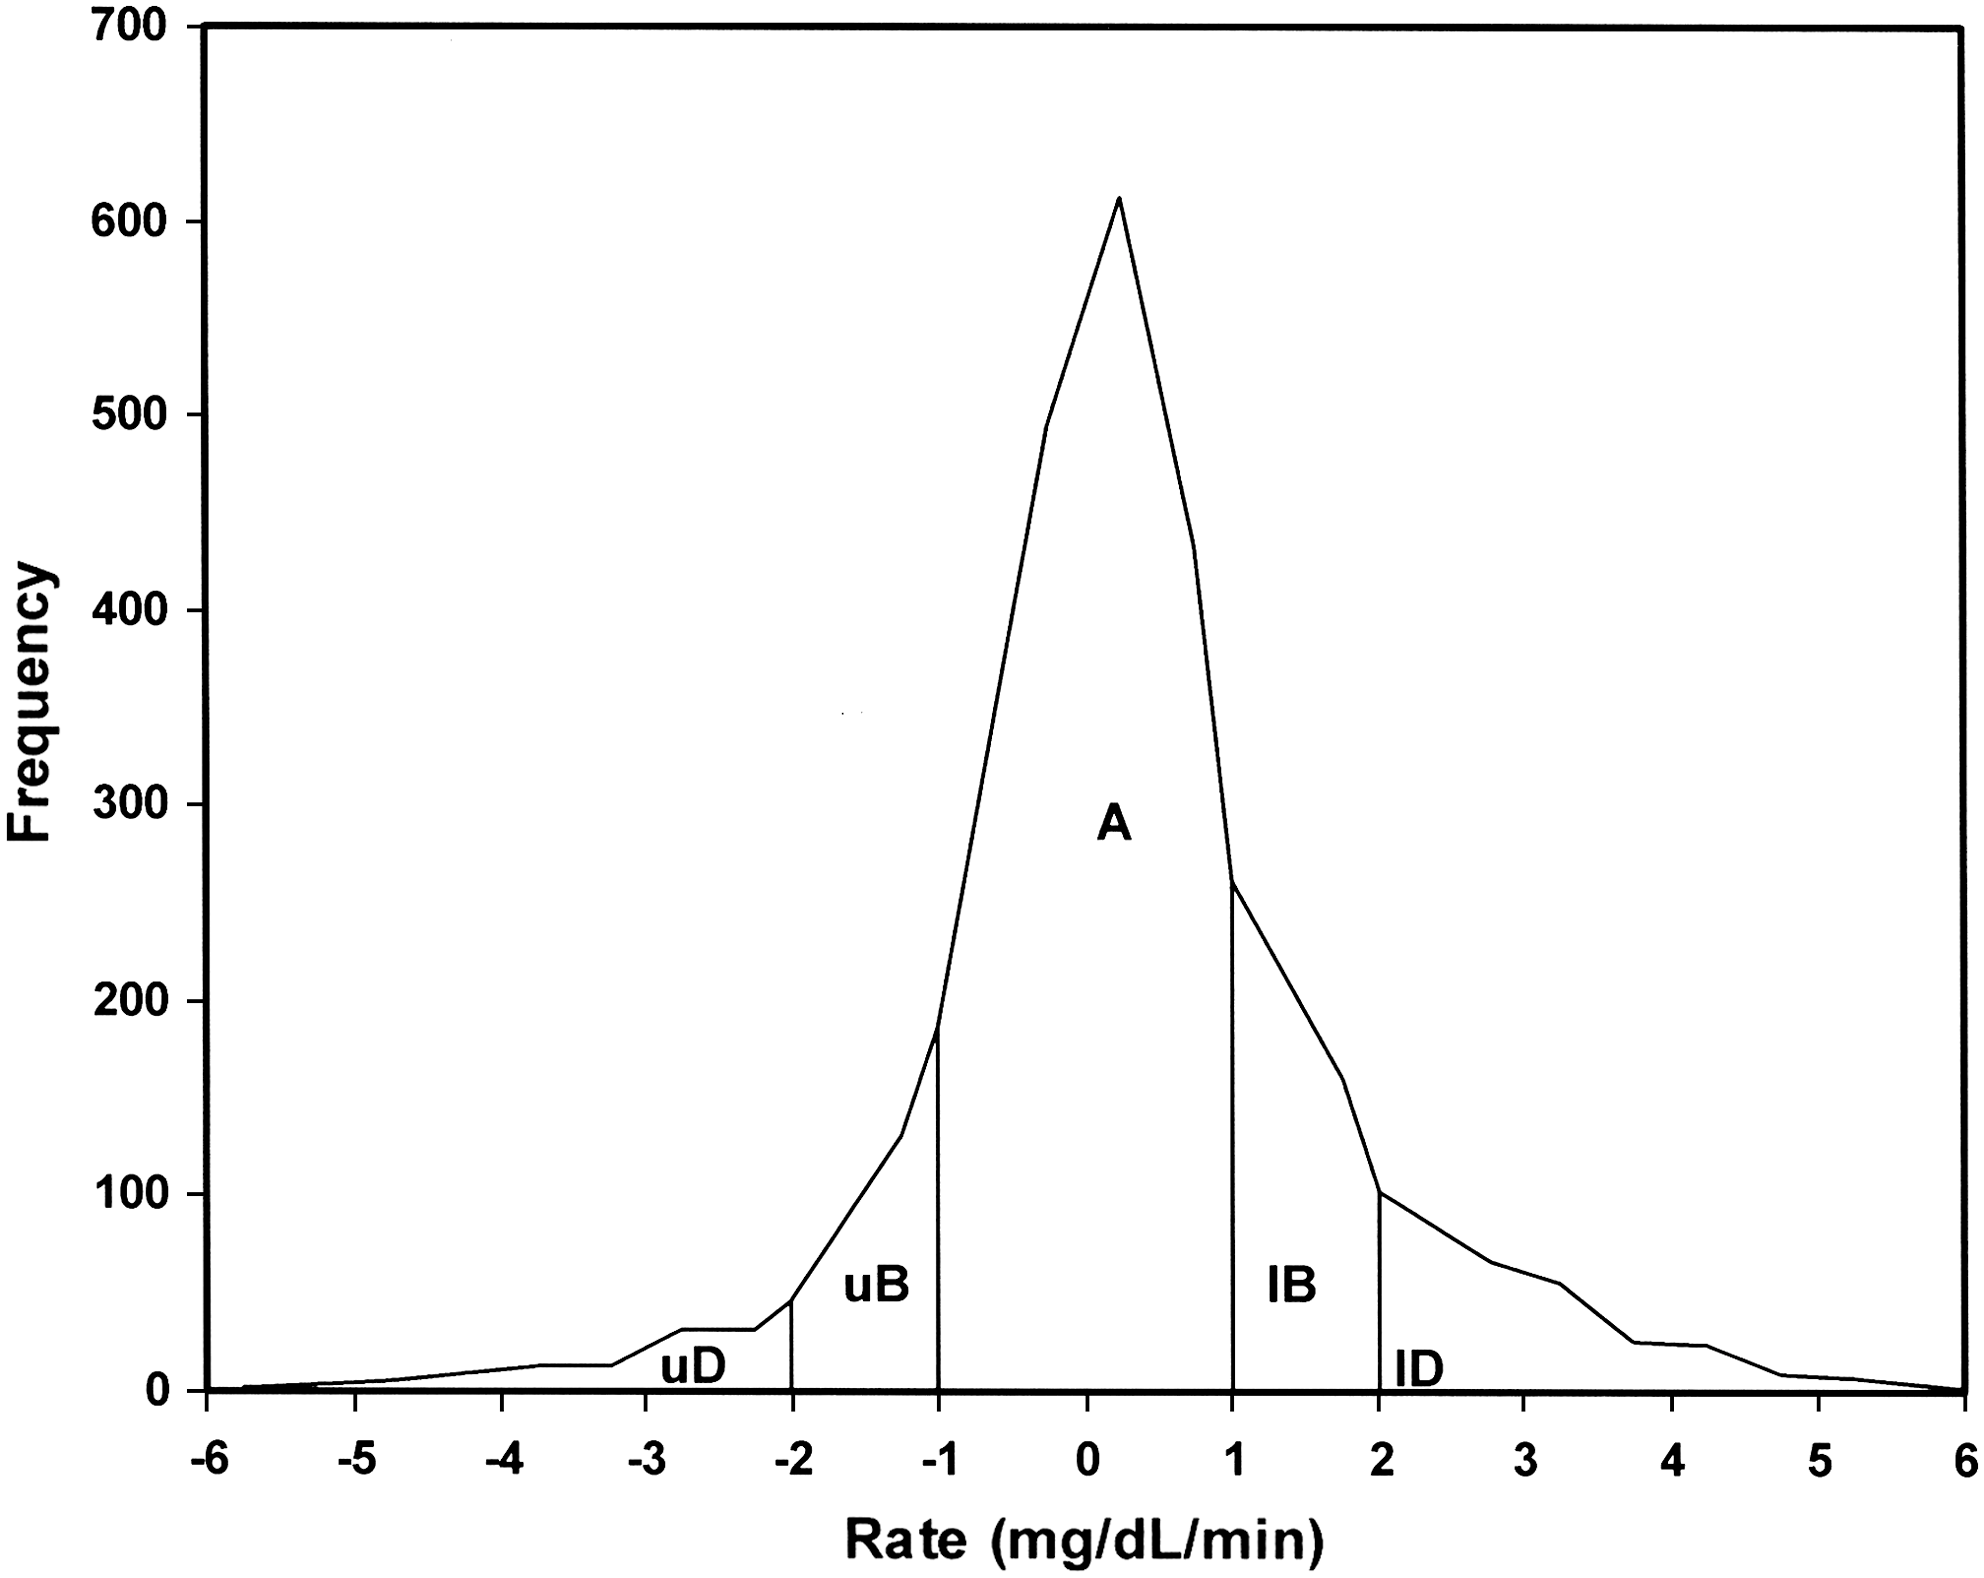
Distribution of reference rates for SMBG tests with associated R-EGA accuracy ratings when the assumed rate is 0 mg/dL/min: Zone A, clinically accurate rate; Zone uB (upper B), benign overestimation of rate; Zone lB (lower B), benign underestimation of rate; Zone uD (upper D), failure to detect a rapidly descending rate; Zone lD (lower D), failure to detect a rapidly rising rate.
Combined P-EGA and R-EGA
The accurate and benign ratings from the R-EGA do not reduce the accuracy of the P-EGA results, but the D Zone R-EGA ratings downgraded the P-EGA results in all glycemic regions. The “accurate readings” for SMBG were 83.5% in hypoglycemia, 89.2% in euglycemia, and 84.5% in hyperglycemia. All data were rated 86.8% “accurate readings,” 8.7% “benign errors,” and 4.5% “clinical errors.” Thus, if BG is viewed as a process in time, SMBG readings would provide accurate information about this process 86.8% of the time.
Analysis of CGM
All values reported in this section are summarized in Table 1 under the heading CGM.
P-EGA
In the evaluation of CGM (Fig. 3), the ratings for all data were 82.0% “clinically accurate,” 16.1% “benign errors,” and 1.9% “clinical errors.” SMBG point accuracy was superior to CGM, as expected (P < 0.0001).
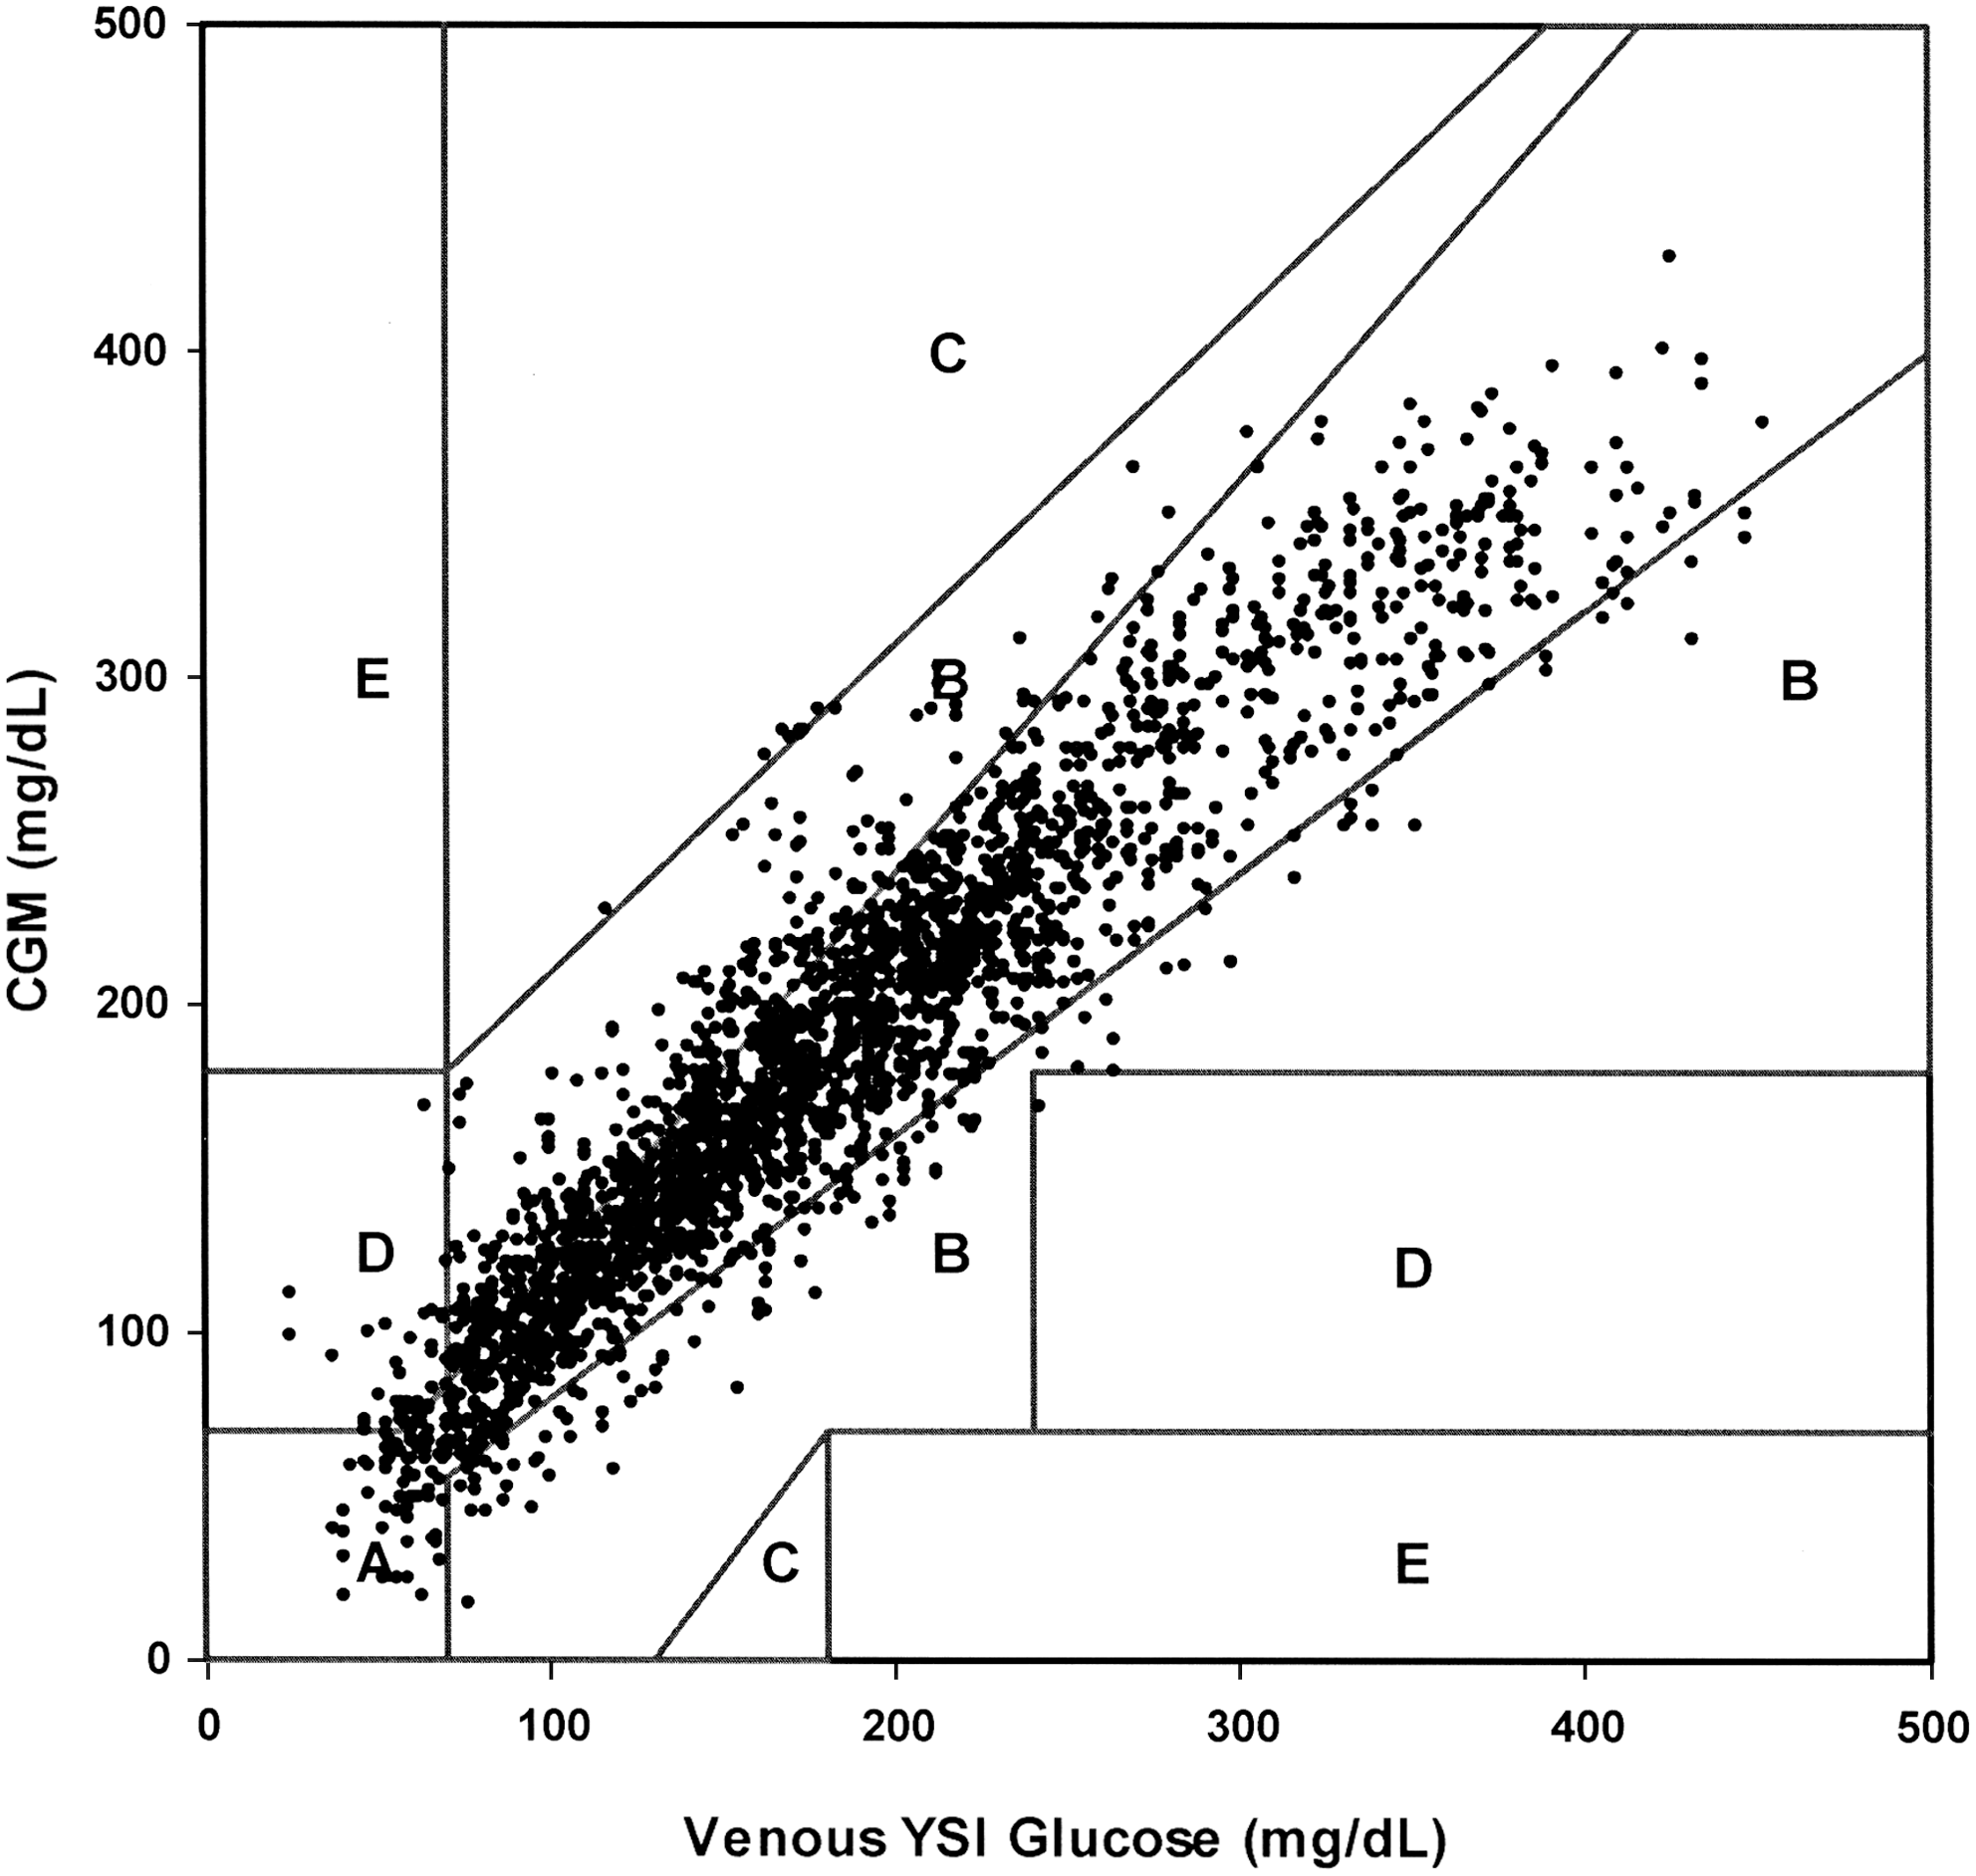
P-EGA of CGM (FreeStyle Navigator continuous interstitial glucose readings). The presentation of the P-EGA results has been altered for illustration purposes. Normally the P-EGA zones are expanded to correct for lag; in this illustration, the appropriate lag expansions were applied to the CGM readings in order for the CGM results to be presented on the same grid as SMBG.
R-EGA
The R-EGA for all CGM data indicated 78.2% “clinically accurate,” 16.3% “benign errors,” and 5.5% “clinical errors” (Fig. 4), which is a significant improvement over an assumption of negligible rate of change (P < 0.0001).
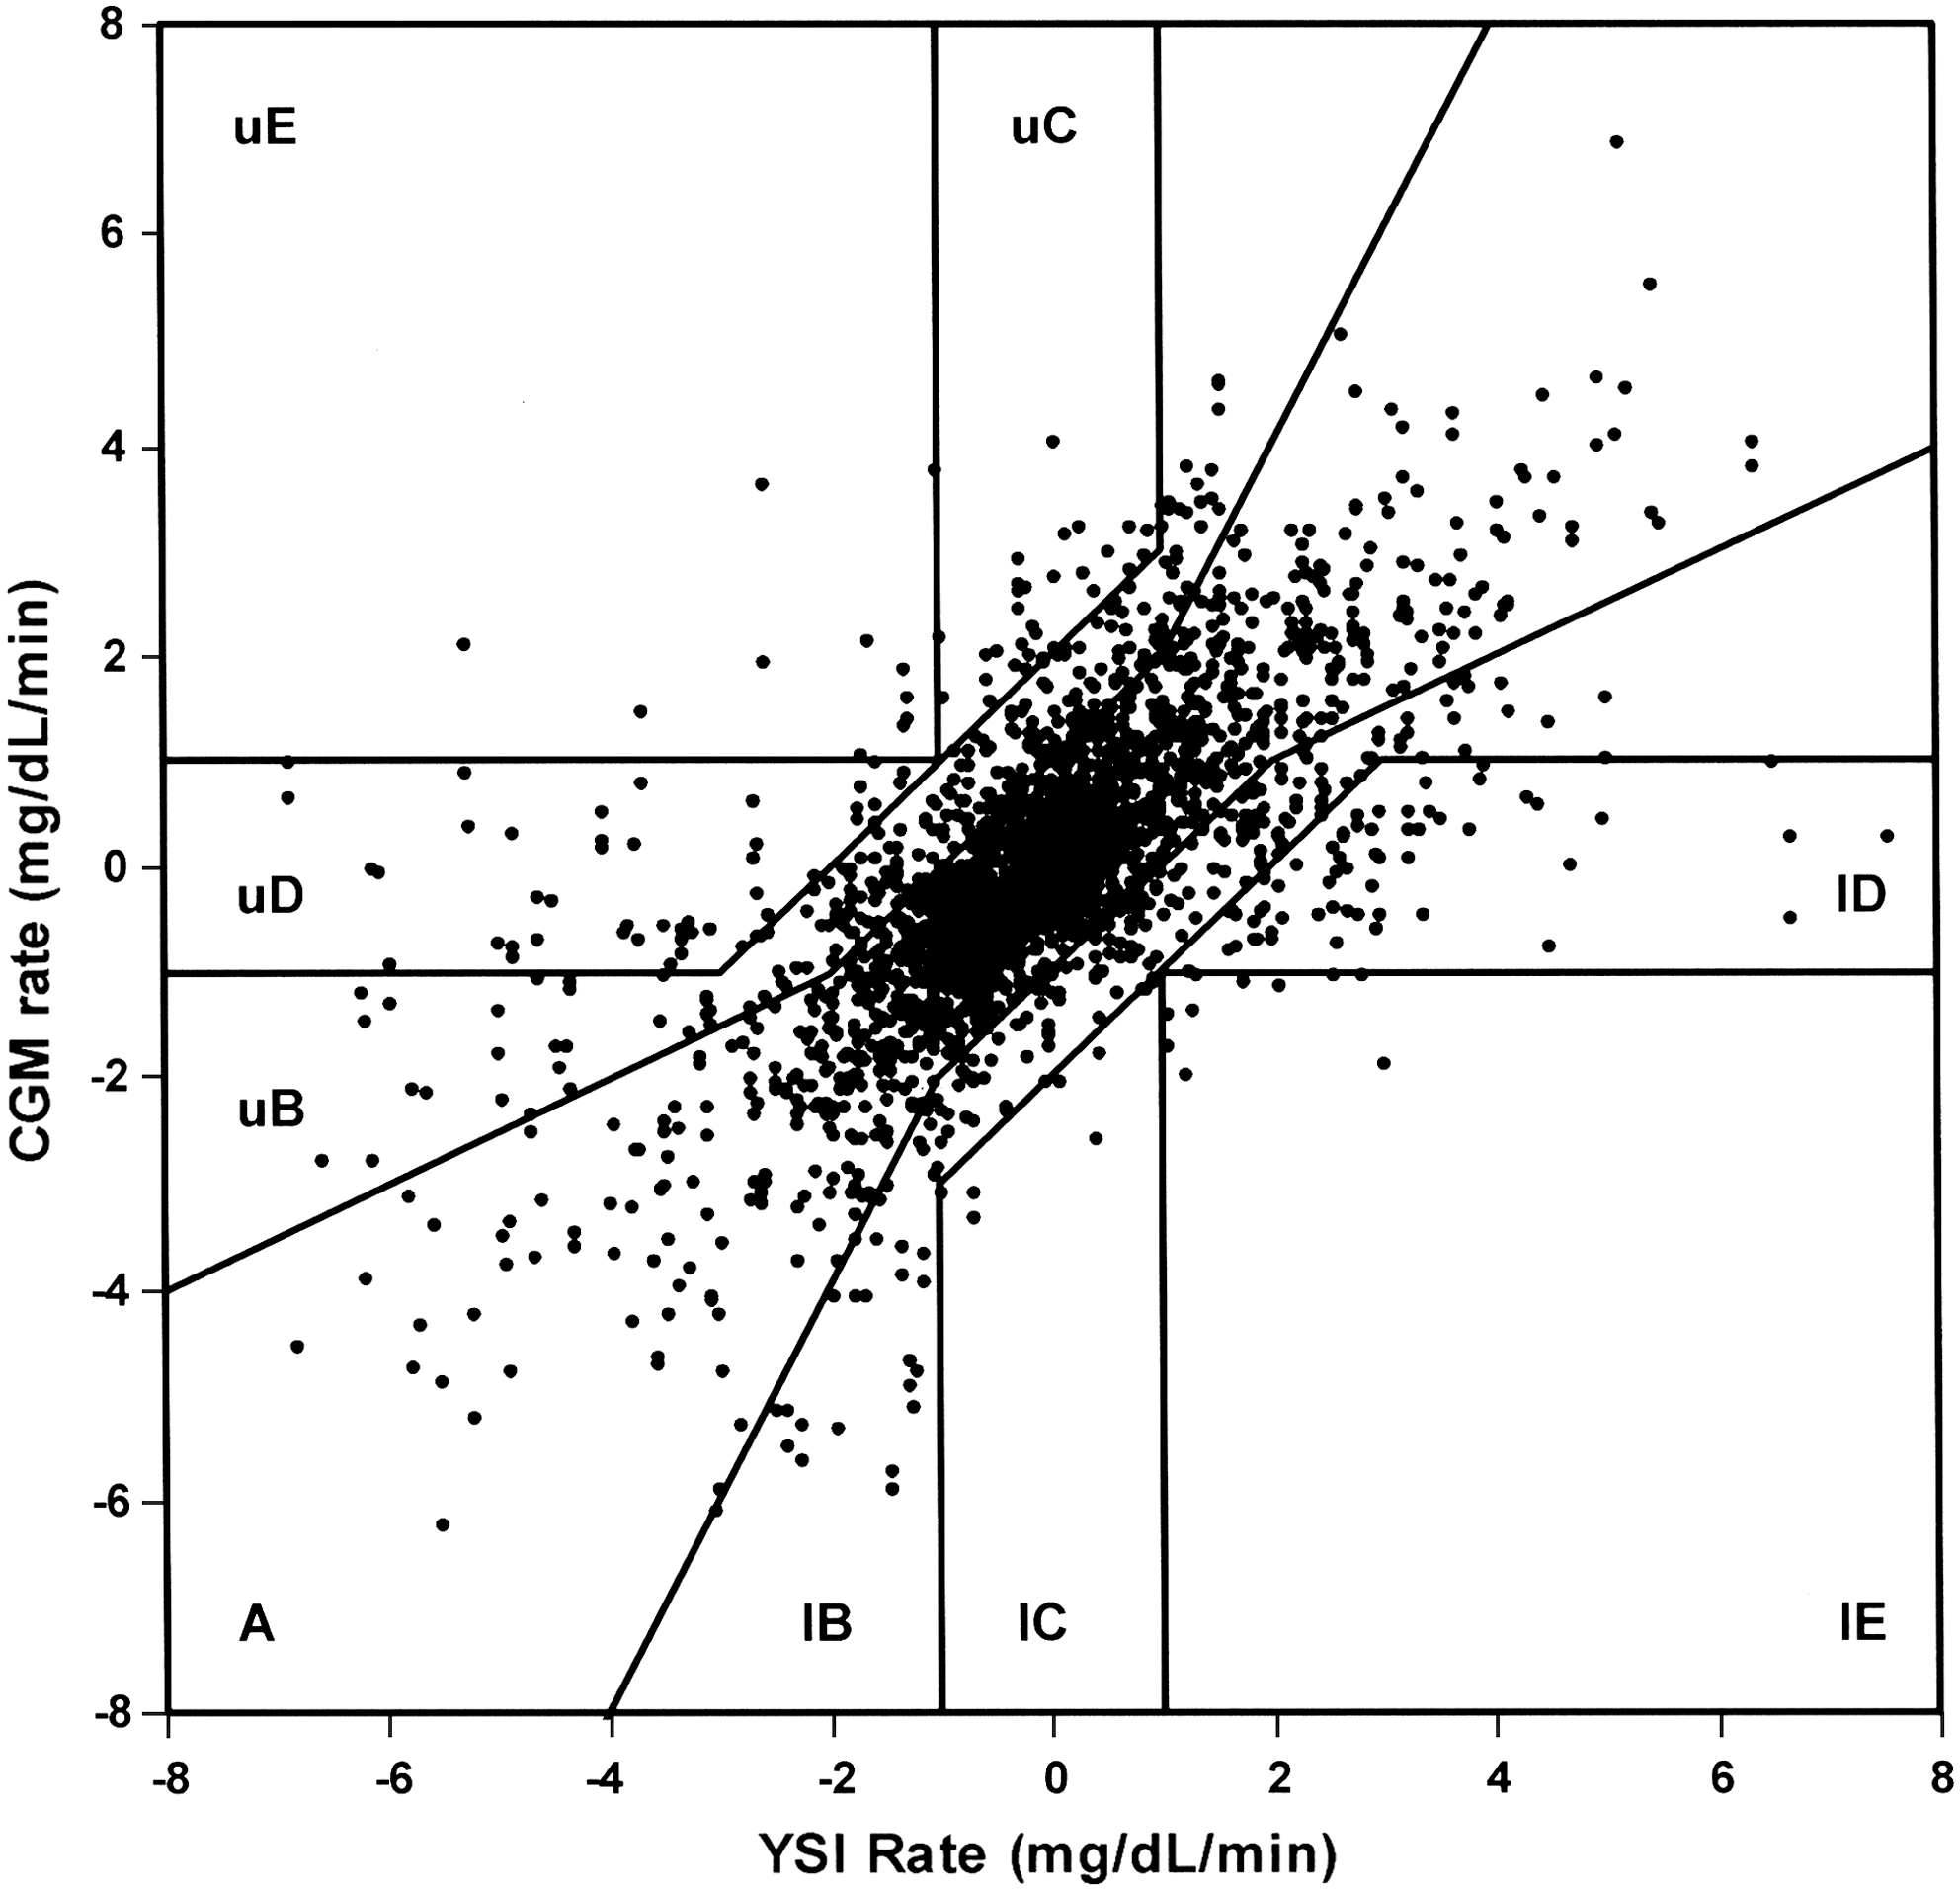
R-EGA of CGM (FreeStyle Navigator continuous interstitial glucose) rates: Zone A, clinically accurate rate; Zone uB (upper B), benign overestimation of rate; Zone lB (lower B), benign underestimation of rate; Zone uC (upper C), erroneous overestimation of rising rate; Zone lC (lower C), erroneous overestimation of descending rate; Zone uD (upper D), failure to detect a rapidly descending rate; Zone lD (lower D), failure to detect a rapidly rising rate; Zone uE (upper D), erroneously predicting rising rate when rate is descending; Zone lE (lower E), erroneously predicting descending rate when rate is rising.
Combined P-EGA and R-EGA
In the hypoglycemic range, accurate R-EGA readings cannot upgrade P-EGA results, but erroneous R-EGA readings can downgrade the P-EGA results. In hypoglycemia, the R-EGA ratings reduced the “clinically accurate” ratings from 65.6% in the P-EGA to 57.1% “accurate results,” although this difference is not significant (P = 0.1054). In the euglycemic range, however, the R-EGA ratings significantly upgraded those from P-EGA: from 75.1% “clinically accurate” in P-EGA to 94.4% in the combined grids (P < 0.0001). Likewise in the hyperglycemic range, the “clinically accurate” readings improved from 91.6% in P-EGA to 94.3% (P = 0.0069). The CG-EGA ratings of all CGM data were 92.8% “accurate readings,” 3.7% “benign errors,” and 3.6% “erroneous readings.” Thus, when BG is viewed as a process in time, CGM readings would provide accurate information about this process 92.8% of the time.
Discussion
When BG is changing rapidly the assumption of negligible rate that is inherent with SMBG can lead to clinical errors. The CG-EGA can be used to determine the impact of these errors on the clinical decisions derived from SMBG and to compare the information extracted from SMBG to information extracted from CGM. In this report, we used CG-EGA to judge the clinical information utility of SMBG tests assuming a rate of 0 for SMBG in the R-EGA. Because BG fluctuations are a process in time, such an approach “levels the field” when comparing SMBG versus CGM. In other words, if SMBG and CGM are compared only on the basis of point accuracy assessed in isolated points in time, much of the information available from CGM is discarded; CG-EGA utilizes equally all of the information available from SMBG and CGM.
The FreeStyle Navigator CGM System did not approach the superior accuracy of SMBG in the hypoglycemic region: 57.1% “accurate readings” for CGM and 83.5% for SMBG (P < 0.0001). However, CGM and SMBG can be effectively combined for detection and treatment of hypoglycemia. In another analysis of this study data, a FreeStyle Navigator low glucose alarm setting at 85 mg/dL provided a detection rate of 90.6% within 30 min of the start of hypoglycemia (glucose <70 mg/dL) with a 22.8% rate of alarms occurring when no treatment was necessary (glucose >85 mg/dL). 8 If the alarms are confirmed with SMBG, there is little risk of overtreating hypoglycemia because the point accuracy of SMBG was good in this range, 90.8% “clinically accurate.” Although this strategy is effective for detecting hypoglycemia, this benefit must be weighed against the disruption of daily activities due to unnecessary alarms.
The situation is significantly different in the euglycemic range. Errors in point glucose on the order of ±20–30 mg/dL often have little or no impact in this region where the range is relatively large, 70–180 mg/dL. Glucose change, however, plays a more important role because changes can take one out of this ideal target range, and changes must be anticipated because there is a time lag associated with the necessary treatments. Setting CGM high and low glucose alarm thresholds in the normal range is potentially quite useful, as treatment when BG is still normal can avoid excursions into hypo- or hyperglycemia. Despite superiority in point accuracy, SMBG readings in the euglycemic range do not provide the necessary information to remain in range when glucose is changing. The FreeStyle Navigator CGM System provided the more accurate clinical information in this glycemic range: 94.4% “accurate readings” for CGM and 89.2% for SMBG (P < 0.0001).
In the hyperglycemic region, insulin is required to return BG to normal, and the rate of glucose change can have a significant impact on an insulin dose. It requires a larger dose of insulin to reverse ascending BG than to continue a downward trend. With an accurate glucose but no rate information from a SMBG test, insulin adjustments tend to be “clinically accurate” or the “benign errors” during times when glucose change is not extreme, but with high rates of change, “clinical errors” in SMBG tests increased from 0.0% in P-EGA to 9.0% when rate was factored in (P < 0.0001). At high glucose levels, the tradeoff of superior point accuracy for an indication of rate favored CGM: 94.3% “accurate readings” for CGM and 84.5% for SMBG (P < 0.0001).
Conclusions
In conclusion, the standard of care for type 1 diabetes requires frequent finger stick glucose tests. While the obvious advantage of CGM is the more frequent feedback of glucose level, the information of the rate and direction of glucose change is essential for optimum therapy. 3 The CG-EGA assessment of the clinical accuracy is more sophisticated than the EGA used to assess SMBG tests. In essence, the CG-EGA judges the utility of all information (point plus direction and rate of change) available for a clinical decision. Consequently, when all the information available from SMBG was compared to the information available from CGM, CG-EGA indicated a significant advantage for CGM due to the simple fact that CGM provides rate information combined with the glucose values. CG-EGA also pointed out significant drawbacks in SMBG testing when the rate information was absent. This is not to say that CGM provides the most accurate clinical information in all situations as SMBG is far more accurate in the hypoglycemic range. Also, this analysis includes only a single CGM and SMBG device, and the results should not be extrapolated to all devices.
The currently available first-generation CGM products are far more complex than the SMBG test systems that have been optimized for ease of use for decades. Nevertheless, the path to an improved standard of care for type 1 diabetes favors the further development of CGM because CGM can be capable of delivering greater clinical utility than SMBG.
Appendix
Transformation of CGM data in Figure 3
In the CG-EGA, the borders of the P-EGA are expanded to account for time lag in interstitial fluid glucose with respect to BG. For example, when the rate of change is −1 to −2 mg/dL/min, the interstitial fluid glucose will tend to be higher than the BG value by an average of 10 mg/dL. To account for this difference, the upper borders of the P-EGA zones are expanded by 10 mg/dL. In the CG-EGA, the P-EGA is actually five different grids to accommodate the following ranges of glucose rate of change: less than −2 mg/dL/min, −1 to −2 mg/dL/min, ±1 mg/dL/min, +1 to +2 mg/dL/min, and greater than +2 mg/dL/min. To collapse the P-EGA to a single grid in Figure 3, rather than expanding the borders of the grid, the expansion was applied directly to the CGM value. As in the example above, rather than expanding the upper borders of the P-EGA zones by 10 mg/dL when the rate is −1 to −2 mg/dL/min, the 10 mg/dL expansion was approximated by subtracting 10 mg/dL from the CGM glucose value. This transformation of the CGM values is an approximation and was only used for illustrative purposes in Figure 3. In the actual data analysis, the CG-EGA was performed exactly as described in the original publication.
Footnotes
Author Disclosure Statement
G.V.M. is an employee of Abbott Diabetes Care, the manufacturer of the FreeStyle Navigator Interstitial Glucose Monitoring System and FreeStyle Test Strips. B.P.K. and W.L.C. have received research support from Abbott Diabetes Care.
This study is registered with number NTC00920881 at