




Abstract
Background:
This study describes the levels of protein acting as biomarkers affecting hypertensive diabetic nephropathy in the local Pakistani population.
Methods:
Patients with both hypertensive nephropathy and diabetes type 2 and normal healthy controls were recruited from Sheikh Zayed Hospital, Lahore, Pakistan. Individuals were equally divided into three different groups: group A was the control, group B was hypertensive without diabetic nephropathy, and group C was hypertensive with diabetic nephropathy. Biochemical parameters related to the hypertensive diabetic nephropathy and specific proteins markers were analyzed by two-dimensional liquid chromatography followed by mass spectrometric standard reference protocols. The proteins that showed variation between test and control samples were identified by mass spectrometric analysis.
Results:
The biochemical data showed significantly higher values of fasting blood sugar, diastolic and systolic blood pressure, and total serum and urinary proteins in the diabetes groups with hypertension but with or without nephropathy compared to the control group. The levels of proteins that act as biomarkers like albumin were the most significant in urine samples of hypertensive diabetic nephropathy group A compared to groups B and C.
Conclusions:
The prevalence of proteins in hypertensive patients with diabetic nephropathy is higher compared to that in normal patients without nephropathy in the Pakistani population.
Background
Therefore, the goal of the present study was to conduct a urinary proteomic analysis for determination and characterization of protein markers in the local population of Pakistan. This will certainly contribute in early detection and perhaps a possible treatment of this complication in hypertensive diabetic nephropathy and kidney failure.
Materials and Methods
Clinical samples
The 50 diabetes type 2 patients (25 female and 25 male) with or without hypertensive nephropathy and 50 (25 female and 25 male) normal healthy controls were recruited from Sheikh Zayed Hospital, Lahore, Pakistan. Individuals were equally divided into three different groups: group A was the control, group B was hypertensive without diabetic nephropathy, and group C was hypertensive with diabetic nephropathy.
Ethical approval of the study
Ethical approval for the study was given by the Ethical/Protocol/Synopsis Committee of FPGMI (Shaikh Zayed Federal Post Graduate Medical Institute, Lahore).
Estimation of biochemical parameters
Blood and 24-h urine samples were collected from the selected subjects. Ten milliliters of blood was drawn into serum tubes from diabetes patients as well as healthy controls after an overnight fast. After centrifugation at 16 g for 45 min at 8°C, the serum was carefully removed, aliquoted, and frozen at −80°C until further use. Serum was used to assay for biochemical parameters like uric acid, creatinine, and blood urea nitrogen (BUN) related to the hypertensive diabetic nephropathy by standard reference protocols 9 –15 provided by kits from Roche Diagnostics (Indianapolis, IN). From the urine samples, urine creatinine, albumin excretion rate (AER), total urinary proteins, and specific proteins markers were analyzed by standard kit protocols and a two-dimensional liquid chromatographic system followed by mass spectrometric standard reference protocols. 16 High abundance proteins like albumin and immunoglobulins were removed from the serum of controls and diabetes patients by a Calbiochem Proteo-extract kit (Merck Bioscience, Darmstadt, Germany).
Identification and characterization of protein biomarkers
Sodium dodecyl sulfate (SDS)-polycrylamide gel electrophoresis (PAGE) analysis
A very common method for separating proteins by electrophoresis uses a discontinuous polyacrylamide gel as a support medium and SDS to denature the proteins. This method is called SDS-PAGE. The most commonly used system is also called the Laemmli method. 17 In 1979 Switzer et al. 18 introduced silver staining, a technique that today provides a very sensitive tool for protein visualization with a detection level down to the 0.3–10 ng level. Amersham Biosciences (Uppsala, Sweden) PD-10 desalting columns are prepacked, disposable columns containing Sephadex™ G-25 medium for group separation of high-molecular-weight (Mr > 5,000) from low-molecular-weight (Mr < 1,000) substances by desalting and buffer exchange
Protein profiling by two-dimensional liquid chromatography analysis
The ProteomeLab™ PF 2D system (Beckman Coulter Inc., Fullerton, CA) separates and fractionates components of a protein mixture with two-dimensional liquid chromatography. A 60-μL serum sample equilibrated and processed as above was diluted with chromatofocusing start buffer (25 mM bis-Tris propane, 8 M urea, and 0.2% n-octyl β-glucopyranoside, pH 8.5) to a final volume of 800 μL. This solution was desalted by eluting through a PD-10 column (GE Healthcare, Piscataway, NJ) with chromatofocusing start buffer. Two milliliters containing approximately 5 mg of total proteins thus collected was applied onto the anion exchanger chromatofocusing column (2.1 × 250 mm) of the ProteomeLab PF 2D system, followed by elution with buffer containing Polybuffer 74 (GE Healthcare), 8 M urea, and 0.2% n-octyl β-glucopyranoside (pH 4.0), at a flow rate of 0.2 mL/min. 18 The fractions at 0.3 pH intervals were collected in a 96-well plate. Finally, the most acidic proteins were recovered on washing the column with 1 M NaCl for 45 min. Selected fractions from the chromatofocusing column were analyzed using a column (4.6 × 33 mm) packed with C18 silica beads (Beckman Coulter). Elution was done with a gradient of 0.1% trifluoroacetic acid in Milli-Q® (Millipore Corp., Billerica, MA) water and 0.08% trifluoroacetic acid in acetonitrile, at a flow rate of 0.75 mL/min. The eluted proteins were monitored by ultraviolet absorbance at 214 nm, and the fractions were collected for further analysis. The data from the two-dimensional liquid separations were analyzed using ProteoVue and DeltaVue software (Beckman Coulter). The ProteoVue software produces pI versus hydrophobicity protein map of the fractions obtained from the reverse-phase high-performance liquid chromatography (HPLC) second-dimension analysis. The DeltaVue software matches the Proteovue maps of any two samples.
Treatment of tryptic peptide digests prior to mass spectrometry analysis
NH4HCO3 (1 M) and dithiothreitol (10 mM) were added to each fraction from the reverse-phase HPLC column to final concentrations of 100 and 1 mM, respectively. The resulting fractions were incubated at 60°C for 10 min, and then 1 mL of trypsin solution (100 ng/mL) in 50 mM CH3COOH was added. Digestion was done by incubation in a shaker at a medium speed at 37°C for 24 h. The tryptic digests were evaporated to dryness using an Eppendorf concentrator (Eppendorf, Hamburg, Germany), then reconstituted in 3 mL of HPLC-grade water, and purified with a ZipTipC18 (Millipore) using the procedure recommended by the manufacturer. The purified peptides were eluted from the ZipTipC18 directly onto a stainless steel matrix-assisted laser/desorption ionization (MALDI) target plate (Bruker Daltonics, Bremen, Germany) with 1 μL of a saturated solution of α-cyano-hydroxy-cinnaminic acid in a mixture of 0.1% trifluoroacetic acid:acetonitrile (2:1, vol/vol). The peptide mixture after drying at room temperature was analyzed with a Reflex IV MALDI TOF/TOF™ mass spectrometer (Bruker Daltonics), and the protein identity was obtained by the MASCOT program using the Swiss-Prot and NCBInr databases limited to the Homo sapiens species. 19
Statistical analysis and software used
All statistical analyses were done with the SPSS statistical software package version 15.0 (SPSS, Inc., Chicago, IL). Statistical tests were all two-sided (<0.05) using one-way analysis of variance and Kruskal-Wallis tests. The significance of differences between mean and median analytes of the thiamine and placebo treatment groups was determined using Student's t test and the Mann-Whitney U test, respectively. The significance of differences from baseline and the post-therapy and post-washout periods was determined using an independent t test for the samples. Elution profile obtained from the chromatofocusing column was examined by 32 Karat™ software (Beckman Coulter), which generates the first-dimension report that tells information about all the peaks separated in the various fractions at particular pH and time interval. ProteoVue and DeltaVue softwares are used to generate the maps based on the pI and compare the maps of the control with that of each experimental group.
Results
Estimation of biochemical parameters
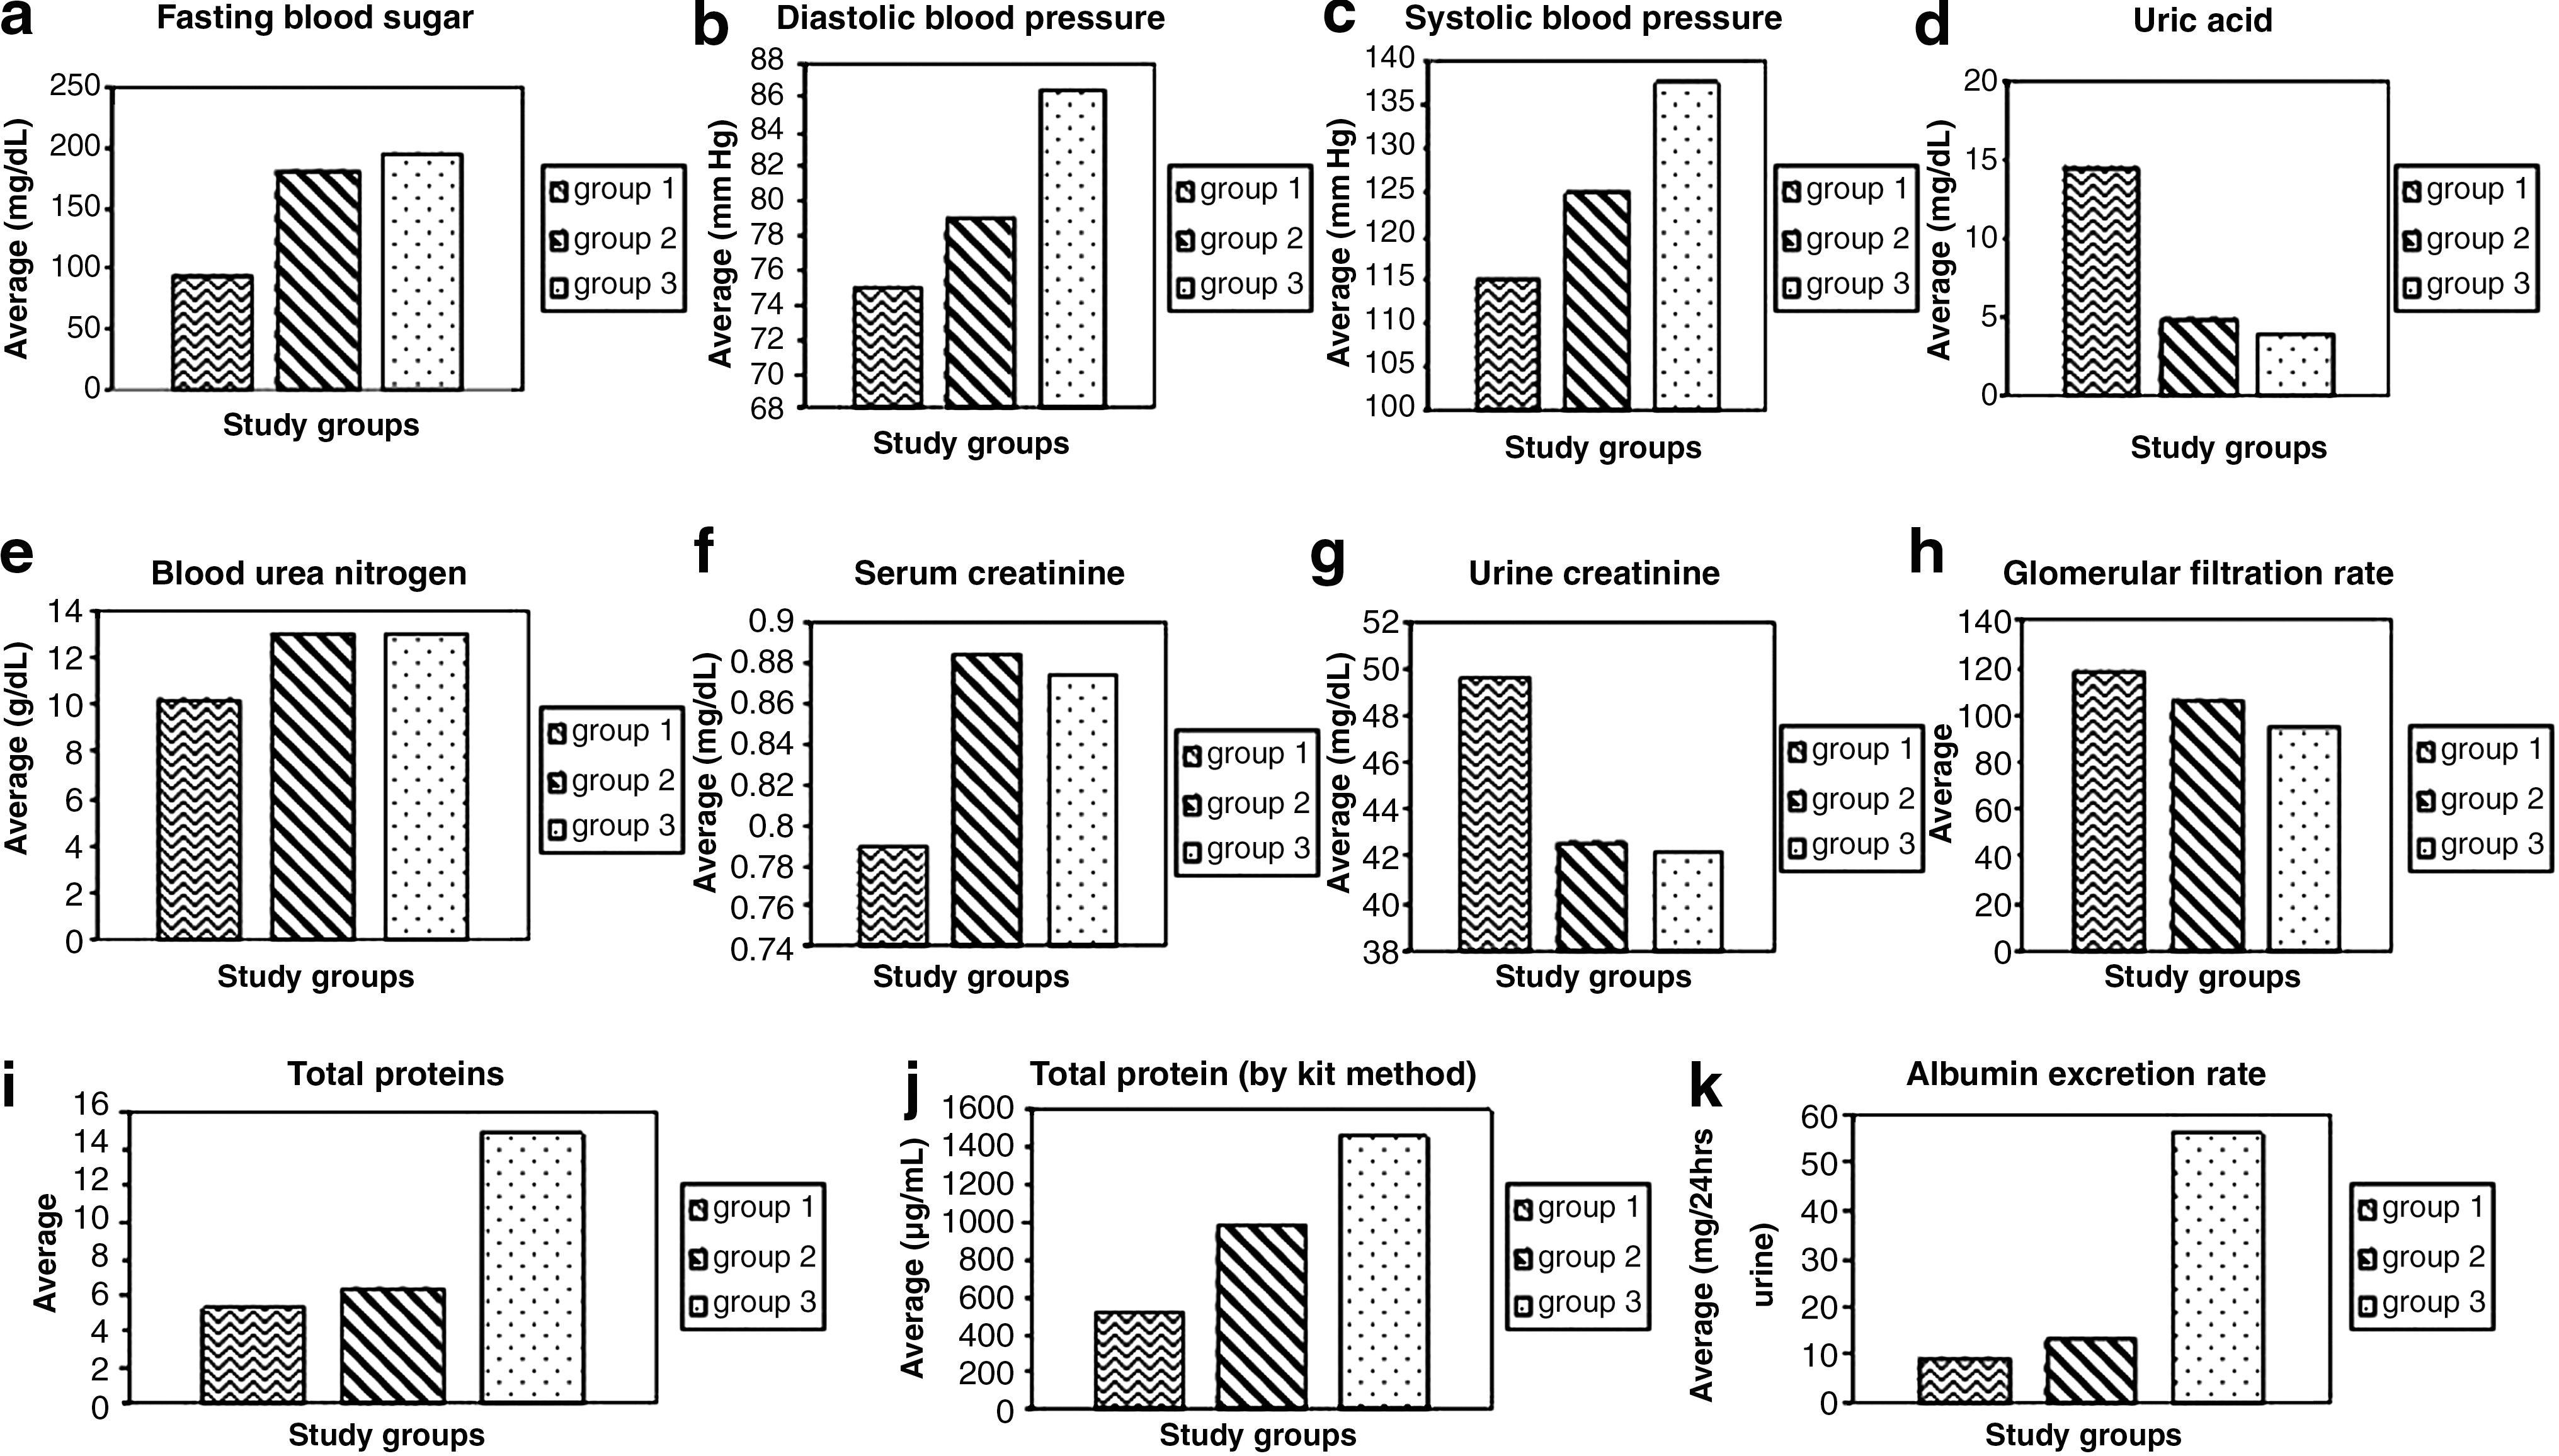
Biochemical parameters related to hypertensive diabetic nephropathy and specific protein markers were analyzed by a two-dimensional liquid chromatographic system followed by mass spectrometric standard reference protocols. Total protein content and AER (mg/24-h urine) was estimated by plotting the standard curve shown in Figure 1. The biochemical data showed significantly elevated levels of fasting blood sugar (FBS), diastolic and systolic blood pressure, total serum proteins, total urinary proteins, and AER in diabetes group C with hypertensive nephropathy as shown in Figure 2a–j and Table 1. The other groups A and B showed nonsignificant differences in AER and blood pressure as shown in Figure 2 and Table 1.

(
(
Data are mean ± SD values. Student's t test and the Mann-Whitney U test were used to calculate statistical significance of differences.
P > 0.05 (statistically nonsignificant), b P < 0.01 (statistically significant), c P < 0.001 (statistically highly significant) comparison of control with diabetes baseline.
Total serum and urinary proteins
The Bradford assay was performed for the quantification of microgram quantities of protein, while optical densities were measured at 595 nm as shown in Figure 1a. The protein concentration of every urine sample was also determined by the kit method by using the pyrogallol red method as shown in Figure 1b. In both groups B and C an increase of serum protein concentration was observed for diabetes patients compared to the normal control group A as shown in Figure 2. The average value of total proteins in urine for hypertensive diabetes patients without nephropathy was 93.4 ± 1.95 μg/10 μL, whereas for hypertensive nephropathy diabetes patients it was 148.45 ± 1.98 μg/10 μL, and for control subjects it was 53.6 ± 1.96 μg/10 μL, as shown in Table 1. The average AER value in the urine for hypertensive diabetes patients without nephropathy was 9.40635 ± 4.96 mg/24 h-urine, and the average of total proteins in the urine for hypertensive nephropathy diabetes patients was 55.8985 ± 21.96 mg/mL, whereas for control subjects it was 9.40635 ± 4.96 mg/mL, as shown in Figure 2 and Table 1.
Identification and molecular characterization
For the identification and molecular characterization, advanced technologies like SDS-PAGE, two-dimensional liquid chromatography (ProteomeLab PF 2D), and mass spectrometry (MALDI TOF/TOF) were used.
SDS-PAGE analysis
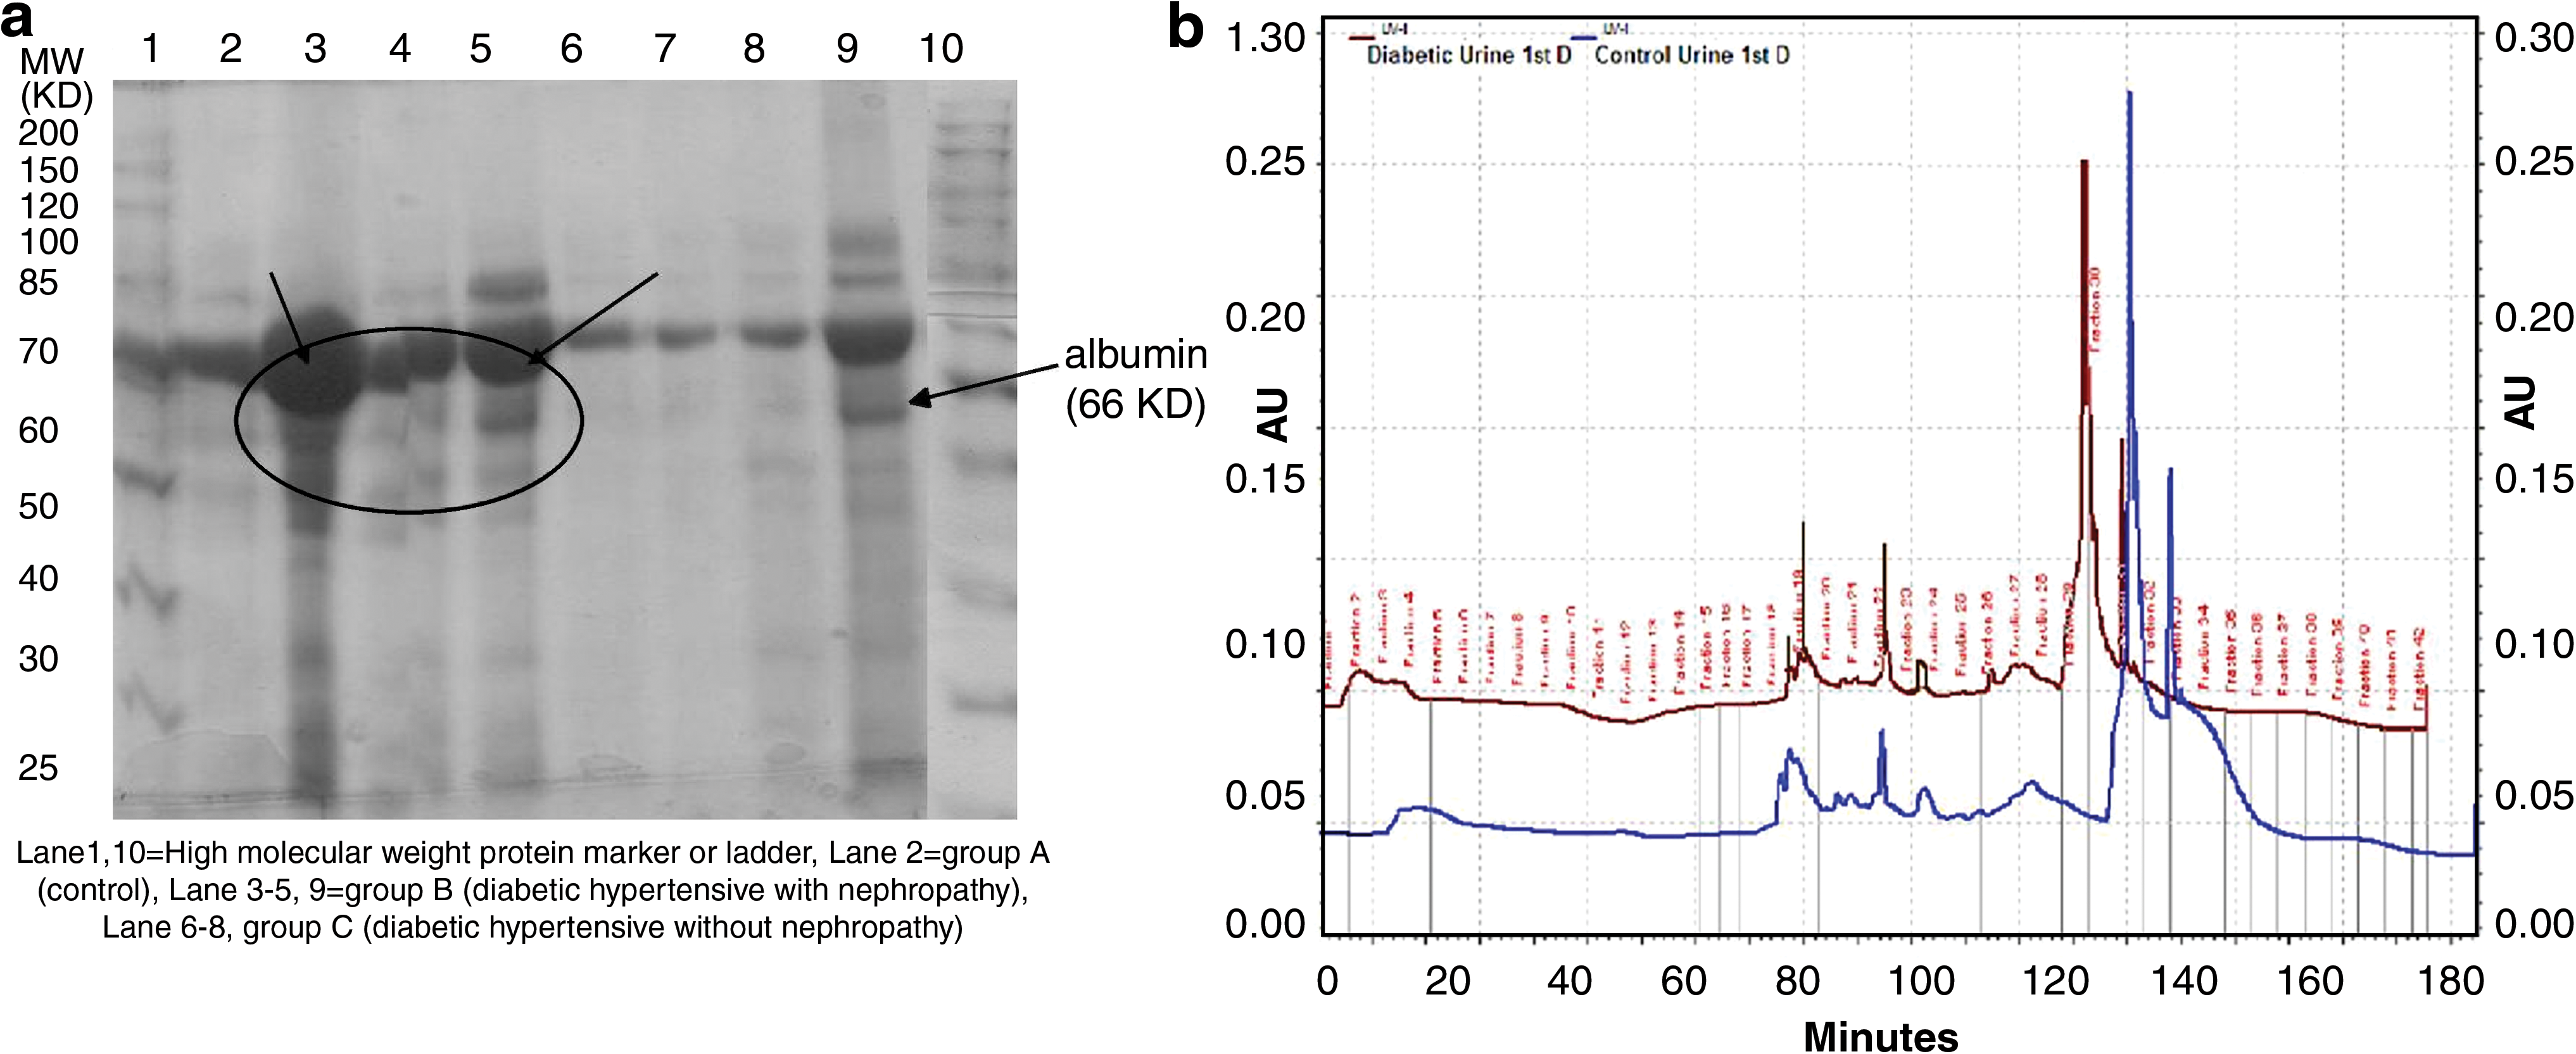
Figure 3a shows the protein profiling of human urine analysis by SDS-PAGE in which albumin was more present in hypertensive diabetes patients compared to normal subjects in the Coomassie Brilliant Blue staining. Albumin is the major abundant protein present or observed in urine samples of diabetes patients with hypertensive nephropathy, and less was observed in urine from the normal control subjects and the hypertensive diabetes patients without nephropathy.
(
Chromatofocusing: first-dimensional analysis
Figure 3b shows the two-dimensional liquid chromatographic analysis and comparison of control urine samples with the diabetes sample. Levels of some proteins were elevated in the diabetes sample but barely expressed in the normal sample. Identification and purification were done by chromatofocusing followed by reverse-phase analysis, and proteins were separated and subjected to further analysis. In the diabetes urine sample shown in Figure 3b, the chromatogram showed a significant difference in some peak areas that represent up-regulated proteins in the diabetes sample and barely expressed in the control sample. For instance, there was variation in the peak area of fraction number 17 in the control sample and fraction number 19 in the diabetes urine sample, and this was analyzed further by two-dimensional reverse-phase HPLC analysis, where these peaks were resolved into further peaks and purified. Human albumin varied in fraction 17 in the control sample compared to fraction 19 in the diabetes sample. This was separated by different retention times in both groups with fractionation into two different fractions, but confirmation of same protein was done by further mass spectrometry analysis.
Reverse-phase chromatography: second-dimension results
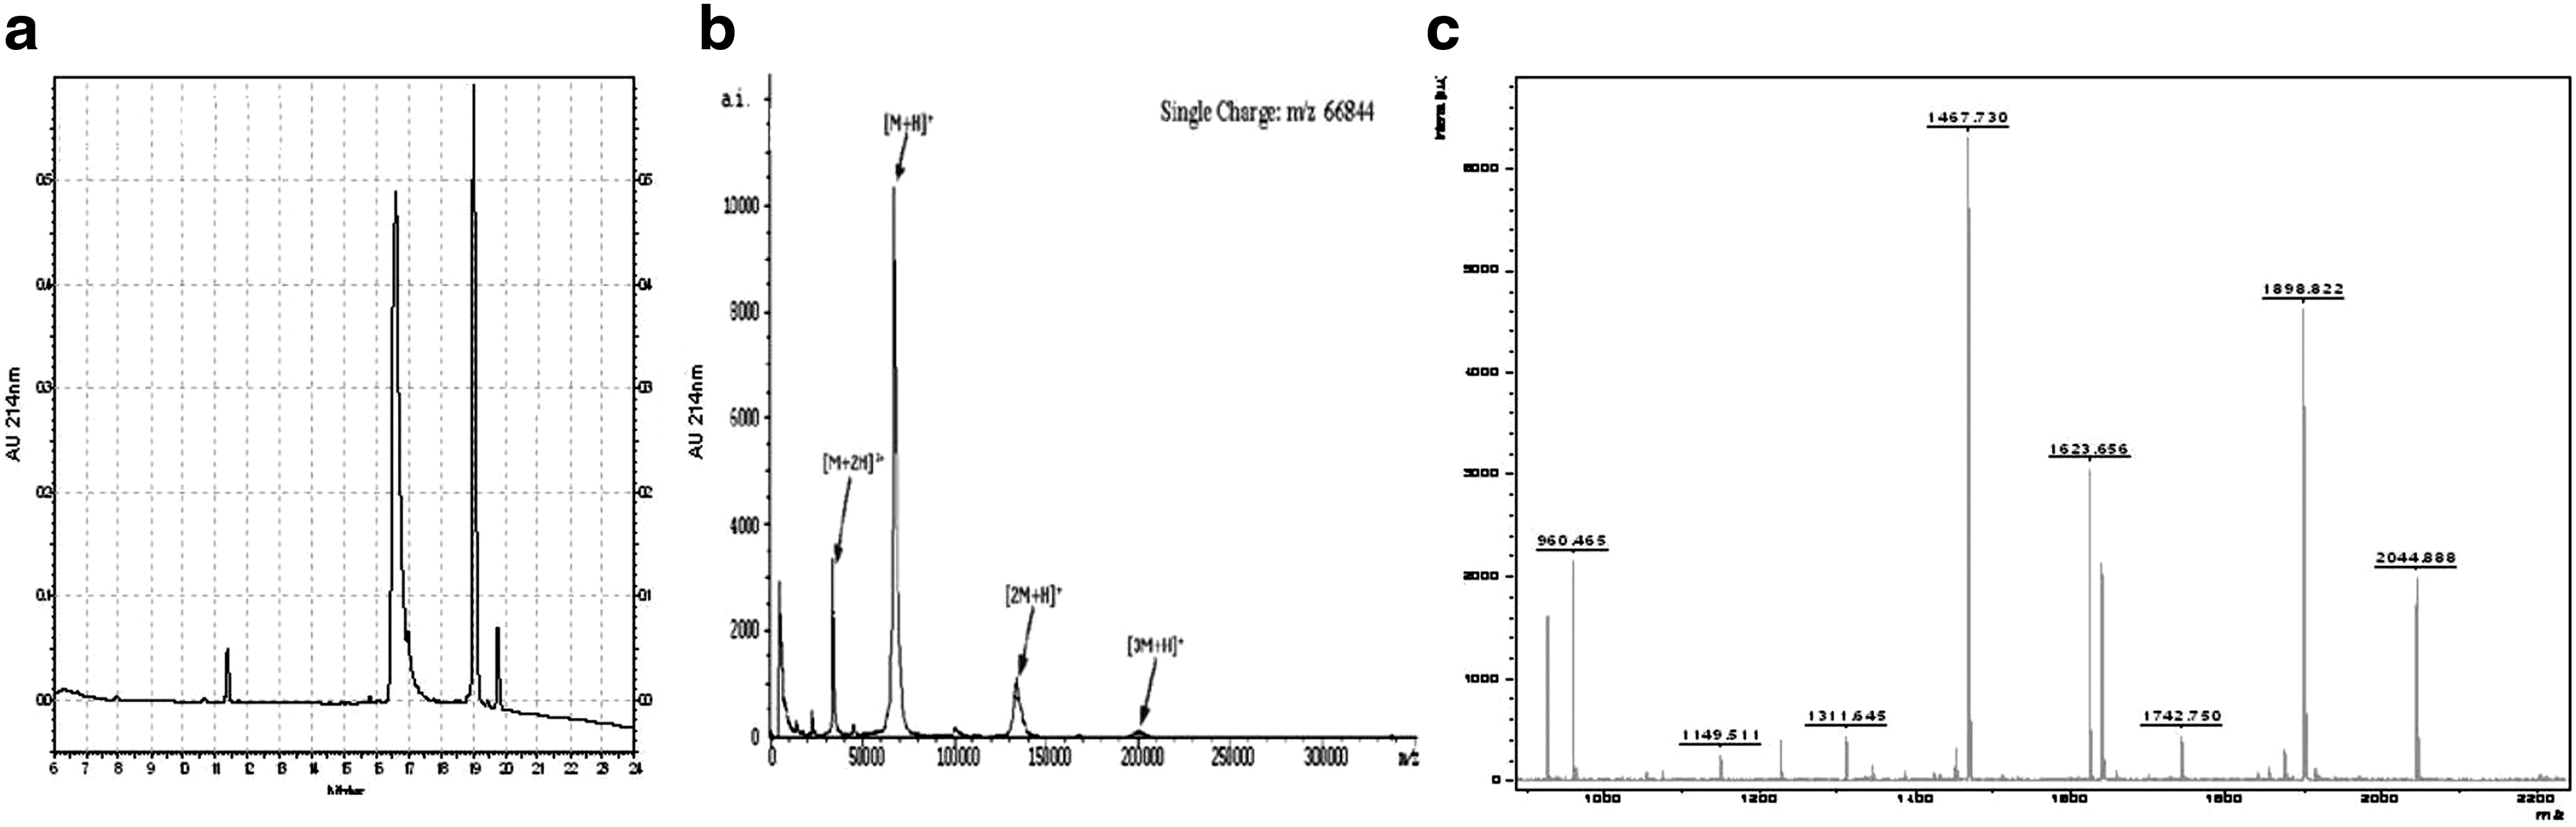
All of the second-dimension absorbance profiles for the control urine sample as well as for the urine sample from a patient with hypertensive diabetic nephropathy have been observed and recorded as shown in Figure 4. In the second-dimension analysis selected fractions showing variation were subjected to further two-dimensional analysis. The peak was resolved into two further peaks: one of them was human albumin, which was confirmed later by mass spectrometric analysis (see Fig. 4a). This fraction peak separated by two-dimensional analysis was analyzed as such without any digestion for mass spectrometric analysis.
(
ProteoVue and DeltaVue analysis
The second-dimension results were converted to ASCII files, which can be imported into ProteoVue. ProteoVue allows comparison of multiple or all second-dimension runs for one sample in a banded map display. DeltaVue allows side-by-side viewing of the second-dimension runs for two samples. DeltaVue also shows the difference map between corresponding pI lanes. Both ProteoVue and DeltaVue analyses are shown in Figure 5. The data were displayed as an ultraviolet/pI map using the ProteoVue feature of the software, which displays the pI fractions as lanes with the color intensity corresponding to 214 nm absorbance. Lane 17 corresponds to the fraction of material with pI >8.5, and Lane 1 was the fraction collected from the high-ionic-strength wash; Lanes 2–16 correspond to the fractions from the pH gradient of the chromatofocusing separation, where Lane 2 was the most acidic and Lane 16 was the most basic. This fraction contains human albumin as shown in Lane 6, which corresponds to the fraction with a pH of 6.38 and 6.68 in Figure 5a. The retention time was between 16.6 to 17.0 min. In the DeltaVue analysis, there was a smaller amount of albumin in lane 6, which has pH limits of 6.38–6.68 in Figure 5b. DeltaVue was zoomed in to show only the region where differences in the proteome maps were displayed. In Figure 5b, the right side showed the urine sample of a patient of hypertensive diabetic nephropathy, and the left side showed the control sample, whereas the central lane showed the difference between these two samples.

(
Mass spectrometric analysis
The protein fractions obtained from the reverse-phase chromatography of representative samples of the various groups were analyzed by mass spectrometric analysis in order to confirm their identity as shown in Figure 4. The intact molecular mass of each of these proteins and the mass profile of the tryptic digest of this protein were also determined. Figure 4b shows the analysis of the protein in the same sample that showed the intact protein mass at 66 kDa, which corresponds to human urine albumin. The tryptic digest of human albumin was done separately and analyzed by mass spectrometry as shown in Figure 4c. The analysis of the peptide profile of the protein, as done by MASCOT software, confirmed that this protein was human albumin in the samples.
Discussion
Diabetes that leads to end-stage renal disease is one of the major causes of mortality in diabetes patients. According to the World Health Organization, by 2025 there will be 300 million people with diabetes, of which 75% will be in developing countries. Pakistan will be the fourth country in the list after India, China, and the United States, in terms of number of people with diabetes by the year 2025. Type 2 diabetes, along with its chronic complications, is a common problem in our country. Most diabetes patients suffer from type 2 diabetes, which accounts for about 85% of all diabetes in developing countries and more than 90% in the Pakistani population. Type 2 diabetes is a public health concern in both developed and developing countries as it is becoming a global epidemic. 2 The presence of albumin in urine is considered predictive of the subsequent development and clinical progression of diabetic nephropathy. So, early detection by this protein biomarker is an effective prevention tool. 19 Different protein biomarkers that are either up-regulated or down-regulated play important roles in prediction of diabetes as obesity-related as observed by Riaz et al. 21 and others on diabetic nephropathy. 22
The hypertensive diabetes patients who did not have nephropathy had an increase in blood pressure of 5.3% compared with the control group, whereas diabetes patients with hypertension and nephropathy had a 28.7% increase compared with the control group. The increasing trend of blood pressure in diabetes patients showed central adiposity and insulin resistance. FBS of all subjects was determined by the dichromatic end-point technique: the absorbance due to NADPH is used to determine the glucose level. In our study FBS was much higher in diabetes patients, especially those with hypertension. The hypertensive diabetes patients without nephropathy had a 78% FBS increase compared with the control group, whereas diabetes patients with hypertension and nephropathy had a 91.1% increase of FBS. This showed insulin resistance in hypertensive diabetes patients, and the results obtained are statistically significant with P < 0.01. Uric acid of all the subjects was determined by the bichromatic end-point technique in which change in absorbance is used to calculate the concentration of uric acid. A much higher level was observed in the case of controls compared to diabetes patients. The control patients had a 129.1% increase in uric acid values compared with hypertensive diabetes patients without nephropathy versus a 141% increase compared with diabetes patients with hypertension and nephropathy. Although low values can be associated with some kinds of kidney disease, in our study diabetes patients had normal values, whereas control patients had high levels of uric acid, which means that the body is not handling the breakdown of cells to get rid of uric acid. BUN of all the subjects was determined by the urease/glutamate dehydrogenase-coupled enzymatic technique in which BUN was calculated by a bichromatic rate technique. A high level of BUN was observed in diabetes patients compared to control subjects. The hypertensive diabetes patients without and with nephropathy both had a 17.5% increase compared with control subjects. A high value of BUN indicates a moderate to severe degree of renal failure.
Serum and urine creatinine levels were measured, and a high level was observed in the case of diabetes patients compared to control subjects. The hypertensive diabetes patients without nephropathy and those with nephropathy both showed a 6.43% increase compared with control subjects in the case of serum creatinine. A rise in blood creatinine levels was observed only with marked damage to functioning nephrona. The GFR describes the flow rate of filtered fluid through the kidney, and a low GFR indicates kidney damage. In our case the hypertensive diabetes patients without nephropathy showed a 18% decrease compared with control subjects, whereas diabetes patients with hypertension and nephropathy showed a 33.2% decrease. For the estimation of urinary proteins the Bradford method in a kit was used. In both cases a significant difference was observed in normal and diabetes patients. The AER was determined by measuring the absorbance of buffer containing antibody specific for human serum albumin at 340 nm. A highly significant difference was observed for hypertensive diabetes patients with nephropathy compared to control and hypertensive diabetes patients with nephropathy. The results of group C as hypertensive with diabetic nephropathy were statistically highly significant with P < 0.001. 22
A high value of albumin was observed in the hypertensive diabetes patients with nephropathy, and the presence of microalbuminuria is often a better predictor of cardiovascular disease than of diabetic nephropathy. 23 From the literature it was found that angiotensin converting enzyme inhibitor and thiamine prevent the development of microalbuminuria. Using renin–angiotensin system blockers, regression of microalbuminuria that is associated with protection from the development of diabetic nephropathy is obtained, whereas thiamine could prevent early-stage nephropathy. 8
A two-dimensional liquid separation mass mapping has been developed in the laboratory for the analytical profiling of proteins in the serum of control and diabetes patients. The ProteomeLab PF 2D fractionated the proteins on the basis of pI in the first chromatofocusing phase, and each fraction was subsequently separated based on the polarity of the protein in the second dimension by nonporous silica bead reverse-phase HPLC. Purified proteins were collected and stored for further analysis by peptide mapping using MALDI TOF/TOF mass spectrometry. For the identification and molecular characterization, advanced technologies like SDS-PAGE, two-dimensional liquid chromatography (ProteomeLab PF 2D), and mass spectrometry (MALDI TOF/TOF) were used. For the protein profiling, SDS-PAGE was done that was stained with Coommassie Brilliant Blue and silver, and these proteins were purified further by a PD-10 desalting column as shown in Figure 3. Then, for further protein profiling, two-dimensional liquid chromatography analysis was done as shown in Figure 3b. After that, proteins were digested with trypsin and analyzed by MALDI TOF/TOF. To determine the relative abundance of major proteins in the sample and to determine the distribution of proteins among fractions, SDS-PAGE, which separates the proteins according to molecular mass, was done. A significant difference was found in the protein expression level in control and diabetes patients. In diabetes patients the 66-kDa band of albumin was most prominent (Fig. 3), and it was further purified and characterized. Finally, protein was confirmed by MALDI TOF/TOF and MASCOT software analysis as shown in Figure 4.
Recently, proteomic identification of human serum for a biomarkers study in diabetes mellitus type 2 was done by Riaz et al. 24 They found potential protein biomarkers in diabetes type 2 of human serum.
It may be concluded from the above studies that the prevalence of hypertensive diabetic nephropathy is much more common than diabetes without nephropathy in the local population of Pakistan. Albumin acts as a protein biomarker for this disease, and the AER and level of albumin are significantly higher in these patients compared to normal subjects and diabetes patients without nephropathy. So more research work is needed in this field, and to control hypertensive nephropathy in diabetes and prevent kidney failure.
Footnotes
Acknowledgments
This research work is funded by the University of the Punjab, Lahore. We thank Ms. Aasma Riaz (Lecturer in Statistics Department, University of the Punjab, Lahore) for statistical analysis and Dr. Saadia Shahzad Alam, F.P.G.M.I., Department of Medicine, Sheikh Zayed Hospital, Lahore, for assistance in patient recruitment and sample collection.
Author Disclosure Statement
There is no conflict of interest associated with this research work and project.