
Abstract
Aim:
This study was designed to determine the effect of exenatide on inflammatory and oxidative stress markers in type 2 diabetes mellitus (T2DM) patients who were suboptimally controlled with metformin and/or sulfonylurea.
Subjects and Methods:
Twenty-three patients with T2DM with inadequate glucose control were randomly divided into two groups: exenatide group (E group) (12 patients, 5 μg b.d. × 4 weeks followed by 10 μg b.d. × 12 weeks) and placebo group (P group) (11 patients). Glycosylated hemoglobin (HbA1c), the seven-point glucose profile, daily mean glucose, and glycemic excursion were determined. The effects of exenatide on 8-iso-prostaglandin F2α (PGF2α), monocyte chemoattractant protein-1 (MCP-1), and high-sensitivity C-reactive protein (hs-CRP) were investigated.
Results:
Exenatide treatment reduced body weight and body mass index (BMI) and improved HbA1c, the seven-point glucose profile, and daily mean glucose compared with placebo (P < 0.05). Limited glycemic excursion was found in the E group compared with the P group (P < 0.05), including a smaller SD and postprandial glucose excursion. In addition, the oxidative stress maker PGF2α was significantly reduced by exenatide treatment (P < 0.05). The inflammatory markers hs-CRP and MCP-1 were also significantly reduced in the E group compared with the P group (P < 0.05). PGF2α was significantly correlated with glycemic excursion (P < 0.05), whereas MCP-1 was significantly correlated with body weight, BMI, glycemic excursion, and HbA1c (P < 0.05 for all).
Conclusions:
Exenatide treatment reduced patient body weight and BMI, improved HbA1c and the seven-point glucose profile, reduced daily mean glucose, limited glycemic excursion, and reduced oxidative stress and inflammatory markers in patients of T2DM having inadequate glucose control.
Introduction
Clinical studies showed that exenatide improves glycemic control, reduces body weight in patients, and even improves beta-cell function. 2 –8 Exenatide controls glucose homeostasis in the following ways: (1) to increase insulin secretion in response to food intake; (2) to suppress release of glucagon in response to eating; (3) to slow down gastric emptying to delay meal-derived glucose appearing in the blood; and (4) to reduce liver fat content. 1
Elevated inflammation and oxidative stress have been reported in patients of T2DM. 9,10 They are thought to play a role in the development of insulin resistance. 9,10 Glycemic excursion will exacerbate inflammation and oxidative stress, which increase the risk for diabetes complications. 11 However, no study has investigated the effect of exenatide on inflammatory and oxidative stress markers in T2DM. Here we report the effect of exenatide on inflammatory and oxidative stress markers in T2DM patients receiving metformin and/or sulfonylurea treatment in a pilot study.
Subjects and Methods
Patients
In this pilot study, 51 patients with T2DM attending the Nanjing First Hospital, Nanjing, China, were screened. All patients were receiving metformin (>1 g/day) and/or a sulfonylurea (1 g/day) for at least 3 months with a glycosylated hemoglobin (HbA1c) level of 7.0–10.0% before inclusion. The patients were not receiving nonsteroidal anti-inflammatory drugs, β-blockers, or antioxidative drugs. The exclusion criteria were as follows: (1) insulin injection for more than 1 week in the previous 3 months; (2) severe coronary disease history in the previous 1 year; (3) blood creatine ≥133 μmol/L for men and ≥106 μmol/L for women; and (4) glutamate-pyruvate transaminase ≥2.5 times greater than the normal value. Main clinical and laboratory characteristics of the patients are given in Table 1. Patients' body weight and height were measured at week 0 (as baseline) and week 16 after treatment to calculate body mass index (BMI). Each patient's body weight was measured twice at week 0 and 16, respectively. The same body weight meter (XiHeng-RGZ-120-RT, WuXi Weigher Factory, JiangSu, China) was used throughout the whole study.
Data are mean ± SD values.
HbA1c, glycosylated hemoglobin; NS, not significant.
Twenty-three patients who met the criteria were included into this 16-week, double-blinded, randomized, placebo-controlled trial. Exenatide and matching placebo were provided by Eli Lilly and Co. (Indianapolis, IN). Twelve patients (exenatide group [E group]) received two subcutaneous injections of exenatide (5 μg b.d.; before breakfast and dinner) in the first 4 weeks. The dose was increased to 10 μg b.d. from week 5 until the end of the study (week 16). The other 11 patients (placebo group [P group]) received placebo injections (5 μg b.d. for the first 4 weeks and 10 μg b.d. for week 5 to week 16) twice daily. The study was approved by the ethics committee of NanJing First Hospital. Written informed consent was obtained from the patients prior to the study.
Determination of HbA1c and homeostasis model of insulin resistance assessment
HbA1c was measured with a DiaSTAT HbA1c analyzer (Bio-Rad, Hercules, CA) at week 0 (as baseline) and week 16.
The homeostasis model of insulin resistance assessment (HOMA-IR) was computed with the following formula: fasting plasma glucose (in mmol/L) × fasting serum insulin (in mU/L) divided by 22.5.
Assessment of glycemic excursion
To assess the glycemic excursion, two sets of blood glucose data were collected from each patient at week 0 (as baseline), week 4, 8, 12, and 16 after treatment. The data were collected on two nonconsecutive days in the same week. Each data set included seven blood glucose measurements: pre- and post-breakfast, lunch, and dinner and before bedtime. 12 To facilitate self-monitoring of blood glucose, each patient was equipped with an Accu-Chek® Active glucometer (Roche, Mannheim, Germany). Patients reported the glucose values every 4 weeks.
The daily mean blood glucose was calculated as the mean of all blood glucose measurements in each week. The mean postprandial glucose excursion was calculated as the mean of the measurement at 2 h after the meal minus the measurement before the meal. The mean SD was calculated as follows: we calculated daily mean and SD based on each patient in each week (each patient had 14 data points in each respective week). Then, the 12 (E group) and 11 (P group) SD data were used to calculate mean SD of each respective week.
Laboratory measurements
Venous blood samples after overnight fasting were collected at week 0 and 16. The isolated plasma was stored at −80°C for future analysis. Monocyte chemoattractant protein-1 (MCP-1) and prostaglandin F2α (PGF2α) were determined with enzyme-linked immunosorbent assay kits purchased from Bender, Ltd. (Vienna, Austria) and Cayman Chemical Co. (Ann Arbor, MI), respectively. High-sensitivity C-reactive peptide (hs-CRP) was determined by radioimmunoassay kits provided by Beijing Molecular High-Tech Pte Ltd. (Beijing, China). Insulin was determined by an enzyme-linked immunosorbent assay kit purchased from Beijing North Institute of Biological Technology.
Statistical analysis
All data are expressed as mean ± SD values. All statistical analyses were performed using SPSS software (version 11.5; SPSS, Inc., Chicago, IL). The area under the curve of the seven-point glucose measurements was used to compare the difference between two groups. The paired t test was used to determine intra-group difference at various time points, whereas the independent t test was used to determine the difference between the groups. The correlation coefficient was calculated to explore the influence of different variables on inflammation or oxidative stress. Analysis of covariance using the general linear model was used to determine if exenatide exerts direct effects on attenuation of inflammation and oxidative stress. P < 0.05 was considered statistically significant.
Results
Body weight, BMI, and fast glucose and insulin change
Body weight and BMI of the E group both decreased by 1% at week 16 (from 72.2 ± 8.7 kg and 26.3 ± 1.9 kg/m2, respectively, at week 0 to 71.5 ± 8.9 kg and 26.1 ± 1.6 kg/m2, respectively, at week 16). However, they both increased by 2.3% (from 69.3 ± 12.4 kg and 26.3 ± 3.0 kg/m2, respectively, at week 0 to 71.0 ± 13.6 kg and 26.9 ± 3.5 kg/m2, respectively, at week 16) in the P group. These changes were statistically significant between the two groups (P < 0.05 for both).
Fasting blood glucose did not differ significantly between the two groups. In the E group it decreased from 8.1 ± 1.9 mmol/L at week 0 to 7.5 ± 0.9 mmol/L at week 16 (P > 0.05), whereas it remained unchanged (from 7.9 ±1.5 mmol/L at week 0 to 7.9 ± 1.8 mmol/L at week 16) in the P group.
Similarly, fasting insulin also did not differ significantly between the two groups. In the E group, it increased from 8.1 ± 4.0 μU/mL at week 0 to 8.9 ± 5.5 μU/mL at week 16 (P > 0.05), whereas it dropped from 7.5 ± 2.8 μU/mL to 6.6 ± 2.3 μU/mL (P > 0.05) in the P group.
Calculated HOMA-IR did not differ significantly between the two groups. In the E group it increased from 2.9 ± 1.3 at week 0 to 3.1 ± 2.1 at week 16, whereas it decreased from 2.6 ± 0.9 to 2.4 ± 1.1 in the P group.
Improved seven-point glucose profile, daily mean glucose, and HbA1c
Data obtained by self-monitoring of blood glucose showed that the daily seven-point glucose profile decreased in the E group after treatment (Fig. 1). It was significantly lower in the E group than in the P group from week 4 until week 16 after treatment (P < 0.05).
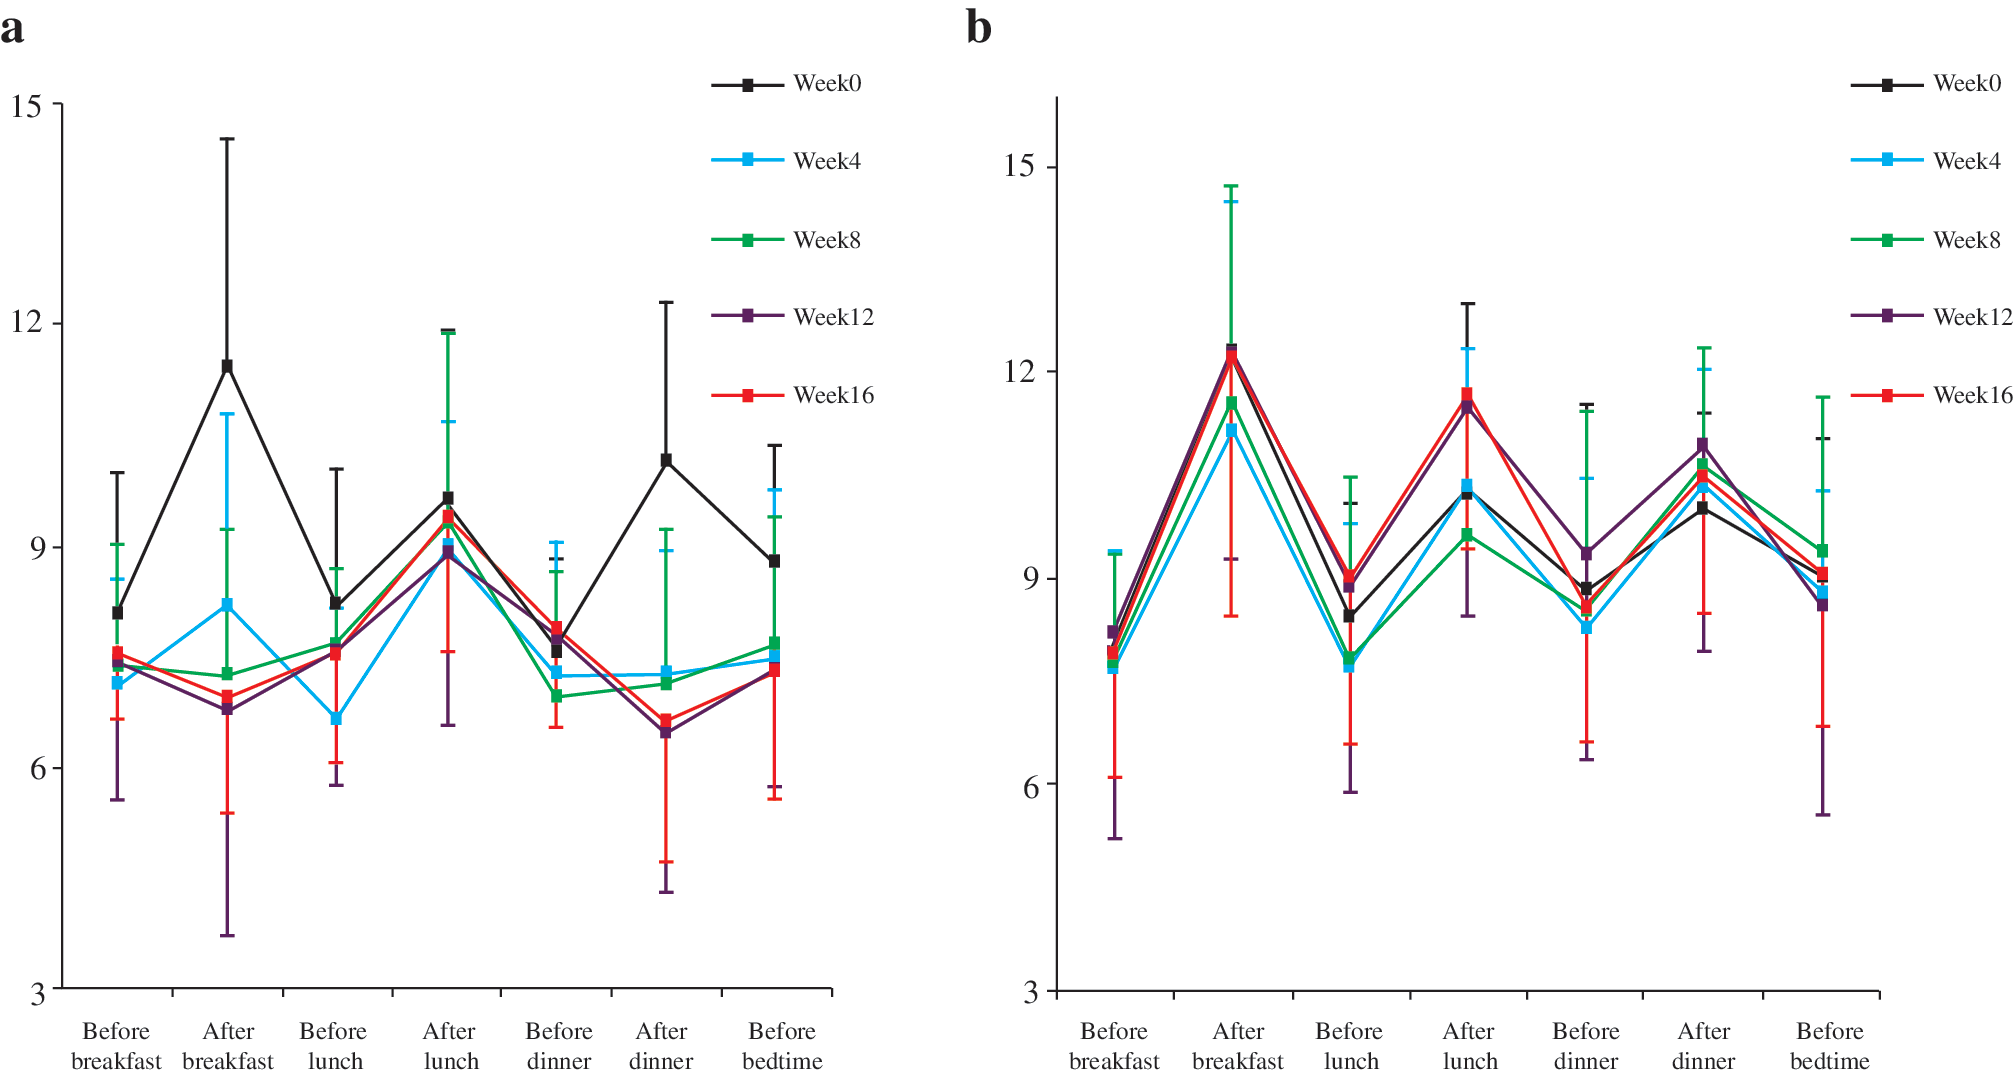
Seven-point glucose profile of (
Daily mean blood glucose in the E group also significantly decreased (week 0, 9.1 ± 1.4 mmol/L; week 4, 7.5 ± 1.3 mmol/L; week 8, 7.6 ± 1.2 mmol/L; week 12, 7.5 ± 0.9 mmol/L; week 16, 7.6 ± 0.9 mmol/L) compared with the P group (9.6 ± 1.3, 9.2 ± 1.4, 9.3 ± 1.8, 10.0 ± 2.0, and 9.9 ± 1.8 mmol/L, respectively) from week 4 until week 16 after treatment (P < 0.05).
The HbA1c of the E group was significantly reduced by 10.5% at week 16 (6.8 ± 0.7%) compared with the pretreatment value at week 0 (7.7 ± 0.6%, P < 0.05). The HbA1c of the P group at week 16 (7.8 ± 0.8%) was unchanged compared with week 0 (7.8 ± 0.8%). The change between the two groups is significantly different (P < 0.05).
Reduced glycemic excursion
The mean SD of the E group also progressively decreased from week 0 to week 16, whereas it remained unchanged in the P group over the study (Fig. 2). The mean SD of the E group was significantly smaller than that of the P group at weeks 12 and 16 after treatment (P < 0.05).

Mean glycemic excursion SD over the study. The mean SD of the exenatide-treated group (E group) also progressively decreased compared with the placebo-treated group (P group) over the study interval. *P < 0.05 versus the P group.
Postprandial (especially breakfast and dinner) glucose excursion progressively decreased in the E group from week 4 until week 16 of treatment (Table 2). Beginning from week 4 the glucose excursion post-breakfast and post-dinner was significantly less than those of the P group (P < 0.05). These data demonstrated that exenatide treatment reduced postprandial glycemic excursion.
Data are mean ± SD values. Breakfast fluctuation = glucose measurement at 2 h after breakfast—measurement before breakfast; Lunch fluctuation = glucose measurement at 2 h after lunch—measurement before lunch; Dinner fluctuation = glucose measurement at 2 h after dinner—measurement before dinner.
P < 0.05 versus exenatide-treated group (E group).
P group, placebo-treated group.
Exenatide attenuated oxidative stress
The level of PGF2α, a well-recognized marker of oxidative stress, 13 was significantly decreased from 8.47 ± 3.2 pg/mL at week 0 to 5.16 ± 2.25 pg/mL at week 16 (P < 0.05) in the E group after treatment (Table 3), whereas the PGF2α level of the P group was slightly increased from 8.0 ± 3.15 to 9.3 ± 3.34 pg/mL. The PGF2α level of the E group was significantly smaller than that of the P group at week 16 after treatment (P < 0.05). Analysis of covariance (general linear model) of the two groups indicated that exenatide had a direct effect on attenuation of PGF2α (F = 2.752, P = 0.014) that was independent of HbA1c, mean SD, body weight, and BMI.
Data are mean ± SD values.
P < 0.05 versus the exenatide-treated group (E group) at week 0; *P < 0.05 versus the placebo-treated group (P group) at week 16.
hs-CRP, high-sensitivity C-reactive peptide; MCP-1, monocyte chemoattractant protein-1; PGF2α, prostaglandin F2α.
Exenatide attenuated inflammation
The hs-CRP level of the E group decreased from 0.4 ± 0.5 to 0.2 ± 0.3 mg/L after 16 weeks, but it increased in the P group from 0.6 ± 0.4 to 1.4 ± 1.6 mg/L (Table 3). The hs-CRP level of the E group was significantly lower than that of the P group at week 16 after treatment (P < 0.05).
The MCP-1 level was significantly reduced from 158.7 ±99.2 pg/mL at 0 week to 94.1 ± 70.4 pg/mL (P < 0.05) at 16 weeks after treatment (Table 3) in the E group. It was almost unchanged in the P group at week 0 (143.7 ± 77.0 pg/mL) compared with week 16 (140.5 ± 70.5 pg/mL). However, the difference between the E and P groups at 16 weeks was not statistically significant.
Analysis of covariance (general linear model) of the two groups indicated that exenatide had direct effects on attenuation of hs-CRP (F = 5.443, P = 0.032) and MCP-1 (F = 7.004, P = 0.019), which was independent of HbA1c, mean SD, body weight, and BMI.
Correlation analysis
A statistically significant positive correlation was found between PGF2α and glucose SD (r = 0.413, P = 0.05) and postprandial glucose excursion (breakfast, r = 0.559, P = 0.006; dinner, r = 0.556, P = 0.006), whereas PGF2α was not significantly correlated with age, body weight, BMI, fasting blood glucose, MCP-1, and hs-CRP.
Statistically significant positive correlations were found between MCP-1 and HbA1c (r = 0.474, P = 0.022), glucose SD (r = 0.534, P = 0.009), body weight (r = 0.638, P = 0.001), and BMI (r = 0.631, P = 0.001), whereas MCP-1 did not show significant correlation with age, fasting blood glucose, or postprandial glucose excursion. hs-CRP did not statistically correlate any other variables.
Discussion
This pilot study demonstrated that exenatide treatment reduced body weight and BMI, improved the seven-point glucose profile and HbA1c, reduced daily mean glucose, limited glycemic excursion, and attenuated oxidative stress and inflammatory markers in patients of T2DM with inadequate glucose control.
Exenatide, a 39-amino acid peptide, was originally derived from the saliva of the Gila monster. 1 It mimics human GLP-1, a physiological incretin hormone that is produced by the endocrine cells of the intestine. 14 GLP-1 exerts insulinotropic properties via the G-protein–coupled GLP-1 receptor. 15 GLP-1 also lowers glucagon concentrations, slows gastric emptying, stimulates pro-insulin biosynthesis and secretion, reduces food intake, and may enhance insulin sensitivity. 15 However, the half-life of GLP-1 (<2 min) is too short to maintain a therapeutic level for treatment of diabetes as circulating GLP-1 undergoes rapid proteolytic cleavage by dipeptidyl peptidase-IV. 16
Exenatide is structurally analogous to GLP-1 and binds directly to GLP-1 receptor. It has a much longer half-life than GLP-1 after injection. 1 Clinical studies have demonstrated that exenatide improves glycemic control, reduces body weight, and improves beta-cell function in patients with T2DM. 2 –8 Our current study in Chinese diabetes patients is consistent with these previous reports. Reduced body weight and BMI, improved HbA1c and seven-point glucose profile, and reduced glycemic excursion were found in our T2DM patients receiving exenatide treatment at week 16.
Chronic hyperglycemia and glucose excursion are major factors that cause tissue injury and lead to diabetes complications. 17 It is known that acute glucose excursion and postprandial glucose excursion increase oxidative stress and levels of inflammatory markers more than chronic hyperglycemia. 17 Increased inflammation and oxidative stress are two of the main mechanisms that lead to diabetes complications. 18 Ingestion of glucose (75 g) increasing monocyte nuclear factor κB is a main cellular signal of inflammation and induces transcription of pro-inflammatory cytokines and enzymes that generate reactive oxygen species. 19 The glucose excursion following an oral glucose tolerance test increased plasma hs-CRP and MCP-1 concentrations in patients with T2DM. 20 hs-CRP is produced by hepatocytes, and its expression is regulated by tumor necrosis factor-α and interleukin-6 by adipocytes. 21 It has been shown that there is a highly significant association between elevated hs-CRP and glucose control in T2DM. hs-CRP independently predicted the risk of progressing to diabetes in Chinese subjects with impaired glucose tolerance. 22 MCP-1 is a specific chemokine to recruit and activate monocytes from the circulation to inflammatory sites. An increased level of MCP-1 is associated with the development of diabetes complications. Inflammation might not only play a role in diabetogenesis but may also be involved in hyperglycemia after diabetes. 23
In the current study, it was found that oxidative stress and inflammation were reduced in exenatide-treated patients. The may be the result of reduced body weight and limited glycemic excursion. Besides, exenatide might have direct effects on inflammation and oxidative stress. MCP-1 significantly correlated with HbA1c, glycemic excursion (indexed by SD), body weight, and BMI. Except for hs-CRP, these results were consistent with those of the study of Mine et al. 24 The unexpected hs-CRP correlation results could be due to the small patient population in the study. The reduced inflammation may not only contribute to reduce hyperglycemia and also to reduce the risk for development of diabetes complications, including nephropathy and atherosclerosis.
Oxidative stress is associated with macrovascular and microvascular diabetes complications and is another possible pathogenetic link between atherosclerosis and diabetes. 18,20 Acute glycemic excursion and postprandial glucose excursion contribute to the activation of oxidative stress observed in diabetes patients. 17,25 PGF2α, a marker of oxidative stress, 12 is formed during free radical–catalyzed, nonenzymatic peroxidation of arachidonic acid. In the current study, PGF2α was found to be significantly reduced after exenatide treatment compared with the placebo group. Our study suggested that PGF2α was correlated with glycemic excursion as indexed by SD and postprandial glucose excursion. This is consistent with the study of Monnier et al. 17 showing that glycemic excursion is a more specific triggering effect on oxidative stress than chronic sustained hyperglycemia. The reduction of oxidative stress may reduce risk of vascular diabetes complications, including atherosclerosis.
The present study has supplied new information about the effect of exenatide on inflammation and oxidative stress markers, but it has several limitations that must be acknowledged. First, the study is limited with small population size. Second, although exenatide has direct effects on attenuation of inflammation and oxidative stress, studies with large populations are still needed. However, our pilot study is consistent with the report on another GLP-1 mimetics, liraglutide, 26 and suggests that this may be an important additional GLP-1 effect. Further studies on these GLP-1 effects may be helpful in furthering an understanding of diabetes complications.
In conclusion, our current study showed that addition of exenatide to therapy in T2DM patients with inadequate glycemic reduced patient body weight and BMI. Exenatide treatment achieved better overall glucose control and limited glycemic excursion. It also reduced inflammatory and oxidative stress markers. This suggests new and additional beneficial modes of action in diabetes.
Footnotes
Acknowledgments
This clinical trial was supported by Eli Lilly. The authors thank the company for an unrestricted grant support for this trial.
Author Disclosure Statement
No competing financial interests exist.