
Abstract
Background:
This study looked at the association of cystatin-C (cys-C) with severity of metabolic syndrome in Asian Indians.
Methods:
Five sets of normal glucose tolerance subjects were recruited from the Chennai Urban Rural Epidemiology Study (CURES), a population-based study in southern India: 43 subjects with no metabolic risk factors, 44 subjects with one metabolic risk factor, 37 subjects with two risk factors, 40 subjects with three risk factors, and 40 subjects with four or five metabolic risk factors. Metabolic syndrome was defined using National Cholesterol Education Program criteria for adults modified for waist measured using the World Health Organization Asia Pacific guidelines. Serum cys-C was estimated by a high-sensitivity particle-enhancing nephelometry assay.
Results:
Subjects with four or five metabolic abnormalities had the highest cys-C levels, and with decreasing number of metabolic abnormalities, the cys-C levels decreased linearly (P for trend < 0.001). Regression analysis showed a linear increase in cys-C levels with increasing number of metabolic abnormalities.
Conclusion:
Cys-C levels are highly correlated with the number of metabolic abnormalities in Asian Indians.
Introduction
Cystatin-C (cys-C) is a 13-kDa protein that acts as a negative regulator of pro-atherogenic cysteine proteases. 7 It has recently been shown that cys-C is also a novel, sensitive marker of kidney 8 and cardiovascular 8 function. The fact that it is not affected by extrarenal factors offers a comparative advantage for cys-C over the conventional markers like creatinine and microalbuminuria. 8
In humans, cys-C protein is detected in normal arteries but is present at low levels in atherosclerotic plaque, where cathepsin S, a pro-atherogenic member of the lysosomal cysteine proteinase family cathepsin, is abundant. 9
Earlier studies have reported increased cys-C level in arterial stiffness, 10 subclinical atherosclerosis, 11,12 cardiovascular disease, 13 –17 and stroke. 18 Previously various studies showed the association of cys-C with cardiovascular function in older populations. 12 –14,16 Increased cys-C levels in aboriginal youth have been shown to be associated with high risk of cardiovascular disease even after adjusting for estimated glomerular filtration rate (GFR) by Retnakaran et al. 19 However, the reason for this link between cys-C and cardiovascular risk is yet to be explored. One speculation is that this might be because of endothelial dysfunction. However, whether the resulting endothelial dysfunction is a cause or an effect is not clear. Some studies have reported a positive association of cys-C and MS. 19 –21 However, there is no literature on the association between cys-C and MS in Asian Indians. Asian Indians are known to have very high rates of premature coronary artery disease, diabetes, 22 and MS. 5 The aim of the present study was to assess the association between cys-C with MS in normal glucose-tolerant (NGT) Asian Indians.
Subjects and Methods
Methodology
The study subjects were recruited from the Chennai Urban Rural Epidemiological Study (CURES), an ongoing epidemiological study conducted on a representative population (≥20 years old) of Chennai (formerly Madras), the fourth largest city in India. The methodology of the study has been published elsewhere.
23,24
In brief, 26,001 individuals were recruited for Phase 1 of the urban component of CURES, using a systematic sampling technique; self-reported diabetes subjects taking drug treatment for diabetes were classified as “known diabetes subjects.” Fasting capillary blood glucose was determined using an OneTouch® Basic glucometer (Lifescan, a Johnson & Johnson Company, Milpitas, CA) in all subjects. Details of the sampling are described in our website (
Anthropometric measurements
Anthropometric measurements, including height, weight, and waist, were obtained using standardized techniques as detailed elsewhere. 23 Height was measured with a tape measured to the nearest centimeter. Weight was measured with a traditional spring balance that was kept on a firm horizontal surface. Waist was measured using a nonstretchable fiber measuring tape. The body mass index was calculated as the weight (in kg) divided by the square of height (in m). Blood pressure was recorded in the right arm in the sitting position to the nearest 2 mm Hg with a mercury sphygmomanometer (Diamond Deluxe BP apparatus, Industrial Electronic and Allied Products, Pune, India). Two readings were taken 5 min apart, and the mean of the two was taken as the blood pressure.
Biochemical parameters
Fasting plasma glucose (glucose oxidase-peroxidase method), serum cholesterol (cholesterol oxidase-peroxidase-amidopyrine method), serum triglycerides (glycerol phosphate oxidase-peroxidase-amidopyrine method), high-density lipoprotein cholesterol (direct method-polyethylene glycol-pretreated enzymes), and creatinine (Jaffe's method) were measured using the Hitachi-912 Autoanalyzer (Roche Diagnostics/Hitachi, Mannheim, Germany). The intra- and inter-assay coefficients of variation for the biochemical assays ranged between 3.1% and 7.6%. Low-density lipoprotein cholesterol was calculated using the Friedewald formula. Glycated hemoglobin was estimated by high-pressure liquid chromatography using a Variant® chromatograph (Bio-Rad, Hercules, CA). The intra- and inter-assay coefficients of variation of glycated hemoglobin were less than 10%.
Diagnosis of microalbuminuria
Microalbuminuria was diagnosed if the albumin excretion was between 30 and 299 μg/mg of creatinine. A fasting urine sample was used to measure the microalbumin concentration using a immunoturbidometric assay with the Hitachi 902 autoanalyzer as described earlier. 25,26 The mean inter- and intra-assay coefficients of variation were 3.5% and 4.2%, respectively.
Definition of MS
MS was defined according to the National Cholesterol Education Program criteria for adults 27 modified for waist according to World Health Organization Asia Pacific guidelines for obesity. 28 MS was defined as the presence of any three of the following abnormalities: abdominal obesity defined as waist circumference of at least 90 cm for men and at least 80 cm for women, high blood pressure (systolic blood pressure ≥130 mm Hg or diastolic blood pressure ≥85 mm Hg), elevated fasting glucose (fasting plasma glucose ≥100 mg/dL), hypertriglyceridemia (triglycerides ≥150 mg/dL), or low high-density lipoprotein cholesterol (<40 mg/dL for men or <50 mg/dL for women.
Measurement of cys-C
A high-sensitivity particle-enhanced nephelometric immunoassay using polystyrene particles coated with specific antibodies to human cys-C was used to measure the serum concentration of cys-C. Cys-C is aggregated when mixed with samples containing human cys-C (Dade Behring, Marburg, Germany). In-kit quality controls were within acceptable range (coefficient of variation, 2.4–4.3%). The intra- and inter-assay coefficients of variation for cys-C were 3.1% and 3.8%, respectively, and the lower detection limit was 0.05 mg/L.
Equations for estimating renal function
The most commonly advocated formula for calculating the GFR (in mL/min/1.73 m2) is the one that was developed by the Modification of Diet in Renal Disease study equation
29
:
Statistical analysis
Data were expressed as mean ± SD values. Student's t test or one-way analysis of variance (with Tukey's HSD) as appropriate was used to compare groups for continuous variables, and χ 2 test or Fisher's Exact test was used to compare the proportions. Multiple logistic regression analysis was done to look for association of cys-C with MS after adjusting for age, gender, and body mass index. The Kruskal-Wallis test was used in case of non-normally distributed parameters to compare means. All analyses were done using the Windows-based SPSS statistical package (version 10.0, SPSS, Inc., Chicago, IL). P ≤ 0.05 was considered as significant.
Results
Table 1 shows the clinical and biochemical parameters of the subjects with varying degrees of metabolic risk factors, i.e., MRF 0, 1, 2, 3, and ≥4.There is a significant increment of creatinine levels with increasing number of metabolic risk factors (P for trend < 0.01), but levels of microalbuminuria did not differ significantly with increasing number of metabolic risk factors.
Compared to Group 0: *P < 0.05, **P < 0.01, ***P < 0.001.
Compared to Group 2: ‡ P < 0.05, ‡‡‡ P < 0.001.
Compared to Group 3: § P < 0.05, §§ P < 0.01.
Figure 1 shows that cys-C values were highest in subjects with MRF ≥4 (0.87 ± 0.08 mg/L) followed by MRF3 (0.85 ± 0.08 mg/L), MRF2 (0.81 ± 0.09 mg/L), MRF1 (0.77 ± 0.10 mg/L), and MRF 0 (0.73 ± 0.07 mg/L) (P for trend < 0.001) subjects.
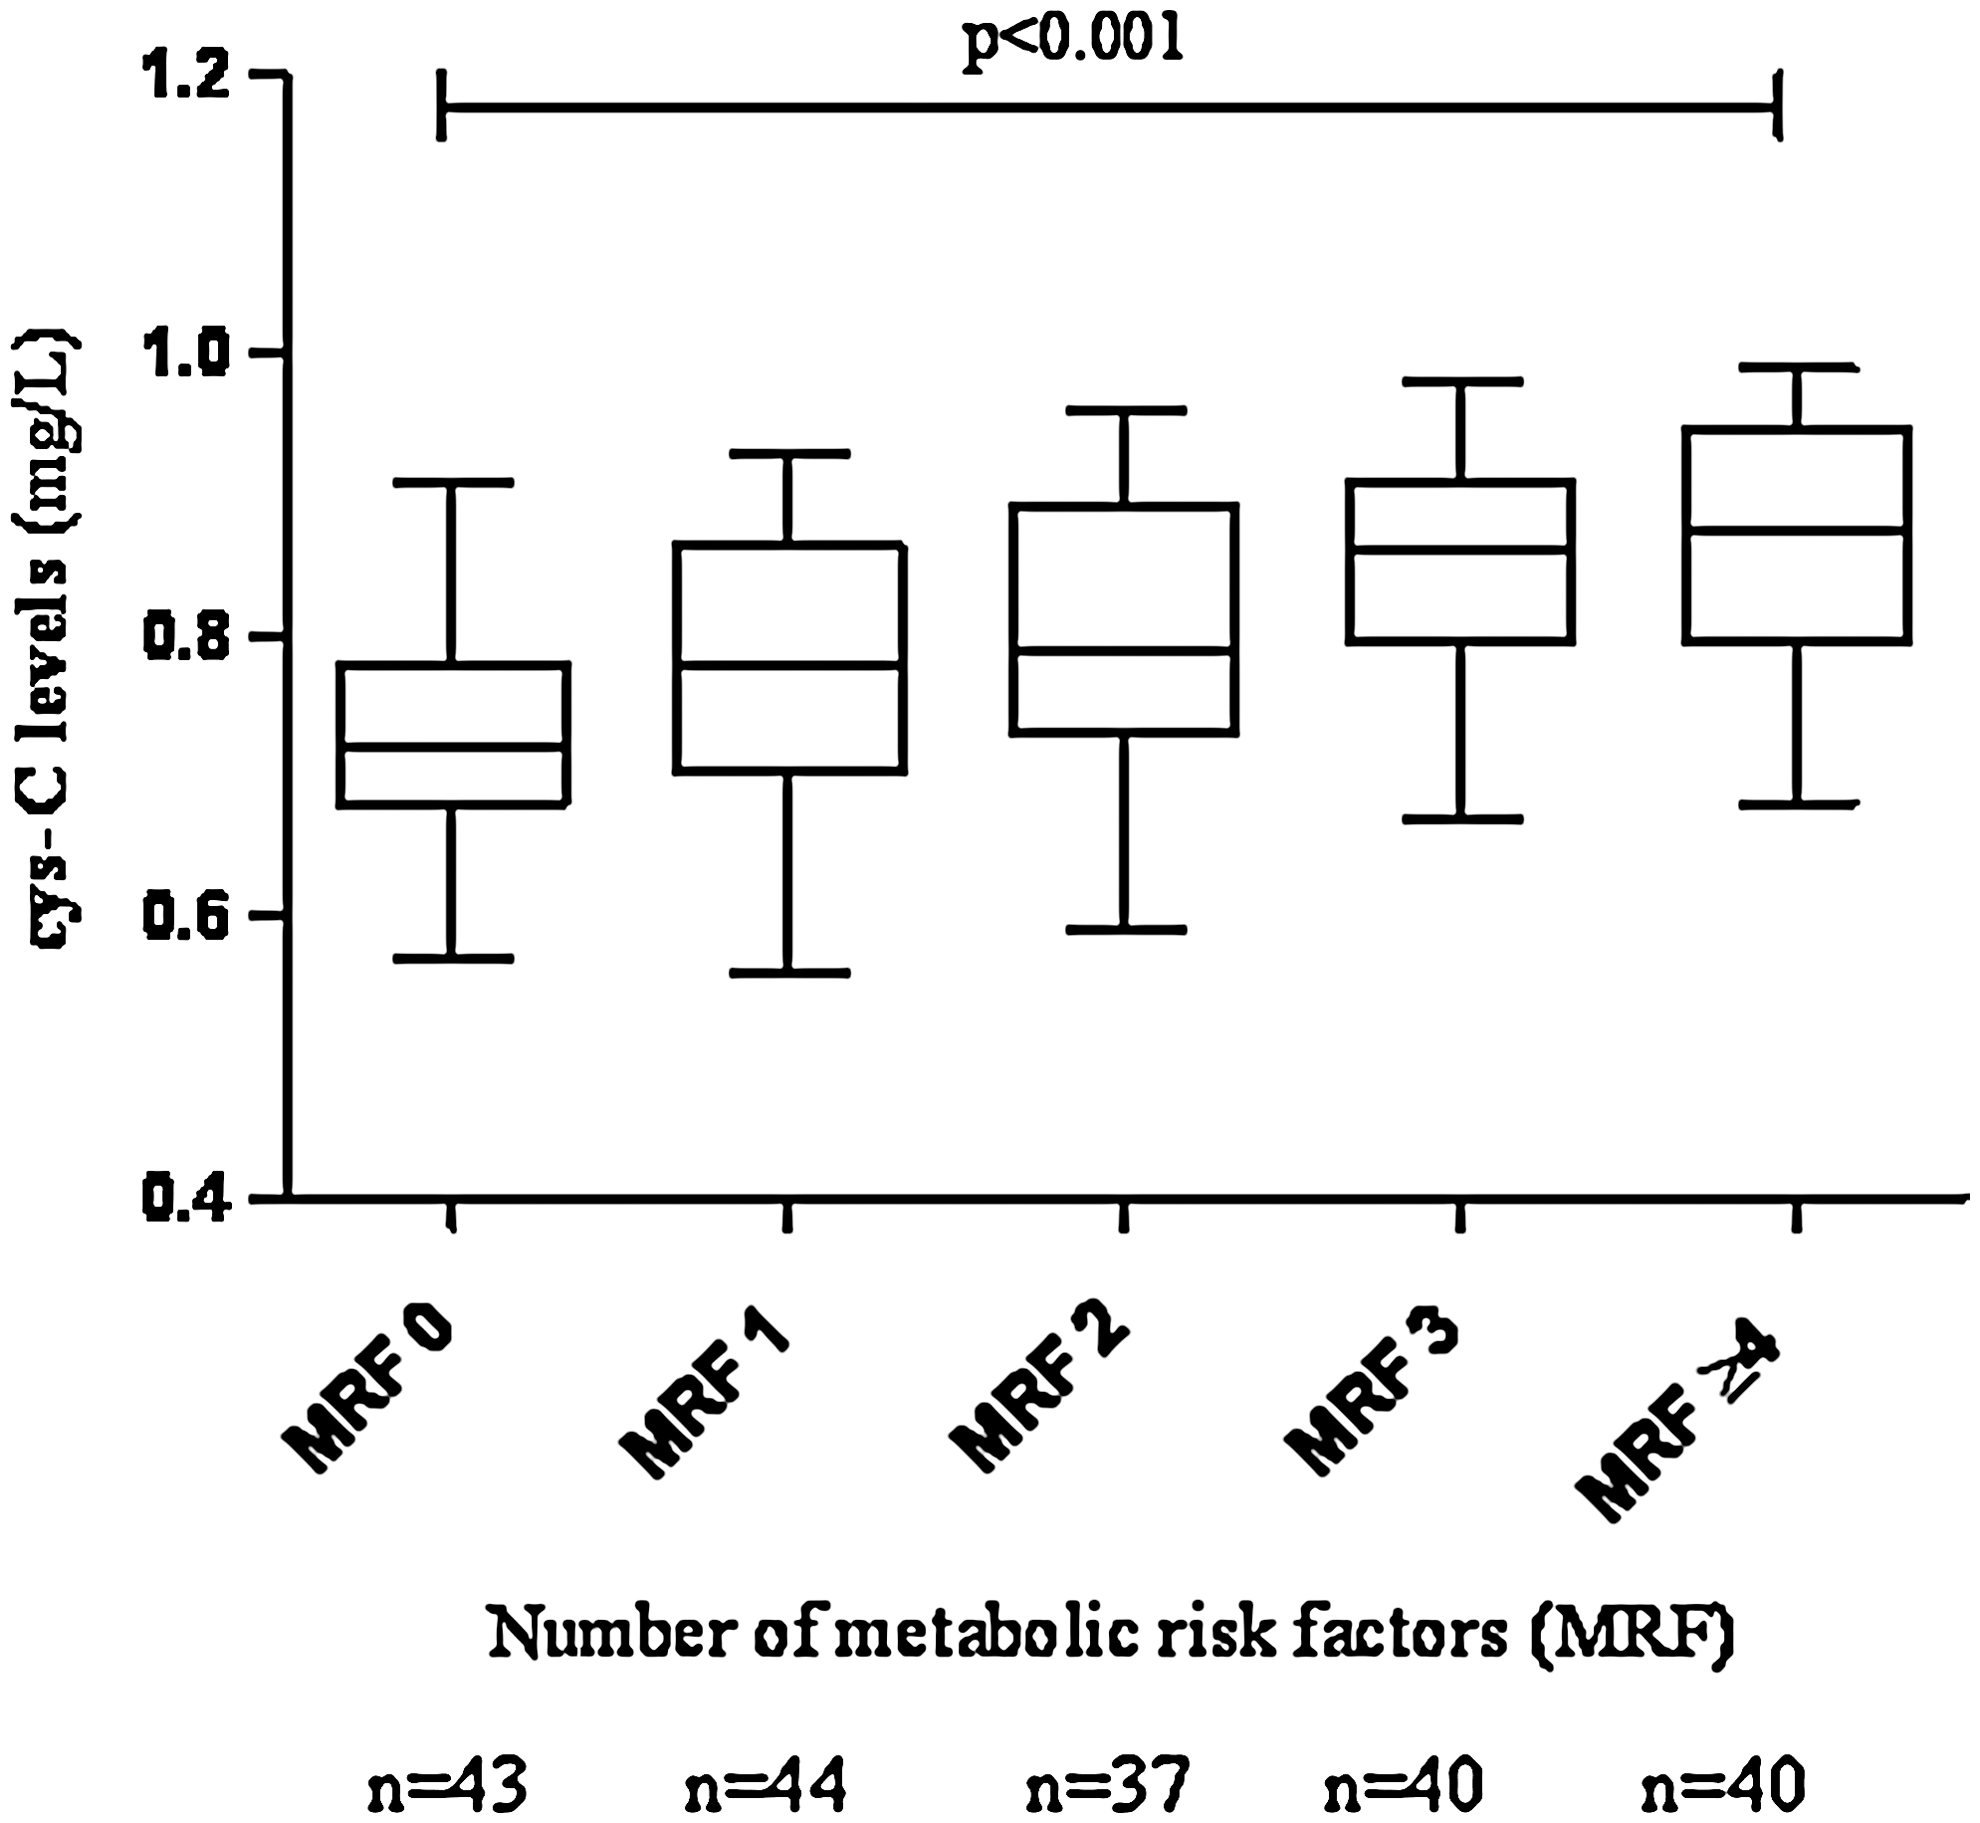
Cystatin-C (cys-C) levels in relation to number of metabolic abnormalities.
Table 2 depicts the linear regression analysis that was used to determine the association of cys-C with the components of MS: waist (β = 73.0; P < 0.001), systolic blood pressure (β = 58.41; P < 0.001), diastolic blood pressure (β = 72.82; P < 0.001), fasting blood sugar (β = 43.91; P < 0.05), high-density lipoprotein (β = −66.1; P < 0.001), and triglycerides (β = 87.0; P < 0.001) were significantly associated with cys-C. This remained statistically significant (P < 0.01) for all the metabolic components even after adjusting for age and gender.
CI, confidence interval.
Multiple logistic regression analysis revealed cys-C to be associated with MS (odds ratio [OR] 1.012, 95% confidence interval [CI] 1.008–1.015, P < 0.001) even after adjusting for age (OR 1.012, 95% CI 1.008–1.015, P < 0.001), gender (OR 1.012, 95% CI 1.008–1.016, P < 0.001), body mass index (OR 1.010, 95% CI 1.006–1.014, P < 0.001), and Modification of Diet in Renal Disease (OR 1.009, 95% CI 0.974–1.008, P < 0.001) (Table 3).
BMI, body mass index; MDRD, Modification of Diet in Renal Disease.
There was no significant difference in cys-C levels between nonsmokers (0.80 ± 0.10) and smokers (0.79 ± 0.10) (P for difference not significant).
Discussion
This study shows that cys-C levels were found to increase linearly with the increasing number of metabolic abnormalities and are highest in subjects with greater than four metabolic abnormalities. As the risk factors of MS have been already shown to be independently associated with cys-C, our results provide further support to the earlier studies demonstrating that cys-C could serve as a marker for MS. 19 –21
Earlier reports showed that cys-C levels are elevated in diabetes, 30 obesity, 31 –33 and hypertension. 33 Therefore, in our study, all the aforementioned factors, which are also integral components of the MS, could have acted synergistically to bring about an increment in the levels of cys-C. Additional evidence from the studies of Muntner et al. 34 proved a graded association between higher body mass index and elevated cys-C. Moreover, as increased adiposity results in insulin resistance and obesity, adipose tissues of obese individuals express (equivalently subcutaneous and omental) two- to threefold increased levels of cys-C relative to their lean counterparts. 35 Another reason for the elevated levels of cys-C could be inflammation and oxidative stress, which are key pathological features underlying the MS. This has also been shown in other populations where the levels of the inflammatory biomarkers C-reactive protein and fibrinogen showed a linear association with cys-C. 36 Furthermore, cys-C has been shown to interfere with polymorphonuclear cell chemotaxis, 37 O2 − release, and phagocytosis. 38 The fact that oxidative stress induced the synthesis of cys-C mRNA and protein demonstrated that it might be involved in self-defense cellular response to oxidative stress. 21 Increased levels of the oxidative stress marker malondialdehyde and the decreased antioxidant level seen in MS subjects also attest the role of oxidative stress in the MS. 21
As MS is the one of the links between cardiovascular and renal disease, 39 but measurement of several parameters is required, a single measurement of cys-C would considerably improve the early risk stratification of patients with suspected cardiovascular disease. Indeed, cys-C has been shown to be elevated in suspected or confirmed non-ST elevated acute coronary syndrome. 40 Increased levels of cys-C are also seen in increased left ventricular mass and concentric hypertrophy. 41 Other studies have also showed the association of cys-C with preclinical heart abnormalities 41 and cardiovascular disease. 13 –17
Plasma cathepsin S and cys-C increase significantly in angina patients. 42 Paradoxically, cys-C is found in a low level in atherosclerotic plaques. 9 One possible explanation for the increased cys-C in circulation, but not within the plaque, may be that cytokine-stimulated cells might secrete cys-C, which is released into circulation during the process of atherosclerosis. 31 Increased serum cys-C might be part of the regulatory mechanisms engaged to control the pro-atherogenic capacity of cathepsin.
The cross-sectional nature of our study does not allow us to conclude about any cause–effect link between the MS and cys-C. Further prospective studies are needed to clarify this issue. The study numbers were small, which is a limitation of the study. Nevertheless, the phenotypes were carefully assessed using sensitive markers. Moreover, this was a population-based study in a high-risk ethnic group (Asian Indians) in which there are very few studies on this subject. Another limitation is that that we did not measure thyroid function for our study subjects, and thyroid function might influence on the cys-C levels.
In conclusion, among Asian Indians progressive increase in the levels of cys-C was seen in parallel with an increase in the number of metabolic abnormalities. Future longitudinal studies will help to confirm whether cys-C could serve as a marker for development of diabetes or cardiovascular disease.
Footnotes
Acknowledgments
We are grateful to the Chennai Willingdon Corporate Foundation, Chennai, India, for the financial support provided for the study. We thank the epidemiology team members for conducting the CURES field studies. This is the 97th publication from CURES (CURES-97).
Author Disclosure Statement
No competing financial interests exist.