




Abstract
Background:
The objective of this investigation was to evaluate the test–retest repeatability of insulin sensitivity and secretion indices derived from liquid meal tolerance tests (MTTs) in subjects with normal fasting glucose (NFG) (n = 20), impaired fasting glucose (IFG) (n = 20), or type 2 diabetes mellitus (n = 38).
Methods:
The Matsuda Index of insulin sensitivity and a Disposition Index (the product of the Matsuda Index and the ratio of the total areas under the curves for glucose and insulin from 0 to 120 min) were assessed in two standard liquid MTTs, separated by approximately 1 week.
Results:
Mean ± SD Matsuda Index values were 14.2 ± 7.6, 8.8 ± 4.7, and 6.3 ± 4.0, and Disposition Index values were 1,009.6 ± 355.5, 671.4 ± 249.0, and 201.8 ± 101.3 for NFG, IFG, and diabetes, respectively (all P < 0.05 except Matsuda Index for IFG vs. diabetes, P = 0.241). Differences between tests in subjects with NFG, IFG, and diabetes, respectively, were −0.2 ± 3.6 (coefficient of variation for the method error, 17.9%), 0.2 ± 3.2 (26.1%), and 0.1 ± 3.0 (34.1%) for the Matsuda Index and 16.5 ± 225.8 (16.1%), 13.3 ± 221.6 (23.1%), and 15.2 ± 79.4 (28.1%) for the Disposition Index.
Conclusions:
The Matsuda and Disposition indices derived from liquid MTTs appropriately ranked categories of fasting glucose tolerance and have repeatability profiles suggesting potential usefulness in population studies and moderately sized clinical trials requiring repeated measurements.
Introduction
The ability to assess insulin sensitivity and pancreatic β-cell dysfunction is central in studying the pathogenesis of type 2 diabetes mellitus and for evaluation of interventions aimed at prevention. Several methods exist for measuring these parameters, including mathematical modeling of data collected during intravenous glucose tolerance tests (IVGTTs) and euglycemic and hyperglycemic clamp procedures. 5 –8 However, because these methods are costly and labor-intensive, their use is typically restricted to studies of small numbers of subjects. A variety of surrogate measures of insulin sensitivity and secretion have been developed from the simpler and less expensive oral glucose tolerance test (OGTT) and meal tolerance test (MTT) protocols. These parameters perform reasonably well for discrimination between groups and individuals with differing levels of insulin resistance and β-cell dysfunction 7,9 –13 and correlate well with those from glycemic clamp studies and minimal model analysis of IVGTT data. 14 –16 Recently, Retnakaran et al. 12 reported that the product of the Matsuda Index of insulin sensitivity and an insulin secretion index from the OGTT (the ratio of the total areas under the curves for insulin and glucose from 0 to 120 min) showed a relationship that could be described as a rectangular hyperbole, thus making it a potentially useful measure of pancreatic β-cell function. This measure is analogous to the Disposition Index described by Kahn et al. 17 and Kahn 18 as the product of the acute insulin response to intravenous glucose and the insulin sensitivity index derived from minimal model analysis of IVGTT data.
The IVGTT and OGTT each administer a standard glucose load, which is useful for examining disturbances in carbohydrate metabolism, but inadequate for assessing post-load lipid and incretin responses to a mixture of nutrients. Solid mixed nutrient meal tests are useful in this regard, but solid foods are less easily standardized across regions and countries. This limits the ability to accurately utilize the solid MTT in population studies and multicenter clinical trials.
We recently published an initial assessment of insulin sensitivity (Matsuda Index) and secretion (Disposition Index) values derived from an easily standardized liquid MTT protocol, which demonstrated that these indices correctly ranked groups with normal fasting glucose (NFG), IFG, and type 2 diabetes. 19 The results presented here examine the test–retest repeatability of indices calculated from two liquid MTTs administered on separate days.
Subjects and Methods
Subjects and design
Data for this study were obtained from samples collected in a randomized crossover clinical intervention trial 19,20 approved by an appropriately constituted Institutional Review Board and conducted according to Good Clinical Practice Guidelines, the Declaration of Helsinki (2000), and the United States 21 Code of Federal Regulation. The methods of that study were previously described. 19,20 All participants provided informed consent. The intervention under study was a high-intensity sweetener (rebaudioside A). The results showed that the sweetener had no effects on plasma glucose, insulin, or C-peptide concentrations, 20 and kinetic studies showed that no steviol glucuronide (the metabolite of rebaudioside A that is absorbed after ingestion) is present in plasma during the first 12 h after ingestion in humans, 21 making it highly unlikely that the sweetener was exerting systemic effects after ingestion. Accordingly, this allowed evaluation of the repeatability of indices of insulin sensitivity and secretion derived from two liquid MTTs administered approximately 1 week apart.
Subjects included men and women (18–74 years of age) with or without diabetes. Those without diabetes had no history of glucose intolerance or reactive hypoglycemia and had glycosylated hemoglobin ≤6.0%, fasting plasma glucose <6.1 mmol/L, and a body mass index of 25–45 kg/m2. For the analyses of this study, subjects without diabetes were further categorized as having NFG if their average premeal fasting plasma glucose concentration was <5.56 mmol/L or IFG if this average was ≥5.56 mmol/L. 22 Subjects with diabetes had been diagnosed ≥1 year earlier, had been treated for ≥12 weeks with stable dose(s) of one to three oral hypoglycemic agents (sulfonylurea alone or in combination with metformin and/or a thiazolidinedione), basal insulin, or a combination of basal insulin plus a(n) oral hypoglycemic agent(s), and had levels of glycosylated hemoglobin of ≤9.0% and fasting plasma glucose of <11.1 mmol/L. Exclusionary criteria included a history of significant renal, pulmonary, hepatic, or biliary disease or cardiovascular events (including revascularization procedures) within 6 months of screening. Use of systemic corticosteroids was prohibited, as was the use of insulin, meglitinides, or α-glucosidase inhibitors within 8 weeks of screening.
Data collection
Subjects were administered a standard liquid MTT twice, separated by approximately 1 week. Each liquid meal provided 500 kcal, 80 g of carbohydrate, 12 g of fat, and 18 g of protein (Chocolate Ensure®, Abbott Nutrition, Columbus, OH). Subjects arrived for testing after fasting for at least 10 h. They were instructed to consume a diet with at least 150 g/day carbohydrate and to avoid vigorous physical activity during the 48 h prior to each MTT. Blood samples were collected for analysis of plasma glucose and insulin concentrations at premeal (−5 and 0 min) and at 30, 60, 90, 120, 150, 180, 210, and 240 min postmeal via an indwelling venous catheter.
Laboratory tests were performed by Medpace Laboratories (Cincinnati, OH). Glycosylated hemoglobin was measured by high-performance liquid chromatography. 23,24 Glucose was analyzed by photometry following a reaction with hexokinase reagent, 25 and insulin was measured using an electrochemiluminescence immunoassay. 26 Indices of insulin sensitivity and secretion were determined using data collected on each of the two MTT days (MTT1 and MTT2). The Matsuda Index was calculated as follows, where G 0 and I 0 were premeal values for plasma insulin (in pmol/L) and glucose (in mmol/L), respectively, and G m and I m were respective mean postmeal values during the first 120 min of the test: 10,000/(G 0 × I 0 × G m × I m)0.5 . 9 An insulin secretion index was calculated as the total area under the curve for plasma insulin from 0 to 120 min/total area under the curve for plasma glucose from 0 to 120 min. 12 The liquid MTT Disposition Index, analogous to the Disposition Index from minimal model analysis of the IVGTT described by Kahn et al. 17 and Kahn, 18 was calculated as Matsuda Index × insulin secretion index. 12
Statistical analyses
Statistical analyses were generated using SAS version 9.1.3 and StatView version 5.0 (SAS Institute, Cary, NC). Subjects with complete data for plasma glucose and insulin on both test days were included in the analysis. Analysis of variance was used to assess differences among fasting glucose categories (NFG, IFG, and diabetes) for Matsuda Index and Disposition Index using the average values from MTT1 and MTT2, followed by Scheffe's test for pairwise comparisons. Mean differences and SD of the differences were determined for each fasting glucose category. Method error was determined as the SD of the differences in values between MTT1 and MTT2 × √2. The coefficient of variation for the method error for Matsuda Index and Disposition Index was calculated for each glucose category as follows: 100 × method error/(0.5 × [mean value from MTT1 + mean value from MTT2]). 27 Bland-Altman plots were used to examine the Matsuda Index and Disposition Index differences between the two MTTs in each fasting glucose category across the range of mean values from the two tests. Pearson correlation coefficients and regression analyses were also used to evaluate the strength and nature of the relationships for Matsuda Index and Disposition Index values calculated from MTT1 and MTT2 data.
In addition, subgroup analyses were conducted to assess possible effects of age or gender on repeatability. Differences between values on different test days, SDs, and coefficients of variation for the method errors were analyzed in subsets of male and female subjects and younger and older subjects (split at the median age for each fasting glucose category) as described above.
Results
Characteristics of study subjects with NFG (n = 20), IFG (n = 20), and diabetes (n = 38) are shown in Table 1. Mean ± SD values for the Matsuda Index and Disposition Index on MTT1 and MTT2, as well as the coefficients of variation of the method errors, are shown in Table 2. Mean ± SD Matsuda Index values from the mean of the two tests were 14.2 ± 7.6, 8.8 ± 4.7, and 6.3 ± 4.0, and Disposition Index values were 1,009.6 ± 355.5, 671.4 ± 249.0, and 201.8 ± 101.3 for subjects with NFG, IFG, and diabetes, respectively. Disposition Index values significantly distinguished among all fasting glucose categories (all P < 0.001), and Matsuda Index values significantly distinguished between NFG and IFG (P = 0.007) and between NFG and diabetes (P < 0.001). However, Matsuda Index values were not significantly different between subjects with IFG and diabetes (P = 0.241). Analyses in subgroups categorized by sex and age split at the median within each fasting glucose category showed no evidence of material differences in repeatability across subgroups (data not shown).
Data are mean ± SEM values, except total number.
Values in a row with different letters were significantly different (P < 0.05).
IFG, impaired fasting glucose; NFG, normal fasting glucose.
Data are mean ± SD values except coefficients of variation of the method errors. The Matsuda Index was calculated as follows,9 where G 0 and I 0 were the premeal values for plasma insulin (in pmol/L) and glucose (in mmol/L), respectively, and G m and I m were the respective mean postmeal values during the first 120 min of the test: 10,000/(G 0 × I 0 × G m × I m)0.5. The Disposition Index was calculated as the product of Matsuda Index and the ratio of total areas under the curve from 0 to 120 min for insulin/glucose.12 Method Error was determined as the SD of the differences in values between MTT1 and MTT2 × √2. Coefficient of variation of the method error was calculated as follows: 100 × method error/(0.5 × [mean value from MTT1 + mean value from MTT2]).27
IFG, impaired fasting glucose; MTT1 and MTT2, first and second meal tolerance tests, respectively; NFG, normal fasting glucose.
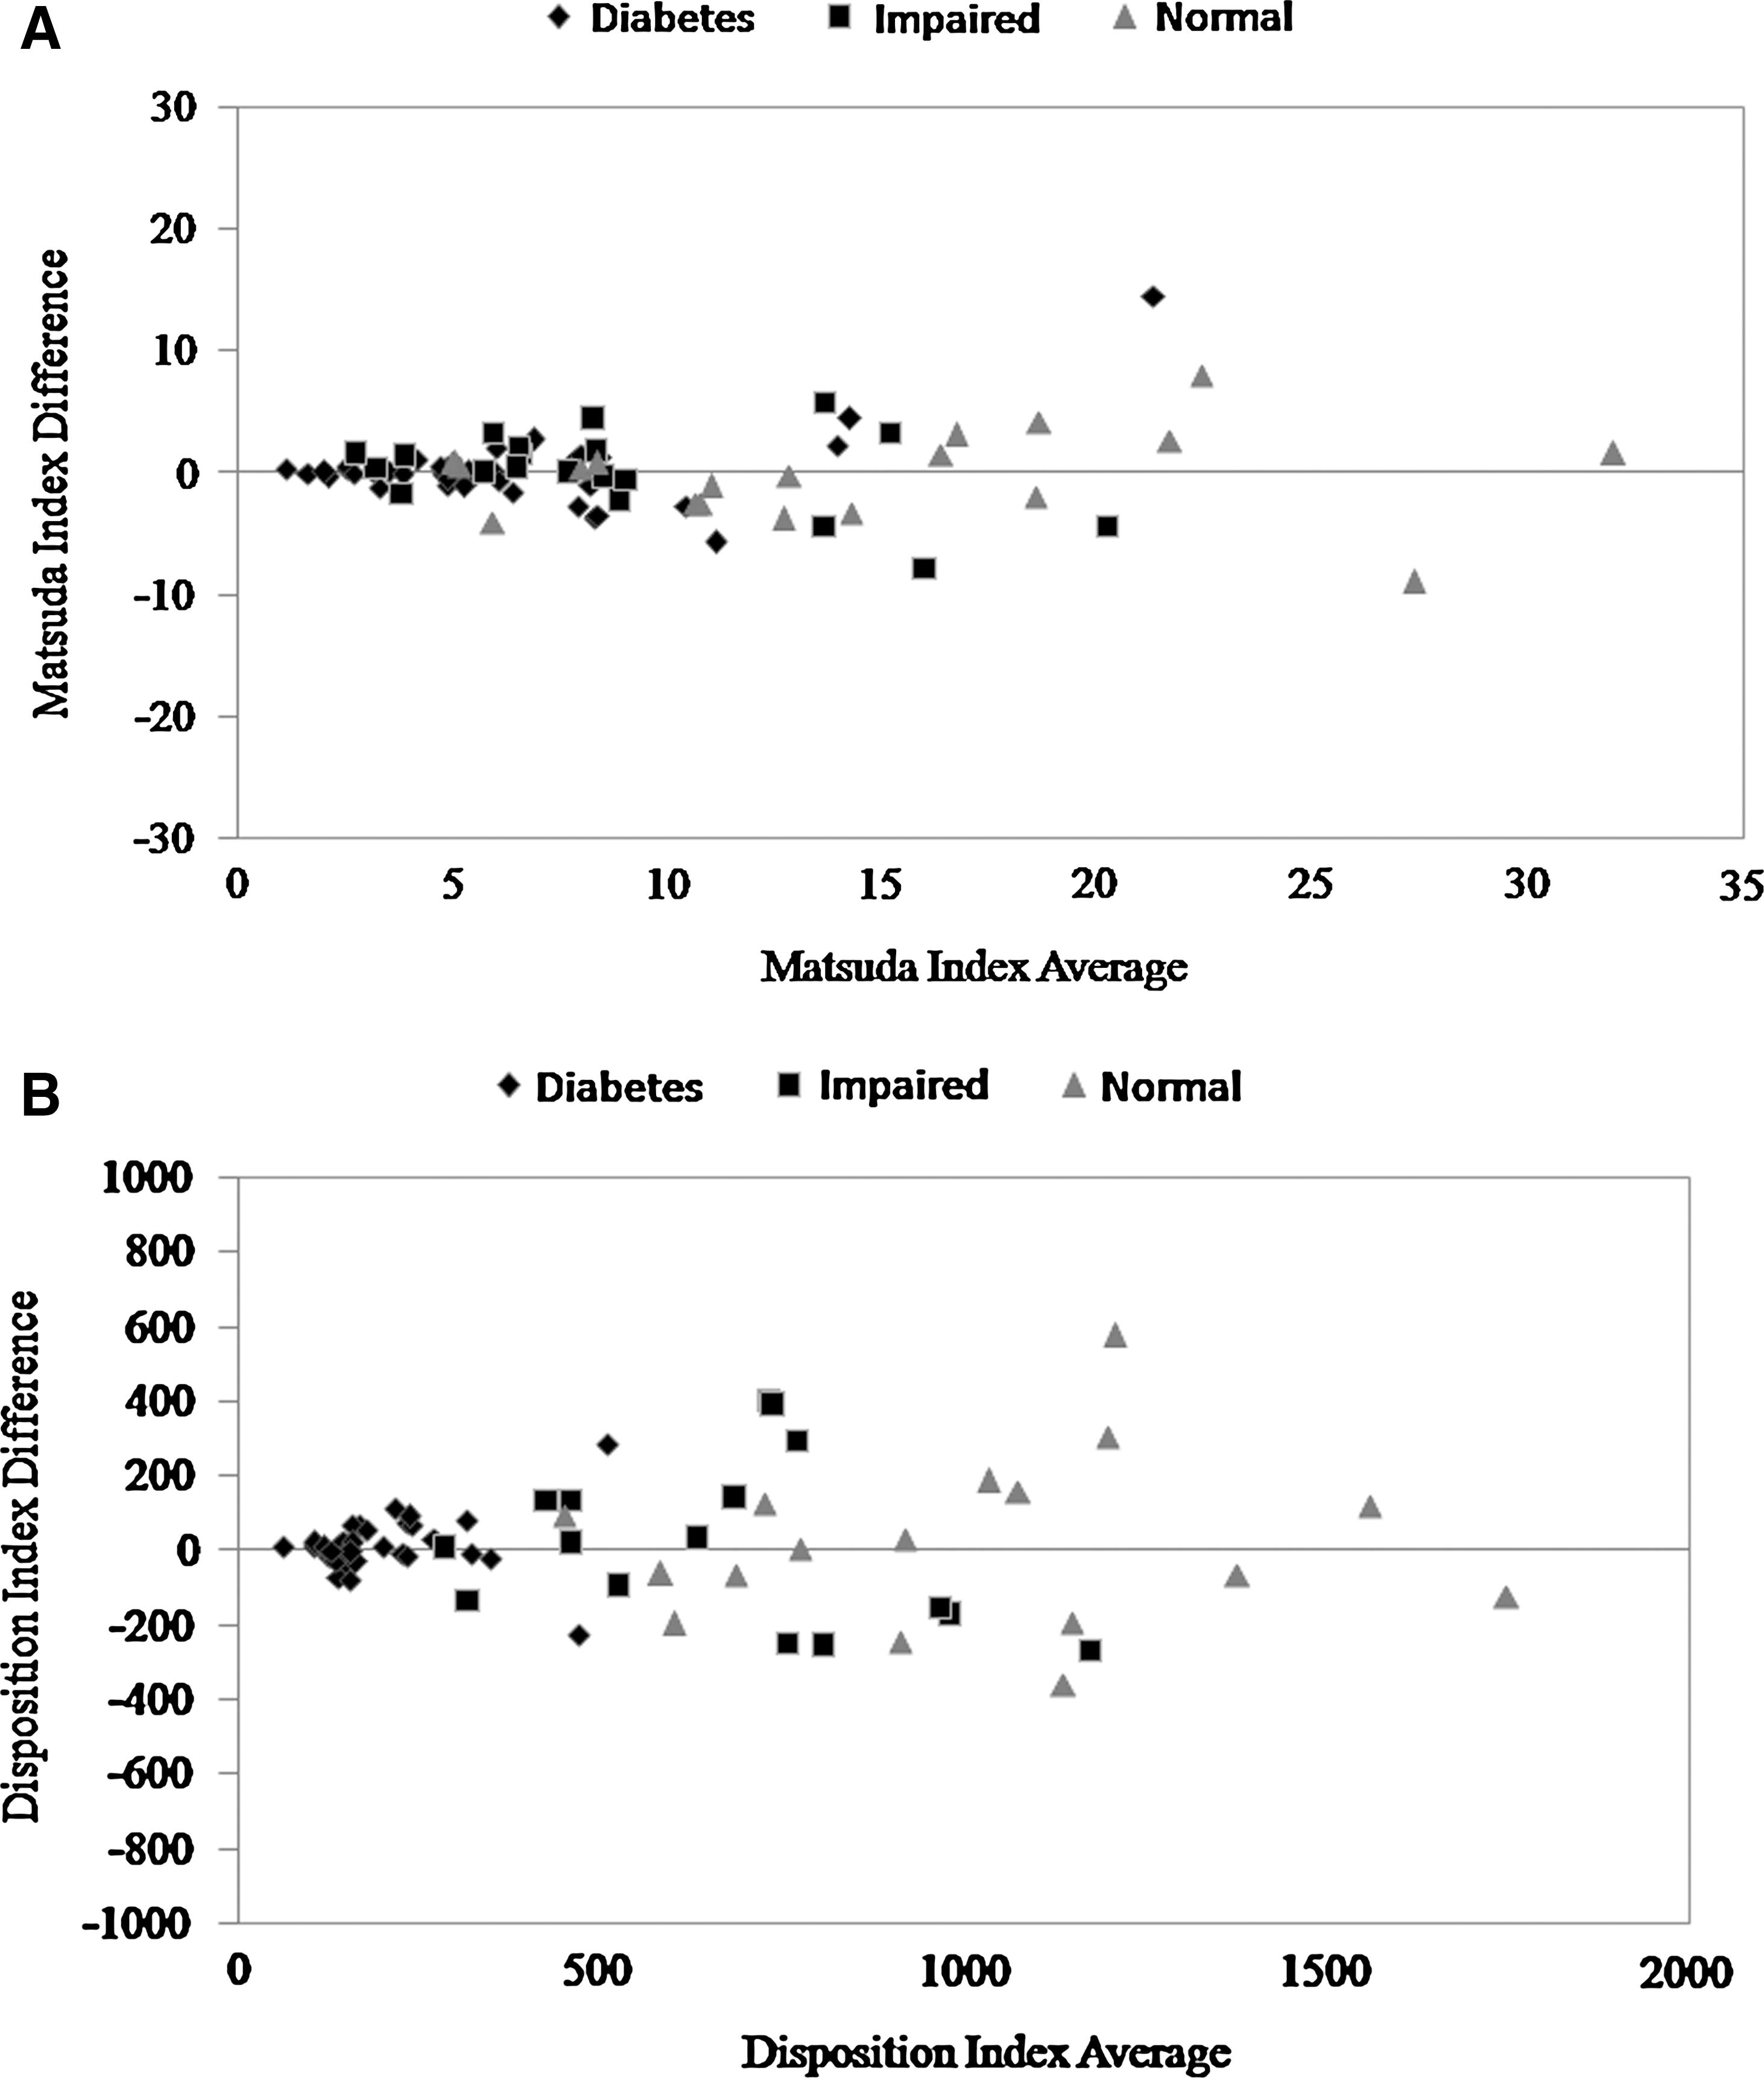
Mean differences in Matsuda Index values for MTT1 and MTT2 ranged from −0.2 to 0.2, and for Disposition Index values, mean differences between test days ranged from 13.3 to 16.5. Bland-Altman plots did not suggest bias in the estimates across the range of mean values from the two tests (Fig. 1). In all glucose categories, values from the two test days were significantly correlated for both the Matsuda and Disposition Indices (P < 0.005 for all). Correlations of MTT1 and MTT2 Matsuda Index values were r = 0.894, 0.812, and 0.793 for NFG, IFG, and diabetes, respectively, and for Disposition Index values were r = 0.818, 0.683, and 0.739, for NFG, IFG, and diabetes, respectively.
Discussion
These results confirm those from a preliminary evaluation that showed that Matsuda Index and Disposition Index estimates from the standard liquid MTT effectively ranked categories of fasting glucose tolerance. 19 Furthermore, this study demonstrated the test–retest reliability of these measurements of insulin secretion and sensitivity. These findings will facilitate sample size calculations for future studies utilizing the liquid MTT with Matsuda Index and Disposition Index calculations. Using the largest SD of the Matsuda Index (3.6) and Disposition Index (226) values as assumptions in sample size/power calculations, a trial involving 44 healthy subjects in each of two parallel treatment groups tested at baseline and the end of an intervention period would be expected to have 80% power to detect a difference between groups of 2.2 in Matsuda Index response and 138 in Disposition Index response using two-sided t tests (α = 0.05). 28 These results suggest that this relatively simple and cost-effective method has potential utility in population studies and moderately sized clinical intervention trials that require repeated measurements. In addition, no material differences were noted in repeatability across subgroups of men and women or among younger and older subjects, although these represented relatively small subgroups, so these findings will need to be confirmed.
The ability of a MTT (liquid or solid) to be an appropriate stimulus for assessing insulin sensitivity is supported by several previous investigations. 14 –16,29 –32 Additional studies will be needed to directly compare the liquid MTT approach used in the current study to results obtained from mathematical modeling of IVGTT data, as well as euglycemic and hyperglycemic clamp procedures. Available data from other MTT evaluations suggest that absolute values may not be comparable to the established methods, but are correlated. Steil et al. 16 reported a significant correlation between a minimal model insulin sensitivity index from the MTT and the euglycemic clamp procedure (r = 0.760, P < 0.001). Caumo et al. 15 also reported a strong correlation between insulin sensitivity indices derived from minimal model analyses of MTT and IVGTT data (Spearman r = 0.89, P < 0.01).
The indices described herein, the Matsuda Index and the Disposition Index, have been shown to be among the best indicators of insulin sensitivity and secretion from the OGTT. 12 –14,19 Recently, the Actos Now for Prevention of Diabetes (ACT NOW) Study investigators reported that within the normal to impaired glucose tolerance range, the OGTT-derived Matsuda Index was more sensitive than the insulin sensitivity index derived from minimal model analysis of IVGTT data for detecting changes in insulin sensitivity. 13 Aloulou et al. 14 also found that the Matsuda Index was the strongest correlate of insulin sensitivity (r = 0.656, P < 0.001) from minimal model analysis using an IVGTT as a standard for comparison. Retnakaran et al. 12 investigated several measures derived from OGTT data and reported that the product of the Matsuda Index and the insulin secretion index (i.e., the Disposition Index) was the best indicator of the appropriateness of insulin secretion for the level of insulin sensitivity. Nonetheless, caution is warranted when using OGTT- or MTT-derived indices to assess changes in insulin sensitivity because variations in β-cell function, adiposity, and the rate of glucose absorption may also impact estimates of insulin sensitivity derived from oral carbohydrate loads. 33
As described previously, 19 the liquid MTT used in the current study has a number of potential advantages over a solid MTT or an OGTT. It is a commercially available product requiring no food preparation and thus can be easily standardized across multiple research sites. As a mixed nutrient load, it provides a more physiologic stimulus than glucose alone for assessing postprandial glucose, insulin, lipid, and incretin responses. Furthermore, because the liquid MTT requires no chewing, potential variability introduced by differences in the degree of chewing of solid foods is removed.
A potential limitation of this study was that subjects without diabetes were categorized only by their fasting glucose concentrations as NFG or IFG, and there was no measurement of oral glucose tolerance. Furthermore, subjects with IFG fell into a relatively narrow range of fasting glucose concentrations (5.56–6.11 mmol/L) because of the exclusion criteria of the trial. People with prediabetes have IFG, impaired glucose tolerance, or both. IFG is defined by the National Institute of Diabetes and Digestive and Kidney Diseases as a fasting blood glucose level of 5.6–6.9 mmol/L, whereas impaired glucose tolerance is a condition in which blood glucose level is 7.8–11.0 mmol/L after a 2-h OGTT. 1 In this study, some of the subjects with NFG and IFG might have been shown to have impaired glucose tolerance if an OGTT had been completed. Therefore, future research should test the results of the liquid MTT-derived Matsuda Index and Disposition Index in fully characterized subjects with a wider range of fasting glucose and post-load glucose concentrations to assess the generalizability of these results. Additionally, inclusion of a third test day is desirable but was not possible in this study, which used data from a previous intervention trial that included two meal tests.
Because the coefficient of variation for the method error statistic is expressed as a percentage of the mean value, it increased as fasting glucose status worsened. This is not surprising because mean values for both the Matsuda and Disposition Indices decline with worsening fasting glucose status. However, the test–retest differences and SDs did not differ materially across fasting glucose categories. Therefore, when expressed in terms of absolute difference (change), the repeatability is similar, but when expressed in terms of relative difference (percentage change), those with lower baseline values (e.g., subjects with diabetes) would be expected to show greater variability because of the “small denominator effect.”
Conclusions
The Matsuda and Disposition indices calculated from liquid MTTs discriminated between categories of fasting glucose status and provided acceptably reliable estimates in repeated tests. Calculations of Matsuda Index and Disposition Index from liquid MTTs may be a useful alternative for assessment of insulin secretion and sensitivity in population studies and moderately sized clinical intervention trials.
Footnotes
Author Disclosure Statement
Provident Clinical Research received funding from Cargill Corp. (Wayzata, MN) for the clinical study that generated the data reported here. Provident Clinical Research, of which K.C.M., T.M.R., and M.R.D. are employees, has also received research funding from and/or provided consulting to Abbott Nutrition (Columbus, OH), the manufacturer of the liquid meal test product used. M.B. has no competing financial interests.