
Abstract
Background:
Liver fat content (LFC) in subjects without diabetes may be correlated with adverse glucose profiles.
Methods:
LFC was measured by 1H magnetic resonance spectroscopy in 47 healthy subjects, 35 of whom also completed continuous glucose monitoring (CGM) studies. Subjects were divided into two groups according to LFC, and between-group comparisons of glucose profiles were made.
Results:
The median LFC value was 3.8% (interquartile range, 2.4–7.6%), and 29.8% of the subjects had LFC values ≥5.5%. LFC was positively correlated with triglyceride, aspartate aminotransferase, γ-glutamyltransferase, fasting C-peptide, fasting insulin, insulin concentration at 120 min, area under the time–concentration curve for insulin, and change in insulin from 0 to 30 min, homeostatic model assessment of insulin resistance, fasting plasma glucose, nocturnal mean blood glucose concentration (MBG) (all P < 0.05). The 35 CGM profiles revealed that nocturnal MBG was higher in subjects with LFC ≥3.8% (P < 0.05). In subjects with LFC ≥5.5%, both diurnal and nocturnal MBG values were elevated compared with subjects with lower LFC (P < 0.05). LFC was the strongest predictive factor of nocturnal MBG.
Conclusions:
Even modestly elevated LFC was associated with unfavorable glucose profiles in subjects without diabetes.
Introduction
We investigated whether the deposition of fat in the liver is associated with glycemic abnormalities that may precede type 2 diabetes. Large glycemic excursions accompanied by excessive fat accumulation in the liver, especially among people without diabetes, would indicate such a relationship. Continuous glucose monitoring (CGM) provides a methodology for retrospectively assessing glucose profiles. Therefore, we hypothesized that liver fat content (LFC) would be associated with the adverse glucose profiles even in subjects without diabetes.
Research Design and Methods
Study population
We enrolled subjects for this and an earlier study 14 between October 2007 and July 2008. Subjects did not meet the diagnostic criteria for impaired glucose regulation or diabetes 15 or hypertension, 16 had no history of coronary artery diseases or cerebral stroke, had a normal body mass index (BMI) of between 18.5 and 24.9 kg/m2, 17 and had no dyslipidemia according to 2007 Chinese guidelines. 18 The exclusion criteria were as follows: medications known to affect glucose metabolism such as glucocorticoids, thyroid hormones, and thiazide diuretics during the month before enrollment; hepatic dysfunction (defined as >1.5-fold elevation of ALT, aspartate aminotransferase [AST], or direct bilirubin) or renal dysfunction (defined as serum creatinine >115 μmol/L); a history of hepatic disease; daily alcohol consumption in excess of 20 g/day (men) or 10 g/day (women); and history of alcohol misuse. This study was independently approved by the hospital ethics committee. All subjects gave written informed consent before study initiation. No medications that would adversely affect glucose tolerance were allowed during the trial.
Upon enrollment, all subjects provided a detailed social and family history, and anthropometric data were obtained by a single physician. Baseline blood tests included a routine biochemistry panel (liver enzymes, renal function, and lipid profiles). A 75-g oral glucose tolerance test (OGTT) was performed with glucose, insulin, and C-peptide measurements made at 0, 30, 60, 120, and 180 min.
Measurement of LFC
Localized proton magnetic resonance spectroscopy ( 1 H-MRS) images of the liver were acquired using a 1.5-T Avanto MR system (Siemens AG, Erlangen, Germany). Sagittal, coronal, and axial slices through the right lobe of the liver were acquired, and an 8-cm3 volume of liver parenchyma was selected for further study. Spectra were collected using a Q-body coil for radiofrequency transmission and signal reception and a double-echo point-resolved spectroscopy sequence for 128 acquisitions. Areas of resonances from protons of water and methylene groups in fatty acid chains were obtained with a time-domain nonlinear fitting routine using commercial software (Syngo spectroscopy VB15, Siemens AG). LFC was calculated by dividing the integral of the methylene groups in fatty acid chains of the hepatic triglycerides by the sum of methylene groups and water. 3
CGM
A CGM sensor (Medtronic Diabetes, Northridge, CA) was inserted into each subject at day 0 between 8:00 AM and 9:00 AM, and fingerstick calibration was conducted after 1 h of initialization. Subjects with successfully initialized sensors were instructed to input at least four calibration readings per day for the next 72 h. At Day 3 they returned to the hospital for sensor removal. Sensor accuracy criteria have been described previously. 19,20 The following criteria for optimal accuracy were adhered to: a correlation between the sensor and meter readings of at least 0.79, a mean absolute difference of no more than 28% on days when the range of meter values was ≥5.6 mmol/L, and a mean absolute difference of ≤18% on days when the range of meter values was <5.6 mmol/L.
The 24-h mean blood glucose (MBG) was calculated from 288 consecutive sensor readings taken at 5-min intervals over a 24-h period. Diurnal and nocturnal phases were defined as 6:00 AM to 10:00 PM and 10:00 PM to 6:00 AM, respectively. The area under the glucose–time curve in the 4 h following each meal (area under the curve postprandial [AUC-pp]) and the mean amplitude of glycemic excursions (MAGE) were recorded and calculated. All of the above parameters were based on the mean values taken on days 1 and 2.
Subjects were asked to adhere to a standard diet during the CGM phase of the study, consisting of a total daily caloric intake of 30 kcal/kg/day with 50% of calories from carbohydrates, 15% from protein, and 35% from fat. Instructions were provided to control for the caloric content and consumption time of breakfast (20% of daily calories, 6:30–7:30 AM), lunch (40%, 11:30 AM–12:30 PM), and dinner (40%, 6:00–7:00 PM). 14
Clinical chemistry
Plasma glucose was determined using the glucose oxidase method. A fully automated biochemistry analyzer (model 7170A, Hitachi, Tokyo, Japan) was used to measure hepatic biomarkers. Insulin and C-peptide were measured by radioimmunoassay (Liso-phase; Technogenetics, Milan, Italy). The Surestep® blood glucose meter (LifeScan, Milpitas, CA) was used for capillary blood glucose determinations. The homeostatic model assessment of insulin resistance index (HOMA-IR) and homeostatic model assessment of β-cell function (HOMA-β) were calculated as described previously. 21
Statistical methods
CGM parameters were calculated using CGMS Solutions Software version 3.0 (Medtronic Diabetes). Statistical analyses were performed using SPSS software version 13.0 (SPSS, Inc., Chicago, IL). Normally distributed data are presented as mean ± SD values; skewed data are presented as means with interquartile ranges. The t test was used for comparison between two groups when data were normally distributed; the Kruskal–Wallis test and Spearman's correlations were used for skewed data. Multiple linear stepwise regression analysis was used in multivariate analysis. P < 0.05 was considered to be significant.
Results
LFC
Demographic, anthropometric, and biochemical characteristics of the subjects were all within normal limits (Table 1). The median LFC was 3.8% (interquartile range, 2.4–7.6%; range, 0–45.3%), and 14 subjects (29.8%) had LFC ≥5.5%. The frequency distribution of LFC is shown in Figure 1.
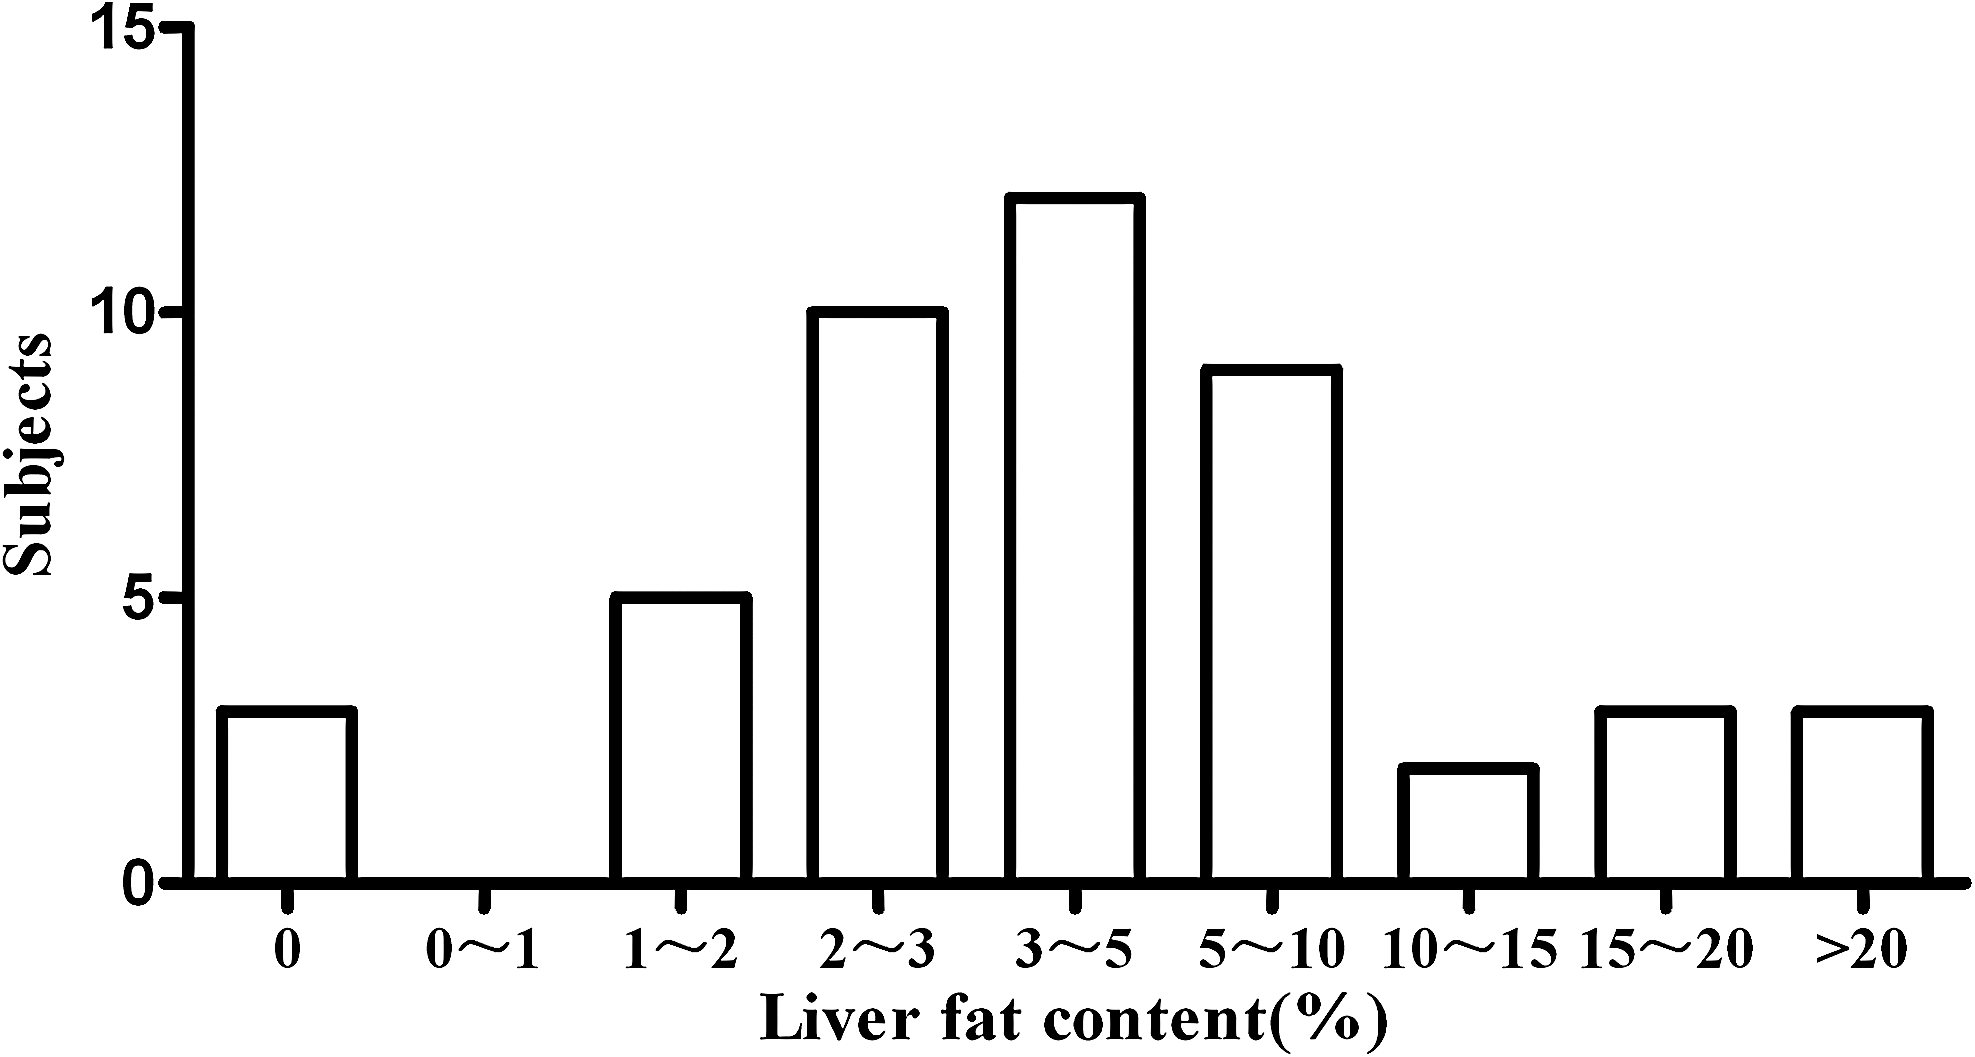
Frequency distribution of liver fat content.
Data are mean ± SD or mean (range) values. Independent-samples t test (two tailed) was used unless specified otherwise.
Pearson χ2 test.
Kruskal–Wallis test.
Significance: a P < 0.05 versus LFC <3.8%; b P < 0.01 versus LFC <3.8%; c P < 0.05 versus LFC <5.5%; d P < 0.01 versus LFC <5.5%.
AKP, alkaline phosphatase; ALT, alanine aminotransferase; AST, aspartate aminotransferase; AUC, area under the time–concentration curve; AUC-pp, the area under the glucose–time curve postprandial for the 4 h after each meal; CGMS, continuous glucose monitoring system; ΔCP30, change in C-peptide from 0 to 30 min; FPG, fasting plasma glucose; γ-GT, γ-glutamyltransferase; HDL-C, high-density lipoprotein cholesterol; HOMA-IR, homeostatic model assessment of insulin resistance; HOMA-β, homeostatic model assessment of β-cell function; ΔI 30, change in insulin from 0 to 30 min; LDL-C, low-density lipoprotein cholesterol; LFC, liver fat content; MAGE, mean amplitude of glycemic excursions; MBG, mean blood glucose concentration over 24 h (diurnal from 8:00 AM to 10:00 PM; nocturnal from 10:00 PM to 8:00 AM); OGTT, 75-g oral glucose tolerance test; 2-h PG, glucose value 2 h after an OGTT.
Clinical variables in LFC-defined subgroups
Subgroups were defined based on cutoff values of 3.8% (the median) and 5.5%, the threshold value of NAFLD. 3 Using the median LFC as the cutoff, subjects in the high-LFC group showed higher levels of serum triglyceride (TG) (P < 0.01) and lower levels of high-density lipoprotein cholesterol (HDL-C) (P < 0.05) than the low-LFC group. With either cutoff value, we found no differences in sex, age, BMI, waist circumference, systolic blood pressure (SBP), diastolic blood pressure (DBP), ALT, AST, alkaline phosphatase (AKP), γ-glutamyltransferase (γ-GT), total cholesterol (TC), and low-density lipoprotein cholesterol (LDL-C) between the two subgroups (Table 1).
OGTT variables in LFC-defined subgroups
Using the median LFC cutoff values of 3.8%, subjects in the high-LFC group showed higher levels of fasting insulin, C-peptide, area under the time–concentration curve for insulin (AUC-Ins), change in insulin from 0 to 30 min (ΔI 30), and HOMA-IR (all P < 0.05) than the low-LFC group. Using the higher NAFLD cutoff value of 5.5%, subjects in the high-LFC group showed significantly higher values for fasting plasma glucose (FPG), fasting insulin, C-peptide, AUC-Ins, ΔI 30 (all P < 0.05), and HOMA-IR (P < 0.01) than those in the low-LFC group. With either cutoff value, we found no differences in plasma glucose value 2 h after an OGTT (2-h PG), C-peptide concentration at 120 min (CP 120), insulin concentration at 120 min (Ins 120), area under the time–concentration curve for C-peptide (AUC-CP), changes in C-peptide from 0 to 30 min (ΔCP30), or HOMA-β between the two subgroups (Table 1).
CGM system variables in LFC-defined subgroups
Of 47 subjects who underwent 1 H-MRS and CGM evaluations, 12 subjects were excluded because of CGM data that did not meet the sensor accuracy criteria; CGM data from the remaining 35 subjects were analyzed. Among these subjects, we found the overall MBG was 5.78 ± 0.52 mmol/L, and the MAGE was 2.30 ± 1.12 mmol/L. When subgroups were defined according to the median LFC value of 3.8%, nocturnal glucose was significantly higher in the LFC ≥3.8% group (Fig. 2A). When subgroups were defined using a cutoff LFC value of 5.5% (Fig. 2B), the high-LFC group had significantly higher diurnal, nocturnal, fasting, and preprandial glucose levels than the low-LFC group (all P < 0.05), but there was no difference in 2-h PG or AUC-pp between the two subgroups (Table 1).

Subgroup analysis of continuous glucose monitoring profiles: (
CGM system variables in other subgroups
The 35 subjects with valid CGM data were also divided into two subgroups based on sex, age, and other physical and biochemical parameters such as BMI, SBP, DBP, TG, TC, HDL-C, and LDL-C. In no case were CGM profiles significantly different between subgroups based on any of these parameters. Subgroups based on these physical and biochemical parameters had similar mean values for FPG, 2-h PG, MBG, diurnal MBG, nocturnal MBG, AUC-pp, and MAGE. Subgroups defined by the median HOMA-IR value (Fig. 2C) showed that FPG, nocturnal glucose, preprandial glucose, and postprandial glucose were higher in the high-HOMA-IR group than in the low-HOMA-IR group. The pattern of glycemic parameters in these two subgroups was similar to that of groups defined using the LFC cutoff value of 5.5%.
Spearman's correlations among LFC and metabolic parameters
Spearman's correlation analysis showed that LFC was positively correlated with TG (rs = 0.329), AST (rs = 0.324), γ-GT (rs = 0.307), fasting insulin (rs = 0.414), fasting C-peptide (rs = 0.333), Ins 120 (rs = 0.333), AUC-Ins (rs = 0.451), ΔI 30 (rs = 0.431), HOMA-IR (rs = 0.360), FPG (rs = 0.350), and nocturnal MBG (rs = 0.345) (all P < 0.05). There were no correlations between LFC and sex, age, BMI, waist circumference, blood pressure, TC, LDL-C, HDL-C, ALT, AKP, 2-h PG, CP 120, AUC-CP, ΔCP30, HOMA-β, MBG, diurnal MBG, AUC-pp, and MAGE.
Stepwise regression analysis
Multiple linear stepwise regression analyses were performed in 35 subjects with valid CGM data to assess the independent effects of LFC and a subset of metabolic parameters on FPG and nocturnal MBG, which were the two glucose parameters that correlated with LFC in the univariate analysis (Table 2). The independent effects of markers were only those of any variables of LFC, sex, age, BMI, waist circumference, TG, TC, HDL-C, LDL-C, SBP, DBP, ALT, AST, AKP, γ-GT, fasting plasma insulin, fasting plasma C-peptide, OGTT 120-min insulin, OGTT 120-min C-peptide, AUC-Ins, AUC-CP, HOMA-β, and HOMA-IR that correlated with dependent effects (P < 0.05) in the univariate model. Two models were used. In Model 1, the dependent variable was FPG, and the independent variables were fasting insulin, HOMA-IR, HOMA-β, and LFC. In Model 2, the dependent variable was nocturnal MBG, and the independent variables were LDL-C, fasting insulin, HOMA-IR, and LFC. Stepwise regression analysis indicated that HOMA-IR, decreased fasting insulin level, and decreased HOMA-β were the predictive factors for FPG and that LFC was the strongest predictive factor for nocturnal MBG.
For Model 1, independent variables were fasting insulin, homeostatic model assessment of insulin resistance index (HOMA-IR), homeostatic model assessment of β-cell function (HOMA-β), and liver fat content (LFC). For Model 2, independent variables were low-density lipoprotein cholesterol, fasting insulin, HOMA-IR, and LFC.
Nocturnal MBG, mean blood glucose concentrations from 10:00 PM to 8:00 AM.
Discussion
In the present study of healthy, asymptomatic adults, we found an unexpectedly high rate (29.8%) of NAFLD based on measurements of LFC by 1 H-MRS and further demonstrated adverse glucose profiles in those individuals by 72-h CGM studies.
Although obesity is commonly associated with MS, approximately 18% of MS cases occur in nonobese individuals without diabetes, 2 and about 25% of those subjects are also insulin resistant. 22 The exact cause is still unknown; however, liver fat is closely linked with insulin resistance. 23,24 Therefore, asymptomatic individuals with NAFLD would be the ideal subjects in whom to examine the effect of liver fat on the genesis of type 2 diabetes.
Liver fat has been used to predict type 2 diabetes in previous studies. 5,6,9,12,13 Furthermore, a study in Korea found there were significant differences of fasting blood glucose between the subjects with and without NAFLD as measured by ultrasonography. 25 Previous studies were limited by the semiquantitative nature of previous estimates of LFC. Using the more sensitive and quantitative method of 1 H-MRS, we found that even slight lipid deposition in the liver could elevate the nocturnal glucose level (Fig. 2A and Table 1). LFC was the strongest predictive factor of nocturnal glucose level (Table 2). With further accumulation of liver fat, additional abnormalities in FPG, MBG, and diurnal MBG became evident (Fig. 2B and Table 1).
Altered glucose metabolism is a well-known manifestation of MS, but the relative glycemic impact of LFC compared with the biochemical abnormalities of MS is unclear. We therefore examined the individual effects of analytes that are classically disrupted in MS and found no effect on CGM profiles. LFC, it appears, contributes more to adverse glucose profiles than does any component of MS or other factors including age, sex, BMI, blood pressure, and lipid profiles.
Why might the slight accumulation of LFC be associated with adverse glucose profiles? We addressed this question by determinations of insulin sensitivity and found that high-LFC subjects had higher fasting insulin, C-peptide, and HOMA-IR values, indicative of hepatic insulin resistance. A recent study reported that lean subjects with high LFC had reduced suppression of endogenous glucose production during a hyperinsulinemic clamp, 23 which is consistent with our results. We also found that abnormalities in nocturnal MBG occurred at lower LFC values than did abnormalities in diurnal MBG. The mechanism may be that impaired nocturnal MBG results from increased LFC, which induces hepatic insulin resistance. After an overnight fast, glucose utilization is largely non–insulin-dependent. 26 Therefore, the ability of insulin to inhibit hepatic glucose production can be predicted to be a key regulator of nocturnal MBG and fasting glycemia. 27 Once the liver is fatty, the ability of insulin to inhibit hepatic glucose production is impaired, 23,28 which leads to an increase in nocturnal glucose concentration. Insulin resistance accelerates lipolysis. Excess free fatty acids deposited in the non-adipose tissue such as liver, termed “ectopic fatty deposition,” were found to increase insulin resistance. 29 Furthermore, there was a close relationship between LFC and HOMA-IR in our study. HOMA-IR, solely based on FPG and insulin concentrations, may therefore primarily be a marker of the resistance of hepatic glucose release to suppression by insulin. 27,30 We therefore speculate that modest liver fat deposition in healthy subjects could initially cause hepatic insulin resistance and then elevations in nocturnal MBG.
In the univariate analysis, we found that FPG correlated with LFC, but we failed to confirm this relationship in stepwise regression analysis. HOMA-IR, decreased fasting insulin level, and decreased HOMA-β were the predictive factors for FPG (Table 2). HOMA-IR, obtained from FPG, undoubtedly had greater effects on FPG than did LFC.
The median LFC value of 3.8% in healthy Chinese subjects in this study is higher than that found in the Dallas Heart Study, 3 which evaluated white, black, and Hispanic subjects. Hepatic steatosis varies significantly with ethnicity, and the relative lack of ethnic diversity may be a weakness of our study. The ethnic difference perhaps is a considerable factor affecting the median LFC value. Another limitation is the lack of any intervention to establish causality from elevated LFC for unfavorable glucose profiles. Other limitations include the small sample size of our study and the inexact estimates of hepatic insulin sensitivity.
The strength of this work is our use of the highly sensitive and specific absolute quantification of LFC using a noninvasive technique, 1 H-MRS, and the CGM technique providing continuous information on dynamic changes in subjects' blood glucose levels. In conclusion, slight accumulation of LFC was associated with unfavorable glucose profiles even in subjects without diabetes. To demonstrate the role that increased LFC plays in causing glucose abnormalities or overt diabetes, prospective or interventional studies are needed.
Footnotes
Acknowledgments
This work was supported by the Shanghai United Developing Technology Project of Municipal Hospitals (grant SHDC12006101) and the Science and Technology Commission of Shanghai Municipality (grants 07JC14011 and 08dj1400601 to X.G.). The authors would like to thank Dr. Jian Gao, Dan Wu, and all the involved clinicians, nurses, and technicians in the Endocrine Unit and MRI Unit, Zhongshan Hospital, Fudan University and in Shanghai Jiao Tong University Affiliated Sixth People's Hospital, Shanghai, China.
Author Disclosure Statement
There is no conflict of interest for any of the authors.