




Abstract
Background:
Continuous glucose monitoring (CGM) technologies report measurements of interstitial glucose concentration every 5 min. CGM technologies have the potential to be utilized for prediction of prospective glucose concentrations with subsequent optimization of glycemic control. This article outlines a feed-forward neural network model (NNM) utilized for real-time prediction of glucose.
Methods:
A feed-forward NNM was designed for real-time prediction of glucose in patients with diabetes implementing a prediction horizon of 75 min. Inputs to the NNM included CGM values, insulin dosages, metered glucose values, nutritional intake, lifestyle, and emotional factors. Performance of the NNM was assessed in 10 patients not included in the model training set.
Results:
The NNM had a root mean squared error of 43.9 mg/dL and a mean absolute difference percentage of 22.1. The NNM routinely overestimates hypoglycemic extremes, which can be attributed to the limited number of hypoglycemic reactions in the model training set. The model predicts 88.6% of normal glucose concentrations (>70 and <180 mg/dL), 72.6% of hyperglycemia (≥180 mg/dL), and 2.1% of hypoglycemia (≤70 mg/dL). Clarke Error Grid Analysis of model predictions indicated that 92.3% of predictions could be regarded as clinically acceptable and not leading to adverse therapeutic direction. Of these predicted values, 62.3% and 30.0% were located within Zones A and B, respectively, of the error grid.
Conclusions:
Real-time prediction of glucose via the proposed NNM may provide a means of intelligent therapeutic guidance and direction.
Introduction
Control of glucose in patients with diabetes is obtained via self-monitoring of blood glucose (SMBG) and adjustment of insulin based on these discrete sampled values. Self-monitoring limits the ability of patients to optimize glycemic control as only discrete glucose values are obtained. 11 Continuous glucose monitoring (CGM) technologies that report interstitial glucose concentration every few minutes provide an alternative to traditional self-monitoring. Real-time CGM technologies have been investigated for their potential in optimizing glycemic control in patients with diabetes. 12 –17 The frequent sampling of glucose concentration by CGM technologies provides further insight into trends in glucose when discrete SMBG values are not reported. It is important to note, however, that researchers have identified that a time lag of approximately 12.5 min exists between serum (SMBG) and interstitial glucose values obtained via CGM. 18
An NNM is an interconnected group of computer-simulated neurons that use a computational/mathematical model for information processing. NNMs are adaptive systems that adapt their structure based on external or internal (i.e., input variables) information that flows through the network. NNMs are commonly described as nonlinear modeling and/or decision-making tools. They can be applied to the modeling of complex relationships existent between input and outputs, as well as utilized for pattern recognition in data. The processing ability of the neural network is stored in inter-unit connection strengths or weights obtained by a process of adaptation or learning from a set of training patterns.
NNMs for prediction of glucose in patients with diabetes have been the subject of various investigations. A majority of these modeling approaches have utilized discrete SMBG values for prediction of glucose, which limits the ability of the model to quantify trends in glucose that are not detected via this discrete monitoring approach. 19 –22 The predictors in these NNMs included various factors such as but not limited to insulin dosages, nutritional intake, hormone levels, and exercise.
Research efforts by El-Jabali 19 were completed to develop a neural network system for prediction and control of glucose in diabetes patients. The system was configured to predict the long-term and short-term insulin requirements for maintenance of normal glucose levels. NNM inputs were discrete blood glucose measurements, insulin dosages, meals, and exercise. Results demonstrated that reliable estimation of the next glucose level and insulin needed to maintain a normal glucose concentration can be obtained.
Sandham et al. 20 proposed a recurrent NNM for prediction of SMBG values. In this modeling approach, inputs to the NNM included insulin dosages, nutritional intake, and SMBG values. Based on availability, further inputs to the NNM included exercise, stress, and illness. Performance of the NNM was assessed in two type 1 diabetes patients.
Tresp et al. 21 evaluated use of a combination compartmental model and NNM system. In this investigation, recurrent NNMs and time-series convolution neural networks were utilized to model glucose metabolism. Model development and performance analysis was completed on 63 days of data containing 463 SMBG values in a single male patient with diabetes.
Prank et al. 22 developed NNMs for learning the time course of blood glucose levels from the complex interaction of counter-regulatory (glucose-raising) hormones. In this investigation, neural network modeling was utilized to model blood glucose given activity of counter-regulatory hormones and their subsequent effect on future glycemic excursions.
The utilization of CGM technologies for predictive model development has recently become a focus of research endeavors. Models that have been developed include autoregressive (AR) models 23,24 and NNMs. 25,26 Sparacino et al. 23 demonstrated the prediction of glucose using CGM and description of past glucose data by either a first-order polynomial or a first-order AR model, both with time-varying parameters determined by weighted least squares. This research demonstrated that prediction of glucose was possible with a prediction horizon (PH) of 30 min. Reifman et al. 24 also investigated the feasibility of utilizing CGM for prediction of glucose via an AR modeling approach. It was determined that the AR models implementing PHs of 30 and 60 min were much more accurate than a 120-min AR model.
Neural network modeling provides a well-suited construct for prediction of glucose where multiple factors affect and are indicators of future glycemic trends. Given the increased utilization of CGM technologies, NNMs trained using CGM data have been the focus of recent investigation. 25,26 Previously our research group demonstrated the prediction of glucose via a time-lagged feed-forward (FF) NNM implementing PHs of 50–180 min. 25 Recently, Pérez-Gandía et al. 26 demonstrated online prediction of glucose using an FF NNM. This research group substantiated that prediction of glucose with PHs of 15, 30, and 45 min was possible. The root mean squared error (RMSE) of model predictions was reported as 9.7–29.0 mg/dL across the different PHs. Model inputs included 20 min of historical and real-time CGM data to model and predict trends in glucose concentration.
In this article we analyze performance of a NNM for real-time prediction of glucose implementing a PH of 75 min. The NNM has a different design than the models implemented our previous investigation 25 that makes it well suited for a real-time predictive application. Furthermore, the NNM predicts a complete vector of glucose values across the model PH. This harnesses the potential of CGM technology and differs with respect to the NNM proposed by Pérez-Gandía et al., 26 which was configured to predict only a discrete CGM value. The NNM performance is assessed on data from 10 patients not included in the model training set. Performance of the NNM is evaluated via Clarke Error Grid Analysis (CEGA), calculation of model error (mean absolute difference percentage [MAD%] and RMSE), and percentage of normal, hypoglycemic, and hyperglycemic extremes predicted.
Materials and Methods
Subjects and data acquisition
The patient population used in the training and evaluation of the NNM was enrolled from a private endocrine practice in Warren, OH. The only criterion for participation/inclusion in the study was insulin-dependent diabetes mellitus. Twenty-seven patients were subjected to CGM (CGMS Gold®, Medtronic, Northridge, CA). Utilization of a Pocket PC-based electronic diary facilitated documentation of insulin dosages, nutritional intake, hypoglycemic/hyperglycemic symptoms, lifestyle/activities, and emotional factors. Patients were trained on utilization of the electronic diary to prevent instances of erroneous inputs. The sensors for the CGM device were changed every 3 days in accordance with manufacturer and Food and Drug Administration recommendations for optimal accuracy.
The NNM was trained using a training set that included 23,432 vectors of CGM and electronic diary data collected in 17 patients. This model training set comprised 7.6% hypoglycemic (≤70 mg/dL), 40.8% hyperglycemic (≥180 mg/dL), and 51.6% normal (>70 and <180 mg/dL) glucose concentrations. NNM performance was evaluated using data derived from 10 patients not included in the model training set. This test dataset included 394.3 h of CGM and electronic diary data. The assessment of model performance in this dataset provides insight into the applicability of the models in a clinical or outpatient setting.
NNM architecture and development
NeuroSolutions software (NeuroDimension, Gainesville, FL) was utilized to aid in NNM model design and training. The NNM was designed with an FF architecture and consisted of a three-layer design. The input layer of the NNM was configured with 11 neurons, i.e., one neuron for each input in the NNM architecture. Inputs to the NNM included CGM data, the real-time rate of change of glucose, and data recorded using the developed electronic diary. The hidden processing layer of the NNM was designed with nine neurons. The hidden layer implemented a hyperbolic tangent (tanh) transfer function that limited the range of neural network input values to between −1 and 1. The utilization of this transfer function is integral to NNM processing as inputs are converted to a more quantifiable range. This enables the NNM to deduce trends and patterns in data more effectively.
Figure 1 includes a diagram of the FF model design. This NNM architecture was chosen because of its reduced complexity with respect to the time-lagged FF (TLFF) NNMs generated in our previous investigation. 25 The TLFF NNM architecture implemented in our previous investigation consisted of memory structures in its design that functioned to store historical input values. These memory structures enabled the quantification of patterns and trends in historical data. Processing time required for real-time training and prediction using the feed forward NNM outlined in this article is reduced with respect to the previous TLFF models. This benefits in the real-time predictive application generated in this investigation.
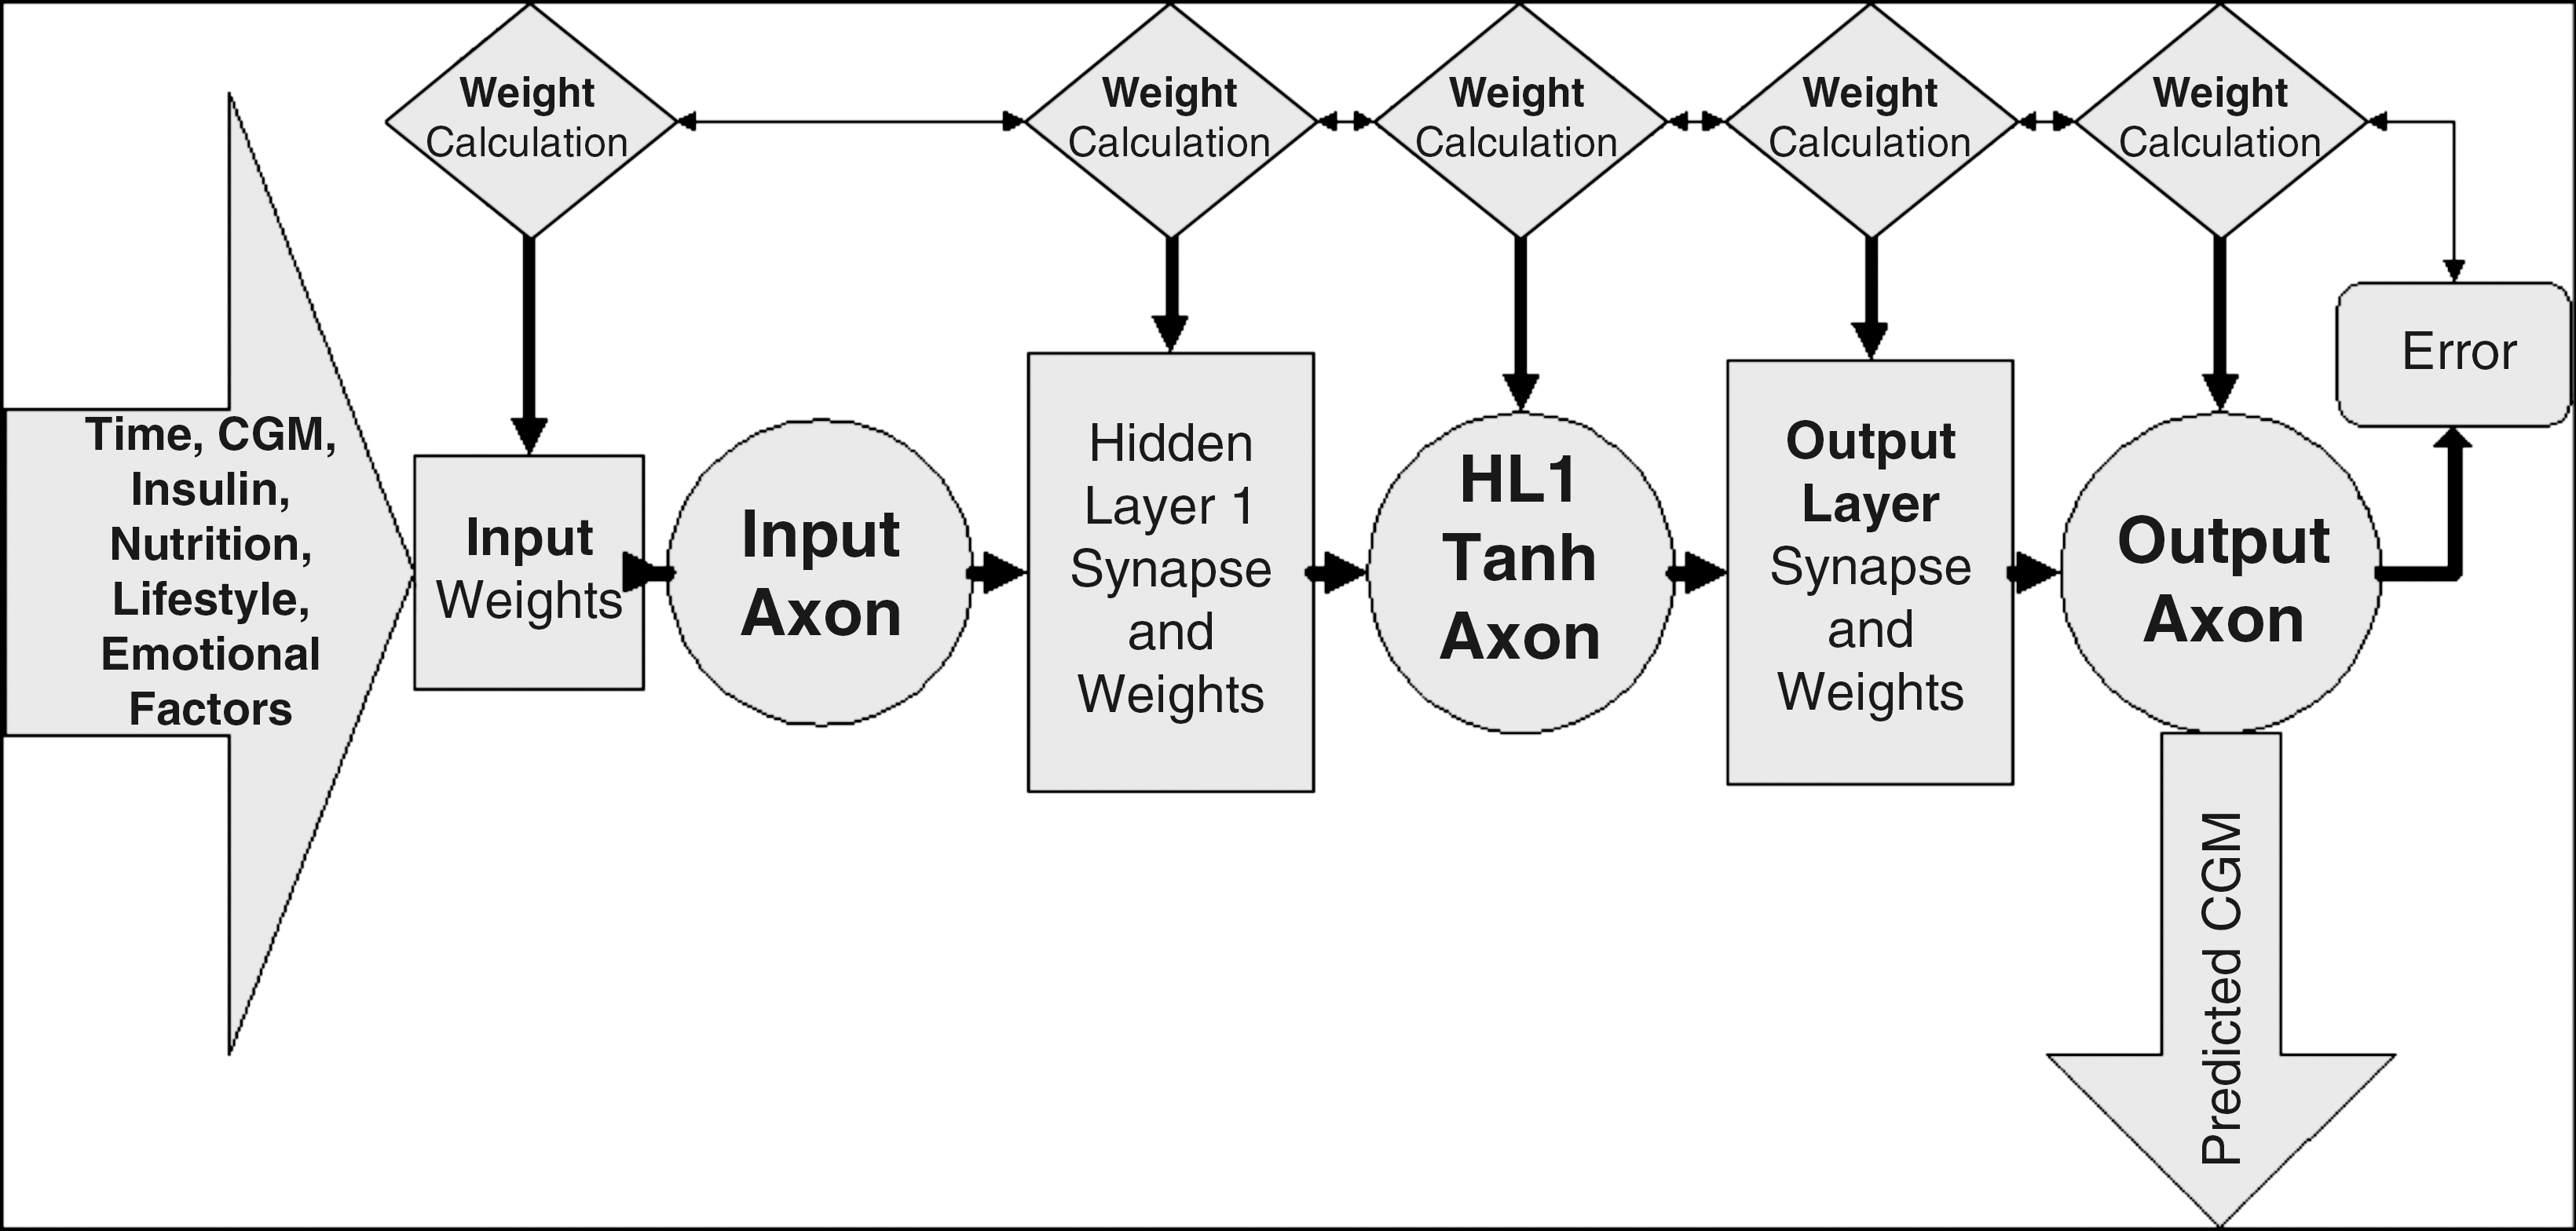
Feed-forward neural network model architecture. CGM, continuous glucose monitoring; tanh, hyperbolic tangent.
The NNM was configured for prediction of glucose implementing a PH of 75 min. A key feature of this NNM is that it is configured to predict a complete vector of 15 glucose values across the 75-min PH. The NNM was trained via the backpropagation training algorithm. In this algorithm, the error of actual and predicted glucose (implementing the 75-min PH) is backpropagated to each layer of the NNM, and optimal weights for minimization of model error are determined. Optimal model weights are determined via a gradient descent with momentum algorithm. For model training a forward and backpropagation trajectory of a single sample (i.e., exemplar) was implemented. Model weights were updated in model training after 200 exemplars were experienced. Model training was terminated after 1,000 epochs or if a mean squared error threshold of 0.01 was exceeded.
Performance analysis of the NNM
NNM functionality was integrated into a graphical user interface-based C# application for real-time training and prediction of glucose. During each iteration of the application, two files containing the NNM input data and desired glycemic responses were utilized for real-time training and prediction. These files contained 800 vectors, of which 799 included historical values and the final vector was the current real-time input data and desired glycemic responses. The desired response is unknown in real-time. To maintain real-time model training the real-time rate of change in CGM data was calculated, and the desired response implementing the 75-min PH was estimated. After ≥15 samples (i.e., number of samples in the model PH) were experienced, the current real-time CGM was placed at the appropriate index of the desired response file to replace previous estimations with actual glycemic responses. The NNM was then trained by the aforementioned methods.
The data from 10 patients not included in model training were used for model performance analysis. Model performance was evaluated on each individual patient and across the overall test dataset. The error of model predictions was determined with respect to actual CGM values via calculation of the RMSE and MAD%. Previous research demonstrated that hypoglycemic extremes were routinely overestimated via NNM model implementation because of lack of a significant quantity of hypoglycemic training data. Because of this observation, RMSE and MAD% was also calculated at non-hypoglycemic extremes. Further performance analysis included calculating the percentage of hypoglycemic (CGM ≤70 mg/dL), normal (CGM >70 and <180 mg/dL), and hyperglycemic (CGM ≥180 mg/dL) values predicted by the NNM.
CEGA of actual and predicted glucose was completed to provide an indication of the clinical acceptability of model predictions. CEGA was established in 1987 and was originally utilized to assess patient estimates of blood glucose compared to those obtained using a “gold standard” reference glucose meter. 27,28 Zone A contains predicted values within 20% of the reference concentration, and Zone B contains predictions outside 20% of the reference concentration, which would not have any adverse effect on treatment. Zones A and B therefore contain predicted values that can be classified as “clinically acceptable.” Zone C contains points that lead to unnecessary treatments, and zone D contains points indicating a potentially dangerous failure to detect hypoglycemia. Zone E contains predicted values that would confuse treatment of hypoglycemia for hyperglycemia, and vice versa.
Results
The error (MAD%) of CGM values with respect to blood glucose values in the model training set was calculated as 18.7% for 482 paired CGM and blood glucose values. For this investigation, model predictions were compared against actual CGM values reported by the CGM device. This was completed as these values were available every 5 min and provide a large dataset to gauge model performance. It is important to note, however, that error (MAD%) of model predictions with respect to 69 blood glucose values reported in the 10-patient test dataset was calculated as 22.5%.
Predictions generated via the NNM accurately follow trends in glucose across the 10 patient test dataset. Figure 2 includes the prediction of glucose in three of the 10 test patients (A, B, and C). Because of the large number of predictions generated in this test dataset, predicted glucose values were resampled to plot every 20th predicted value to better demonstrate model predictive accuracy.
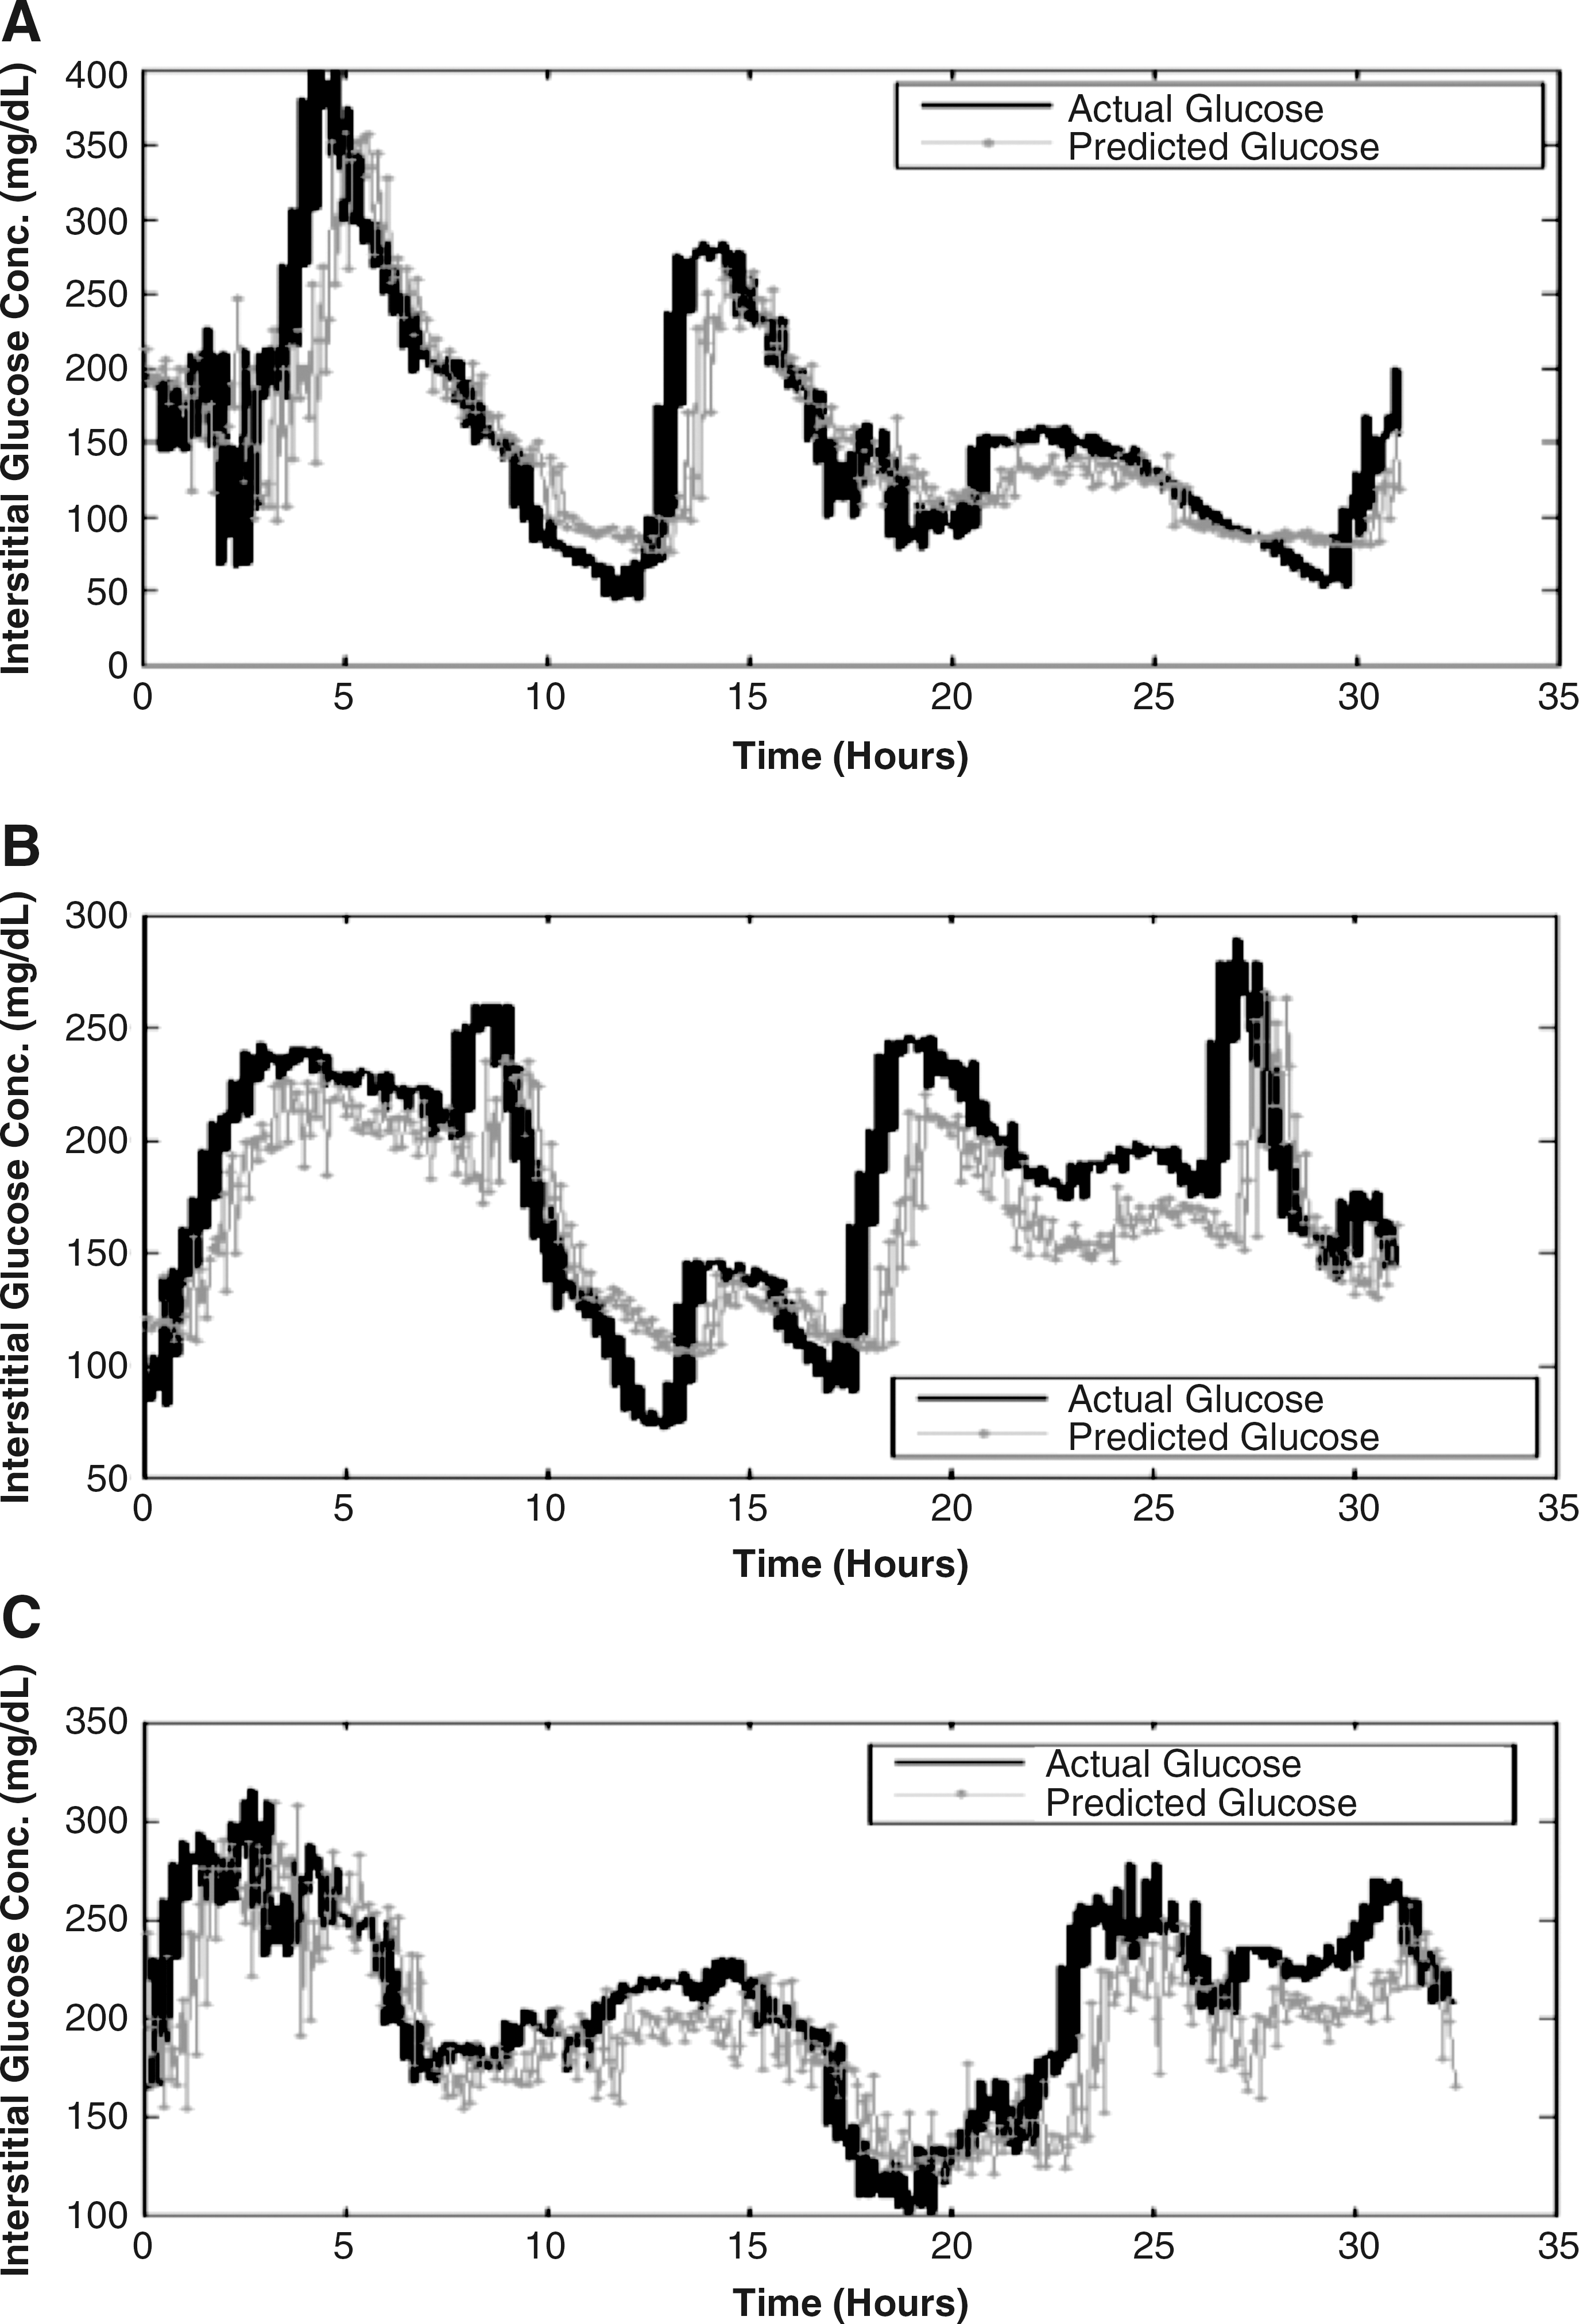
Real-time prediction of glucose in three patients.
Table 1 summarizes model performance overall and on an individual patient basis across the 15 predicted CGM values in the model PH. Average prediction error is reported as overall MAD% and RMSE. For the entire 10-patient test dataset, overall MAD% was calculated as 22.1% and at non-hypoglycemic values was 18.1%. This MAD% falls within the reported error range (14.0–21.0%) of CGM values with respect to SMBG values reported in the literature. 29 Overall RMSE ± SD (in mg/dL) for the entire 10-patient dataset was calculated as 43.9 ± 6.5 and 43.0 ± 6.4 at non-hypoglycemic extremes. The MAD% of predicted values at the model PH (t = 75 min) was calculated as 21.7%, and the RMSE was calculated as 32.4 mg/dL.
MAD%, mean absolute difference percentage; RMSE, root mean squared error.
In assessing model performance on an individual patient basis, overall MAD% ranged from 13.1% to 44.6% and from 13.1% to 27.4% at non-hypoglycemic extremes. Conversely, overall RMSE ranged from 24.1 to 57.2 mg/dL and from 24.1 to 56.2 mg/dL at non-hypoglycemic extremes. Model performance was decreased in patients 2 and 7 as these patients had significant episodes of hypoglycemia. The model routinely overestimates hypoglycemic extremes. The observed overestimation hypoglycemia is hypothesized to be correlated to the lack of a significant quantity of hypoglycemic training data. Model training set composition is highly associated with model performance. 30 The model training set with respect to quantity of hypoglycemic data contained five and seven times more hyperglycemic and normal glucose data, respectively. The overestimation of hypoglycemic extremes due to limited quantity of hypoglycemic training data was observed in our previous investigation as well. 25
Table 2 summarizes the percentage of hypoglycemic, normal, and hyperglycemic values predicted overall and on an individual patient basis. For the entire 10-patient dataset, the model predicted 2.1% of hypoglycemic, 88.6% of normal, and 72.6% of hyperglycemic values. Performance on an individual patient basis resulted in 0.0–11.1% of hypoglycemic, 64.9–94.9% of normal, and 47.1–94.1% of hyperglycemic values successfully predicted.
NA, not applicable.
Figure 3 includes a Clarke Error Grid containing model predictions. Table 3 summarizes CEGA of model predictions overall and on an individual patient basis. Overall, a majority (92.3%) of predictions could be classified as clinically acceptable as 62.3% and 30.0% of predictions fell within Zones A and B of the Clarke Error Grid, respectively. A small proportion of predictions would have lead to adverse therapeutic direction as 0.4%, 7.1%, and 0.1% of predicted values fell within Zones C, D, and E of the Clarke Error Grid.

Clarke Error Grid containing model predictions.
Discussion
The NNM outlined in this article provides a means of accurately predicting glucose concentration using data acquired from CGM devices. Real-time prediction using the proposed modeling approach is possible given the sampling rate of current CGM technologies. The predictions generated in this investigation were generated within the CGM device sampling rate of 5 min using a common PC. Given the progression of technology, utilization of the NNM in a portable device such as personal digital assistants, Pocket PCs, or smart phones for real-time training and prediction of glucose is possible.
Recently, neural network modeling was applied to real-time prediction of glucose using CGM data. 26 This modeling technique used only PHs of 15, 30, and 45 min. The model was configured to predict a single CGM value at the defined PH. Although predictions generated via this modeling approach were accurate, the chosen PHs limit the applicability of such models in a clinical or outpatient setting given the 10–15-min time lag existent between interstitial (CGM) and serum glucose concentration. 18 In actuality, incorporating the effect of this time lag, predictions generated via this modeling approach range from 5 to 30 min. The NNM generated in the current investigation was configured with a 75-min PH to mitigate effects of this time lag and increase therapeutic benefit by generating predictions of glycemic trends of approximately 60 min.
The NNM used by Pérez-Gandía et al. 26 had average prediction errors (RMSE) of 9.7, 17.5, and 25.1 for PHs of 15, 30, and 45 min, respectively. Linear regression of their model performance indicates a 75-min PH should yield a RMSE of approximately 40.5 mg/dL. The average prediction error obtained in this investigation across the 10 patient test dataset was 43.9 ± 6.5 mg/dL and 43.0 ± 6.4 mg/dL at non-hypoglycemic values. To compare our NNM performance with the NNM generated by Pérez-Gandía et al., 26 prediction error was calculated for the discrete predicted glucose value at the model PH. The RMSE at the model PH was calculated as 32.4 mg/dL. This error is less than the expected value of 40.5 mg/dL, which indicates the performance of the NNM reviewed in this article is greater or comparable to that of previously developed modeling techniques. 23,26
The proposed NNM predicted a majority of normal and hyperglycemic extremes (88.6% and 72.6%, respectively). The model routinely overestimates hypoglycemic extremes, which is attributed to the lack of a significant quantity of hypoglycemic training data. CEGA of model predictions indicated that a majority of predicted values (92.3%) could be regarded as clinically acceptable and not lead to adverse therapeutic direction. A majority of these predicted values (62.3%) were contained within Zone A of the Clarke Error Grid, which corresponds to predicted values within 20.0% of the reference CGM value. The prediction of a complete vector of glucose values up through the length of the model PH is a unique approach and has not been implemented in modeling techniques to date. The prediction of this vector of values will allow for assessment of trends in future glycemic excursions, which may provide a means of further optimizing therapy.
Currently, we are investigating alternative NNM architectures for enhancement of model performance. The implementation of TLFF NNMs for real-time prediction of glucose is ongoing. The utilization of additional inputs to the NNM such as historical CGM values that have been integrated in recent modeling techniques also warrants investigation. 26 The effect of various factors on future glycemic excursions may be patient specific; therefore, the development of patient-specific NNMs (i.e., models trained with data from a single patient) will be the subject of future investigation. Additional data acquisition is ongoing such that a more elaborate training set containing additional hypoglycemic, normal, and hyperglycemic extremes can be obtained. Models generated with this improved training set should have increased performance.
Conclusions
The NNM generated in this investigation provides a unique approach for real-time prediction of glucose. Because of the known effects of many factors on glucose concentration, we used a wide variety of inputs not included in architecture of prior models. Inputs to the NNM included time, SMBG values, nutritional intake, insulin dosages, lifestyle/activities, hypoglycemic/hyperglycemic symptoms, and emotional factors. Implementation of a significant model PH of 75 min further distinguishes our modeling approach from models previously reported. Finally, prediction of a complete vector of glucose values across the entire model PH rather than a single discrete glucose value is a unique feature to improve performance of this model compared to previous models.
In its current state, model accuracy is significant, and predictions may provide therapeutic benefit. Further enhancement of model performance may lead quickly to its clinical use for intelligent therapeutic direction, guidance, and ultimately automation of glucose control.
Footnotes
Author Disclosure Statement
P.M.R. is the owner of a company, Life Event Diary, LLC (Beachwood, OH), that markets tools related to diabetes self-management. S.M.P., B.D.C., R.E.B., T.J.P., W.O., and M.J.B. declare no conflicts of interest exist.