
Abstract
Background:
This study is aimed at developing and evaluating a diabetes risk score (DRS) to predict incident diabetes and screen for undiagnosed diabetes and abnormal glucose tolerance in the Chinese population.
Methods:
Three DRS instruments were respectively developed and validated based on the data collected from a 10-year longitudinal health checkup-based population of 1,851 individuals without diabetes at baseline. The efficiency on glucose abnormality screening was evaluated based on the testing of a cross-sectional sample of 699 individuals without known diabetes.
Results:
The DRS consisting of age, hypertension, history of high blood glucose, body mass index, fasting plasma glucose, serum triglycerides, and serum high-density lipoprotein-cholesterol had the best prediction properties (area under curve [AUC] = 0.734 [95% confidence interval 0.702–0.766] and 0.759 [0.686–0.831] in exploratory and validation cohorts, respectively). The DRS had a sensitivity of 64.5% and 72.9%, respectively, and a specificity of 71.6% and 63.9%, respectively, with an optimal cutoff of 4. AUCs were 0.828 (0.797–0.860) and 0.909 (0.884–0.933) for detecting abnormal glucose tolerance and diabetes, respectively, through cross-sectional screening. Performance of the oral glucose tolerance test (OGTT) in selected subjects with DRS ≥4 led to the identification of 76.2% cases of abnormal glucose tolerance and 100% cases of diabetes, while avoiding an OGTT in 52.8% of the study group.
Conclusions:
The DRS instrument including age, hypertension, history of high blood glucose, body mass index, fasting plasma glucose, triglycerides, and high-density lipoprotein-cholesterol is practical and effective in predicting incident diabetes and screening glucose abnormality in the Chinese population.
Introduction
During the past decade, several DRS instruments have been developed based on major risk factors. Most of them were derived from cross-sectional data, 10 –13 but a few were derived from a longitudinal study design in which incidents rather than prevalent cases were used. In the Asian population, only three DRS instruments derived from a longitudinal study have been developed to predict absolute diabetes risk. One was carried out in Thailand; 14 the other two risk scores were developed in Taiwan. 15,16 However, there is no DRS from longitudinal data in mainland China so far. Some studies proved that these risk scores yielded low accuracy when applied to another population becasue of the differences in population characteristics. 12 Thus ethnicity-specific diabetes risk score was recommended by the International Diabetes Federation. 17
In the present study, our aim is to develop an accurate DRS identifying individuals in mainland China who are likely to develop diabetes in the near future. It is based on the data from a cohort with a 10-year follow-up. A second aim is to evaluate the efficiency of DRS as an initial tool in a two-step strategy for identifying individuals at high risk for diabetes in a cross-sectional screening for abnormal glucose tolerance and diabetes.
Subjects and Methods
Study subjects and measurements
Cohort study
Data were taken from a longitudinal health checkup-based population database in our hospital screening center, which provides periodic health examinations to military officers living in Beijing, China. The records from the database can be open for academic researchers upon request. After eliminating those who failed to follow-up and those with limited information of key variables, 1,851 (1,710 men and 141 women) mainly in the age range 40–90 years were enrolled. The exploratory cohort included 1,457 individuals without diabetes 48–87 years old, recruited in 1996. The validation cohort included 394 individuals without diabetes 43–88 years old, recruited between 1997 and 1998.
At baseline, information was collected from the subjects of the two cohorts, which included the history of previous diseases, current weight, height, and blood pressure. Body mass index (BMI) was calculated by dividing the weight (kg) by the height squared (m2). In order to do glucose and lipid tests, blood samples were obtained after a 12-h overnight fast. Subsequently, an OGTT was performed 2 h after the ingestion of a standard 75-g glucose load. Blood glucose level was analyzed through a glucose oxidase method, and serum lipids were measured through an enzymatic calorimetric assay. For both cohorts, follow-up health interviews and examination surveys were performed after 10 years.
Hypertension was defined as blood pressure ≥140/90 mm Hg or history of hypertension medication. History of high blood glucose was referred to diabetes or latent diabetes. Both hypertension and high blood glucose were once discovered by a healthcare professional but has not yet been confirmed. BMI was classified based on the Chinese criteria: normal, <24.0 kg/m2; overweight, 24.0 kg/m2 ≤ BMI <28.0 kg/m2; obese, BMI ≥ 28.0 kg/m2. High fasting plasma glucose (FPG) was defined as FPG ≥ 100 mg/dL (5.6 mmol/L). High serum triglyceride (TG) was defined as TG ≥ 1.7 mmol/L. Low serum high-density lipoprotein-cholesterol (HDL-C) was defined as HDL-C <0.9 mmol/L in men or HDL-C <1.0 mmol/L in women. Diabetes was diagnosed according to the American Diabetes Association criteria as FPG ≥ 126 mg/dL (7.0 mmol/L) or OGTT ≥200 mg/dL (11.1 mmol/L). 18 Incident diabetes was ascertained from multiple sources: self-report, FPG and OGTT results, and data on prescribing of hypoglycemic medication at the follow-up survey.
Cross-sectional study
Evaluation of DRS was performed in a cross-sectional, population-based survey. A total of 699 subjects (25–85 years old) without previous history of diabetes were invited to a questionnaire and health examination that included OGTT. They also are military officers with similar characteristics as the subjects of the two cohorts.
Statistical analyses
DRS development and validation
Analyses were performed using SPSS version 12.0 (SPSS, Inc., Chicago, IL). The potential risk factors for incident diabetes are age (categorized into three groups: ≤65, 66–75, and ≥76 years), sex, hypertension, history of high blood glucose, coronary artery disease (CAD), BMI (normal, overweight, and obese), higher FPG, higher serum TG, and lower serum HDL-C. In the exploratory cohort, three models were developed by multivariable stepwise logistic regression to estimate mutually adjusted odds ratios (ORs) for incident diabetes. Model 1 included clinical information. Model 2 was created by adding the parameter of higher FPG based on Model 1. Model 3 included the additional parameters of higher serum TG and lower serum HDL-C to Model 2. Thus, three DRS instruments were produced, and points were assigned to each variable based on the magnitude of the regression coefficiency as follows: a value of 1 for a significant multivariate OR between 1.1 and 1.9, a value of 2 for an OR between 2.0 and 2.9, and a value of 3 for an OR ≥ 3. 19 The lowest category of each variable was given a score of 0. For each risk score, a receiver operating characteristic (ROC) curve was plotted, and the area under curve (AUC) was calculated. The performance of the risk scores was also evaluated in the validation cohort as in the exploratory cohort. The AUC was used to identify the accuracy of the risk scores through comparing the risk score of a subject with incident diabetes to a subject without. The larger the AUC, the better the performance of the DRS. The DRS with the largest AUC was chosen as the final DRS. Then, sensitivity, specificity, positive predictive values (PPVs), and negative predictive values (NPVs) were calculated for the cutoff score that gave the maximum sum of sensitivity and specificity.
Evaluation of DRS on screening of individuals with glucose abnormality
The final DRS was used for the cross-sectional sample and the calculation of the sum of scores for each subject. ROC curves were performed to assess the accuracy of the risk score in discriminating subjects with and without undiagnosed diabetes or abnormal glucose tolerance. Sensitivity and specificity were calculated for the cutoffs obtained from our study. Undiagnosed diabetes and abnormal glucose tolerance were identified through a screening strategy that consisted of two steps: the first was the random screening for high-risk subjects using the risk score, and the second was the additional testing with the OGTT for selected subjects at increased risk for diabetes.
Results
DRS development and validation
Table 1 showed the baseline clinical and laboratory characteristics of subjects with and without incident diabetes in the exploratory and validation cohorts. The mean age of the participants was 70.5 ± 7.1 years (≤65 years, 33%; 66–75 years, 48%; ≥76 years, 19%). A total of 92.4% of participants were men, and 13.8% of participants had BMI ≥28 kg/m2. Of the 1,457 subjects without diabetes at baseline in the exploratory cohort, 304 (20.9%) experienced incident diabetes in the 10 years of follow-up. In the validation cohort, 48 (12.2%) subjects developed diabetes from a total of 394 subjects who had no diabetes at baseline. For both cohorts, participants who developed incident diabetes also tended to have a higher prevalence of history of high blood glucose, increased BMI, blood pressure, FPG, and TG.
Data are percentages or mean ± SD values.
P values for continuous outcomes are based on a t test and χ 2 test for categorical variables: *P < 0.05 compared with the group without incident diabetes.
BMI, body mass index; CAD, coronary artery disease; DBP, diastolic blood pressure; FPG, fasting plasma glucose; HDL-C, high-density lipoprotein-cholesterol; SBP, systolic blood pressure; TC, total cholesterol; TG, triglycerides.
Three models for incident diabetes were produced in the exploratory cohort based on whether adding simple clinical variables or only FPG or lipids (Table 2). In Model 1, with only clinical variables, the AUC was 0.684 (95% confidence interval 0.649–0.720). Inclusion of FPG (Model 2) in Model 1 slightly improved the accuracy of the prediction: the AUC increased to 0.711 (0.676–0.745). In Model 3, inclusion of FPG, TG, and HDL-C in Model 1 had the largest AUC (0.722 [0.689–0.756]). The three risk scores (DRS1–3) were produced based on the regression coefficients of the models. The AUCs were almost identical to those in the corresponding model. The ROC curves (Fig. 1) indicated that DRS3 has the best prediction property with the largest AUC (0.734 [0.702–0.766] and 0.759 [0.686–0.831]) in the exploratory and validation cohorts, respectively. Therefore, the DRS3 was chosen as the final DRS, termed the Chinese CDRS (CDRS), which consisted of age, hypertension, history of high blood glucose, BMI, FPG, TG, and HDL-C. The total score value ranged from 0 to 12. The cutoff score of 4 was optimum. The respective sensitivity was 64.5% and 72.9%, specificity was 71.6% and 63.9%, PPV was 37.7% and 21.9%, and NPV was 88.6% and 94.4% in the two cohorts separately.

Receiver operating characteristic curves showing the performance of each diabetes risk score (DRS) in predicting incident diabetes in the exploratory and validation cohorts. The 95% confidence interval is given in parentheses. AUC, area under the curve.
Data are odds ratios (95% confidence interval).
The score values are estimated based on the β-coefficients of each logistic regression model.
AUC, area under the curve; BMI, body mass index; HDL-C, high-density lipoprotein-cholesterol.
Evaluation of DRS on screening of individuals with glucose abnormality
The cross-sectional study population characteristics are reported in Table 3. Overall, 43.3% of the subjects showed some form of glucose metabolism alteration: 31.9% of the subjects had impaired glucose tolerance, and 11.4% had diabetes. Table 3 showed that there were significant differences with respect to age, history of hypertension, CAD, high blood glucose, BMI, blood pressure, FPG, and lipids among the three groups (P < 0.05). Mean CDRS values showed a marked variation according to glucose metabolism categories (P < 0.001).
Data are percentages or mean ± SD values.
*P < 0.05 compared with the normal glucose tolerance (NGT) group; # P < 0.05 compared with the impaired glucose tolerance (IGT) group.
BMI, body mass index; CAD, coronary artery disease; CDRS, Chinese Diabetes Risk Score; DBP, diastolic blood pressure; DM, diabetes mellitus; FPG, fasting plasma glucose; HDL-C, high-density lipoprotein-cholesterol; SBP, systolic blood pressure; TC, total cholesterol; TG, triglycerides.
ROC curves (Fig. 2) showed AUCs of the CDRS in screening abnormal glucose tolerance and diabetes were, respectively, 0.828 (0.797–0.860) and 0.909 (0.884–0.933). With a cutoff of 4, the sensitivity of CDRS in detecting individuals with abnormal glucose tolerance and diabetes was 76.2% and 100%, respectively, whereas the respective specificity was 69.5% and 59.6%. The two-step strategy led to the identification of 76.2% of cases of abnormal glucose tolerance and 100% of cases of unknown diabetes, whereas only requiring an OGTT in 47.2% of the study group.
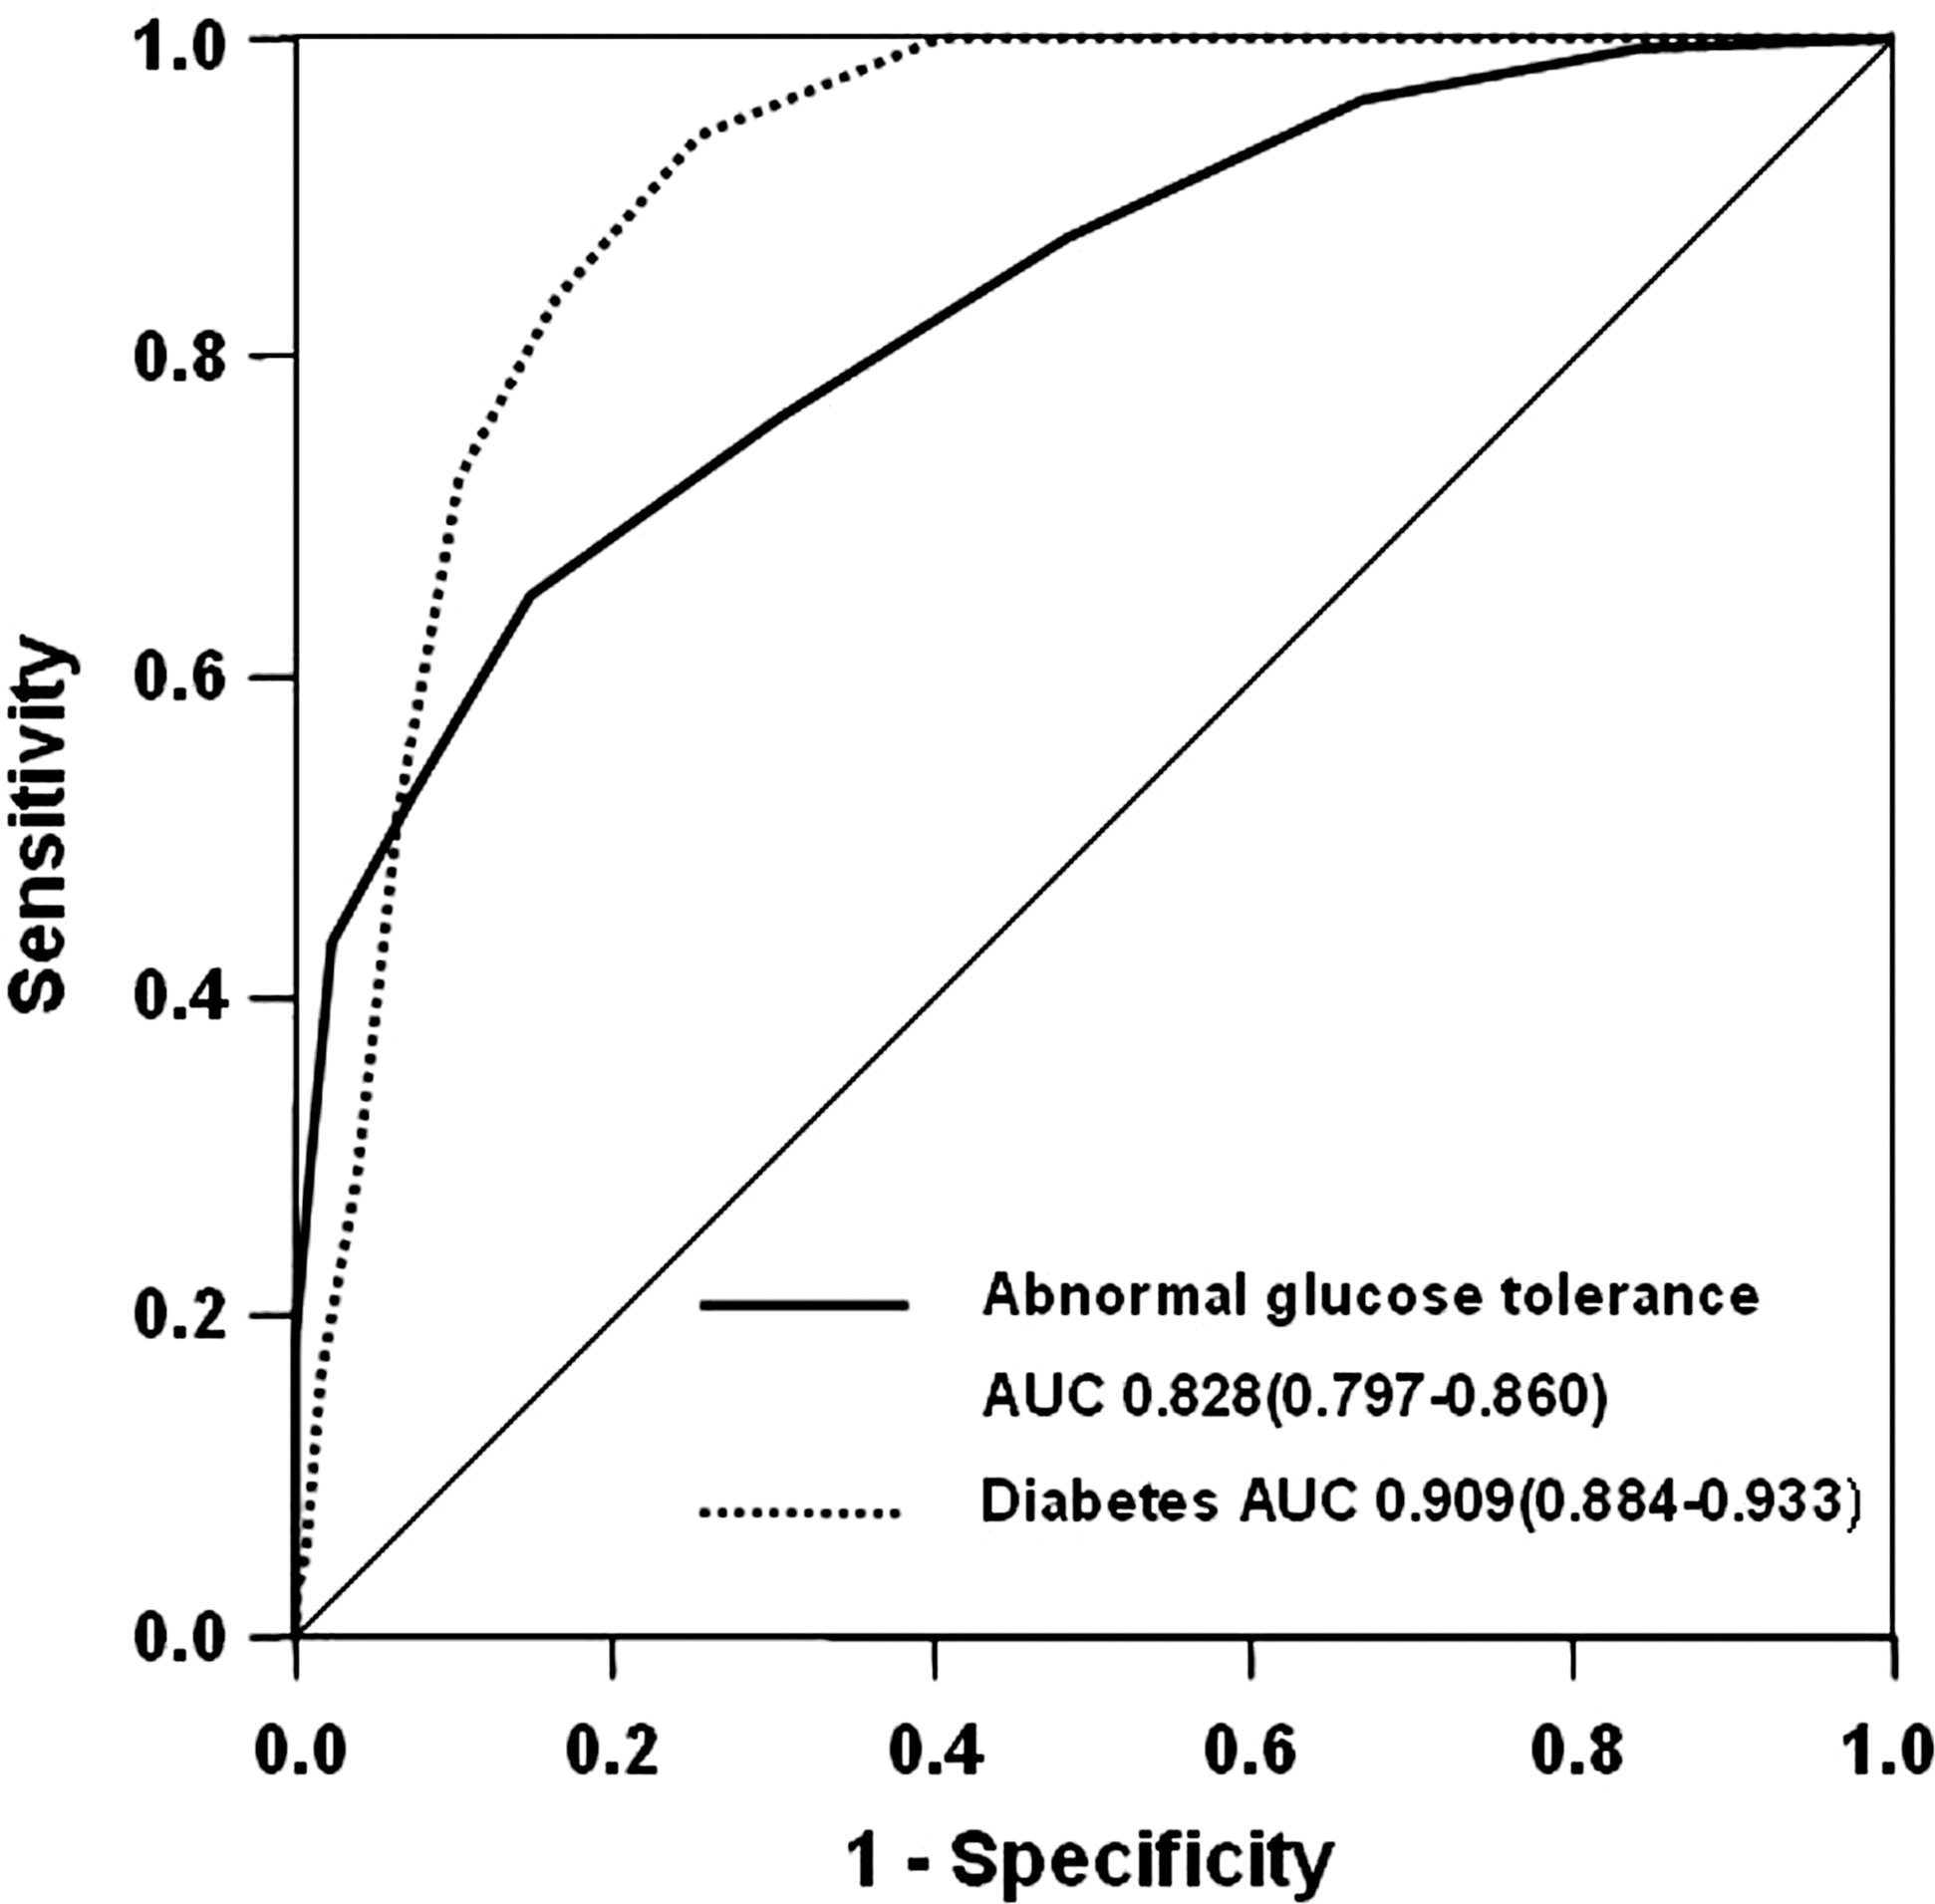
Receiver operating characteristic curves showing the performance of the Chinese Diabetes Risk Score in screening for abnormal glucose tolerance and diabetes in the cross-sectional sample. The 95% confidence interval is given in parentheses. AUC, area under the curve.
Discussion
The DRS, an effective and practical screening tool, has been recommended for use in diabetes screening. It could enhance people's awareness, leading to lifestyle modifications in the general population. Through the DRS, the identified high-risk individuals will benefit from receiving healthcare education and having the opportunity to engage in healthy lifestyles at an early stage so as to prevent or delay the onset of type 2 diabetes. Some DRS instruments, derived from a cross-sectional study, identify subjects with current diabetes; 10 –13 other scores derived from a longitudinal study predict the absolute diabetes risk. 14 –16,19,21,22 Most of the latter have been developed among whites. 21,22 There is no DRS developed to predict who will get incident diabetes in mainland China. The risk scores based on one population might not be appropriate for another population because of the differences in population characteristics. 23 There are limitations in applications of the risk functions. Therefore, we developed a practical risk score predicting incident diabetes based on the population of mainland China.
In the present study, some variables such as age, hypertension, history of high blood glucose, CAD, BMI, FPG, TG, and HDL-C have been considered as risk factors after referring to previous prediction models. 16,24 –26 It is well known that FPG, TG, and HDL-C are the most important biochemical risk factors for diabetes and are frequently used in other DRS instruments. They are included in our predictive models because they are easy to check in most healthcare settings in China; therefore the DRS can be easily used in clinical practice. Considering convenience, we did not include extensive biomarker data in the models. Adding other biomarkers, such as insulin resistance, may improve the discriminatory ability. However, these variables are more difficult to measure and to interpret in clinical practice. Finally, three DRS instruments were developed by logistic stepwise regression: DRS1 contains simple clinical information, whereas DRS2 adds FPG based on DRS1, and DRS3 adds TG and HDL-C based on DRS2. The results of ROC curves showed DRS3, including clinical information, FPG, TG, and HDL-C, had the best prediction properties in both the exploratory and validation cohorts. It demonstrated that inclusion of more significant variables such as biochemical tests in the scoring system may lead to higher accuracy in predictions. This was also illustrated in the Thailand study 14 and the KORA 2000 study. 27 The Thailand study showed that the DRS, combining clinical information with FPG, an influential predictor, increased the predictive ability of incident diabetes when compared with a simple risk score that only included clinical information. 14 In the KORA 2000 study, 27 four DRS instruments, respectively, from the Rotterdam Diabetes Study, the Cambridge Risk Score, the San Antonio Heart Study, and the FINRISK study (FINDRISC) were evaluated and compared in a cross-sectional setting. ROC curves shows that the AUCs were, respectively, 61% (56–66%), 65% (60–69%), and 67% (62–72%) for the Rotterdam Diabetes Study, the FINDRISC, and the Cambridge Risk Scores, all of which only included clinical information; a predictive model including FPG from the San Antonio Heart Study yielded an AUC of 90%. It demonstrated that the inclusion of blood test data might increase the predictive ability of DRS, although it is more complicated and costly. We think the data are available in most primary healthcare settings in mainland China and should be involved in the scoring system for better predictive performance. After considering of all the above, we chose DRS3 as the final DRS, termed the CDRS, having not only convenience in routine execution but also having a good predictive property.
In China, there were few studies exploring DRS used to screen diabetes in the population. A recent DRS in Taiwan that combined clinical information with FPG had a sensitivity of 72.26–76.64% and a specificity of 76.00–82.84% for predicting incident diabetes. 15 However, this risk score only can be obtained by a complicated formula, which is difficult to perform in general practice. Another DRS in Taiwan including age (4 points), elevated fasting glucose (11 points), BMI (8 points), TG (5 points), white blood cell count (4 points), and a higher HDL-C (−4 points) was found to strongly predict diabetes incidences in multivariate models. 16 The estimated AUC for the model was 0.702 (95% confidence interval 0.676–0.727). It is also inconvenient and impractical for use in the general population because of too many points. Moreover, it is well known that Taiwan is different from mainland China in terms of diet, lifestyle, and social environment. Therefore, it is necessary to develop a simple risk score based on the population of mainland China. Our CDRS is only composed of seven simple questions, and people can evaluate their risk of incident diabetes through simple calculation. The CDRS includes age, hypertension, history of high blood glucose, BMI, FPG, TG, and HDL-C. Incident diabetes can be predicted through CDRS that has a sensitivity of 64.5–72.9% and a specificity of 71.6–63.9%, which is similar to the DRS instruments developed among other populations. The FINDRISC includes age, BMI, waist circumference, history of antihypertensive drug treatment, high blood glucose, physical activity, and daily consumption of fruits, berries, or vegetables without blood data. Drug-treated diabetes can be predicted through FINDRISC, which has a sensitivity of 78–81%, a specificity of 76–77%, and a cutoff of 9. For convenience and low cost, the Thailand DRS is derived from a simple model without laboratory tests, including age, sex, BMI, waist circumference, history of hypertension, and history of diabetes in parents or siblings. It produces a sensitivity of 77% and a specificity of 60% with a cutoff score of 6. 14 Using age, BMI, FPG, HDL-C, family history, and hypertension status, von Eckardstein et al. 24 developed a model (PROCAM) with an AUC of 79.3% to predict the incidence of diabetes during the 6.3-year follow-up in the German population. In addition, Stern et al. 25 set up the San Antonio model to predict diabetes risk in Mexican Americans and non-Hispanic whites during a 7.5-year follow-up period; the San Antonio model included biomarkers such as FPG, blood pressure, and HDL-C, in addition to age, sex, obesity, and family history of diabetes, with an AUC of 84.3%. Recently, Wilson et al. 26 developed a simple points diabetes-prediction model with an AUC of 85% for the Framingham Offspring Study; this model included FPG, BMI, HDL-C, family history of diabetes, TG, and hypertension. It also showed that most of the variables included in these models were similar to those in the CDRS.
Among the risk factors of the CDRS, history of high blood glucose and high FPG with a high regression coefficient play a substantial role in the development of incident diabetes, according to FINDRISC 20 and the National Health and Nutrition Examination Study III. 19 This phenomenon suggests that transient hyperglycemia may be an independent predictor of type 2 diabetes, which was demonstrated in previous studies. 28,29 It is well established that obesity is an important risk factor for type 2 diabetes as demonstrated through the results that BMI contributes strongly to the CDRS. This is in agreement with previous studies 14,20 –22 on DRS instruments. Besides, in our models, the higher serum TG and lower serum HDL-C, which are components of the metabolic syndrome and are related to the development of type 2 diabetes, obviously increase the probability to predict diabetes.
Finally, we validated the feasibility of the CDRS as a screening tool for abnormal glucose tolerance and undetected diabetes in a population-based, cross-sectional setting. In addition it also tested the efficiency of a two-step strategy using CDRS ≥4 as the initial screening instrument to identify high-risk individuals, followed by the execution of OGTT. The AUCs were 0.828 (0.797–0.860) and 0.909 (0.884–0.933) for detecting abnormal glucose tolerance and undiagnosed diabetes, respectively. With the optimal cutoff level, the CDRS had a sensitivity of 76.2% for abnormal glucose tolerance and 100% for undiagnosed diabetes, which is more sensitive in comparison with other risk scores. The study of Saaristo et al. 30 showed that using a cutoff risk score of 11, the sensitivity of FINDRISC to identify undiagnosed diabetes was 66% in men and 70% in women; the corresponding false-positive rates were 31% and 39%, respectively, in a cross-sectional, population-based survey. In the IIGLOO study, with a cutoff of 9, the sensitivity of FINDRISC in detecting individuals with diabetes was 86%, whereas the specificity was 41% (AUC = 0.72 [0.68–0.76]). 31 It seemed that the yield of our CDRS would be better than FINDRISC in cross-sectional screening for diabetes. Subjects with impaired glucose regulation are at high risk of diabetes. A screening tool should therefore be able to identify not only diabetes but also milder forms of glucose abnormalities. Our study showed that, depending on the cutoff point, CDRS could identify abnormal glucose tolerance efficiently as well. To be used as an initial screening tool, an instrument should have sufficient sensitivity to avoid too many patients being classified as normal, despite the presence of the disease. The CDRS with high sensitivity can be particularly useful as an initial instrument for opportunistic screening in the general population. All diabetes patients and 76.2% patients having abnormal glucose tolerance were identified while using the CDRS as an initial screening tool of the two-step strategy, while reducing the number of those needing an OGTT.
To our knowledge, this is the first diabetes prediction risk score specifically developed in mainland China. Because of the large sample size, the estimates from our prediction models were found to be stable, as demonstrated by the internal validation study. However, several potential limitations of this study should be mentioned. First of all, it is a pity that the scoring system does not include a history of diabetes in parents or sibling and data on lifestyle, because of the lack of related information in the database. Second, because subjects are mostly from the middle- and older-aged groups, because of limitations in the database, our model may be less practical for young populations. In the future, the usefulness of this risk score needs to be investigated across the country, and more information should be obtained to develop a better DRS.
The present study provides a risk score including clinical information combined with biochemical indexes based on the mainland Chinese population. We believe that the public health implications of the CDRS are important in increasing awareness of risk factors and having a healthy lifestyle. It has an excellent predictive ability for incident diabetes and is a sensitive and practical screening tool for identifying high-risk subjects with diabetes in the general population. OGTTs performed in people with a high score would ensure identification of unrecognized, asymptomatic diabetes and abnormal glucose tolerance, while reducing the number of OGTT executions.
Footnotes
Author Disclosure Statement
No competing financial interests exist.