
Abstract
Background:
The mean amplitude of glycemic excursions (MAGE), traditionally estimated with a graphical approach, is often used to characterize glycemic variability. Here, we tested a proposed software program for calculating MAGE.
Methods:
Development and testing of the software was based on retrospective analyses of 72-h continuous glucose monitoring profile data collected during two different clinical studies involving 474 outpatients (458 with type 2 and 16 with type 1 diabetes) in three cohorts (two type 2 diabetes and one type 1 diabetes), using the CGMS® Gold™ (Medtronic MiniMed, Northridge, CA). Correlation analyses and a Bland–Altman procedure were used to compare the results of MAGE calculations performed using the developed computer program (MAGEC) and the original method (MAGEO).
Results:
Close linear correlations between MAGEC and MAGEO were documented in the two type 2 and the type 1 diabetes cohorts (r = 0.954, 0.962, and 0.951, respectively; P < 0.00001 for all), as was the absence of any systematic error between the two calculation methods. Comparison of the two indices revealed no within-group differences but did show differences among the various antihyperglycemic treatments (P < 0.0001). In each of the study cohorts, MAGEC correlated strongly with the SD (r = 0.914–0.943), moderately with the mean of daily differences (r = 0.688–0.757), and weakly with glycosylated hemoglobin A1c and mean sensor glucose (r = 0.285 and r = 0.473, respectively).
Conclusions:
The proposed computerized calculation of MAGE is a practicable method that may provide an efficient tool for assessing glycemic variability.
Introduction
The MAGE index, first described by Service et al. 10 and Service and Nelson, 11 selects the major glucose swings and represents the arithmetic mean of the difference between consecutive increases or decreases exceeding 1 SD around the respective mean 24-h glucose value. Although the qualifying limit of 1 SD is reasonable, when compared with glucose excursion in healthy individuals it is arbitrary. Minor inaccuracies may thus substantially affect outcomes. Furthermore, unrealistic MAGE readings will result if only one major upward or downward stroke occurs during the two consecutive 24-h periods traditionally used for evaluation. 10 In keeping with the original definition, most users have applied a graphical approach to estimate MAGE, which is operator-dependent and time-consuming for analyses of continuous glucose monitoring (CGM) data from large numbers of patients. To allow automated analysis of CGM data and to avoid the imprecision associated with the original approach for MAGE assessment in clinical practice, a computer program is needed for patient-independent, standardized computation. To address this need, we have developed user-friendly computer software for calculation of the MAGE index.
In this report, we describe the computer program and its practical application in three cohorts of diabetes outpatients who had undergone CGM measurements and validate our approach by comparing the MAGE values obtained with our software and with the original calculation method. We then analyze the relationships between the software-calculated MAGE and other measures of glycemic variability and average glycemia, such as SD, the mean of daily differences (MODD), A1C, and mean sensor glucose (Mean SG).
Research Design and Methods
We developed the software program for MAGE calculation using CGM profile data previously collected during clinical studies. The datasets were analyzed using MiniMed Solution Software (Medtronic MiniMed, Northridge, CA). Only profiles with more than four glucometer calibrations per day and ≥50 h per patient of continuous monitoring were downloaded and considered for calculation of MAGE.
Software program development
Development of the program consisted of the following modules: (1) import of CGM data; (2) graphical display of glucose values; (3) analysis of glucose profiles including determination of SD and glucose peaks and nadirs, selecting the extremes above and below the 1 SD level, and calculating the MAGE; and (4) display of the calculated parameters. An object-oriented development tool was used for programming computation of MAGE from automatically entered glucose readings. The program was developed using Delphi 6 (Borland Software, Austin, TX) as the software development environment, and specified task modules were generated for each computational step. The present software can process CGM data for up to three consecutive 24-h periods, and the following version for up to seven consecutive 24-h periods and longer, with the starting day being freely selectable from the CGM data pool but the starting time point set by the data transmitted.
Computation algorithm
The computation is based on an approximation algorithm. CGM datasets with glucose updates at 5-min intervals over 72-h periods were used. Glucose updates at intervals >5 min can also be used. It should be noted that the answer for MAGE is affected by the length of observation intervals, such that the deviation for 15-, 30-, or 60-min intervals compared with the 5-min values is 0.54 ± 1.49 (P = 0.685), 3.78 ± 2.56 (P = 0.151), and 4.86 ± 2.37 (P = 0.046) (mg/dL, mean ± SE), respectively. These results were obtained on a random sample of complete CGM datasets (n = 30). The software MAGE calculation includes the following main steps: (1) determination of all local maximum (max) values and minimum (min) values; (2) evaluation of the max–min pairs with the 1 SD criterion; (3) determination of whether the difference in max–min exceeds 1 SD, which enters the value into the ongoing calculation or, if it does not, indicates that it is to be disregarded; and (4) initiation of a new evaluation cycle. Note that values are used for MAGE calculation only if both edges, i.e., segments, of the glucose excursion exceed 1 SD. According to the statement by Service et al.
10
that the direction of calculation is established by the direction of the first excursion (peak-to-nadir or nadir-to-peak) and MAGE be calculated using the criterion that both segments of the amplitude of glycemic excursions (AGE) exceed 1 SD, the calculations were carried out as described below, using the formula:
11
Figure 1 gives an example of an evaluation cycle and how the calculation is performed. The difference (Δ) between the local max at 322 mg/dL and the first min at 209 mg/dL is 113 mg/dL, exceeding the value of 1 SD (75 mg/dL). Because the first excursion is in a nadir-to-peak direction, the direction of the calculation for that CGM profile is given by the direction of the first excursion. The Δ between the subsequent local min at 259 mg/dL and the preceding local max at 322 is only 63 mg/dL and less than 1 SD. Therefore, both of these local extremes are excluded from the calculation. Because the next excursion with its local max at 432 mg/dL satisfies the >1 SD criterion, the upstroke from 209 to 432 mg/dL (Δ = 233) and the subsequent downstroke from 432 to 137 mg/dL (Δ = 295) will be counted. Evaluation subsequently proceeds according to this cycle until the end of the glucose recording. If the glucose profile begins with an incomplete excursion, i.e., the exact min or max is unknown, as in the example given, the software program will disregard this excursion and not include it into the calculation. Details regarding the routines of the software program are provided in Supplementary Figure S1 (Supplementary Data are available online at

Example of glucose profile evaluation for software-based calculation of mean amplitude of glycemic excursions. One evaluation cycle is demonstrated, showing local maximums and minimums (boxes) on the curve. The y-axis denotes sensor glucose values (mg/dL); the x-axis gives the number of data points. A time interval of 15 min between glucose updates was used for simplification. The calculated 1 SD value was 75 mg/dL.
Collection of CGM data
CGM data were collected for outpatients with type 2 or type 1 diabetes during two independent clinical studies. All study participants had provided their written informed consent. The first study, with a mean CGM measurement period of 67.1 ± 4.9 h (mean ± SD), comprised 135 consecutive outpatients with type 2 diabetes (62 women and 73 men, mean age 63.0 ± 9.1 years, duration of diabetes 7.9 ± 7.1 years) who contributed 188 CGM measurements. 12 Data from the second study, based on 566 CGM recordings over a mean duration of 69.2 ± 4.1 h, were obtained from 323 outpatients with type 2 diabetes (102 women and 221 men, mean age 66.2 ± 9.1 years, duration of diabetes 12.1 ± 8.8 years) and from 16 outpatients with type 1 diabetes (nine women and seven men, mean age 51.4 ± 12.9 years, duration of diabetes 27.3 ± 10.8 years), the latter of whom contributed 16 CGM measurements. Patients with type 2 diabetes had been treated either with diet (n = 60), oral hypoglycemic agents (n = 181), oral hypoglycemic agents plus insulin (n = 102), or insulin alone (n = 115), depending on their glycemic control. The 16 patients with type 1 diabetes had received intensified therapy with multiple daily injections of insulin. Baseline A1C values were similar among the study cohorts (7.0 ± 1.2%, 6.9 ± 1.0%, and 7.4 ± 1.3%, respectively).
Data analysis
We evaluated the performance of the software program by comparing the computer-based MAGE calculation (MAGEC) with the MAGE index determined according to the original method described by Service et al., 10 designated here as MAGEO. Two researchers who were unaware of the outcome of the computer analysis analyzed the CGM data using MAGEO. One researcher analyzed the complete patient population (n = 474), whereas the other researcher performed an analysis on a randomly drawn sample (n = 66). The MODD was calculated as the mean of the absolute difference of glucose values from corresponding times of day from two consecutive days; 11 SD and Mean SG were calculated as means for each day and then averaged over the 3-day CGM period. 13 Mean SG values were obtained from CGM sensor readings standardized to capillary blood glucose levels measured during calibrations.
Statistical analyses
Data are presented as mean ± SD values unless otherwise specified. Within-treatment group comparisons between MAGEC and MAGEO were performed using the paired t test and between-group comparisons using analysis of variance. The relationships between the MAGE values obtained by the two computation methods in the same patients and associations with other measures of glycemic control were evaluated by Pearson's correlation analysis. Bland–Altman plots were used to represent the agreement of the methods. 14 A P value of < 0.05 was considered significant.
Results
Figure 2 depicts screen shots of the graphical user interface used in our software (the MAGE Computer Program is available from
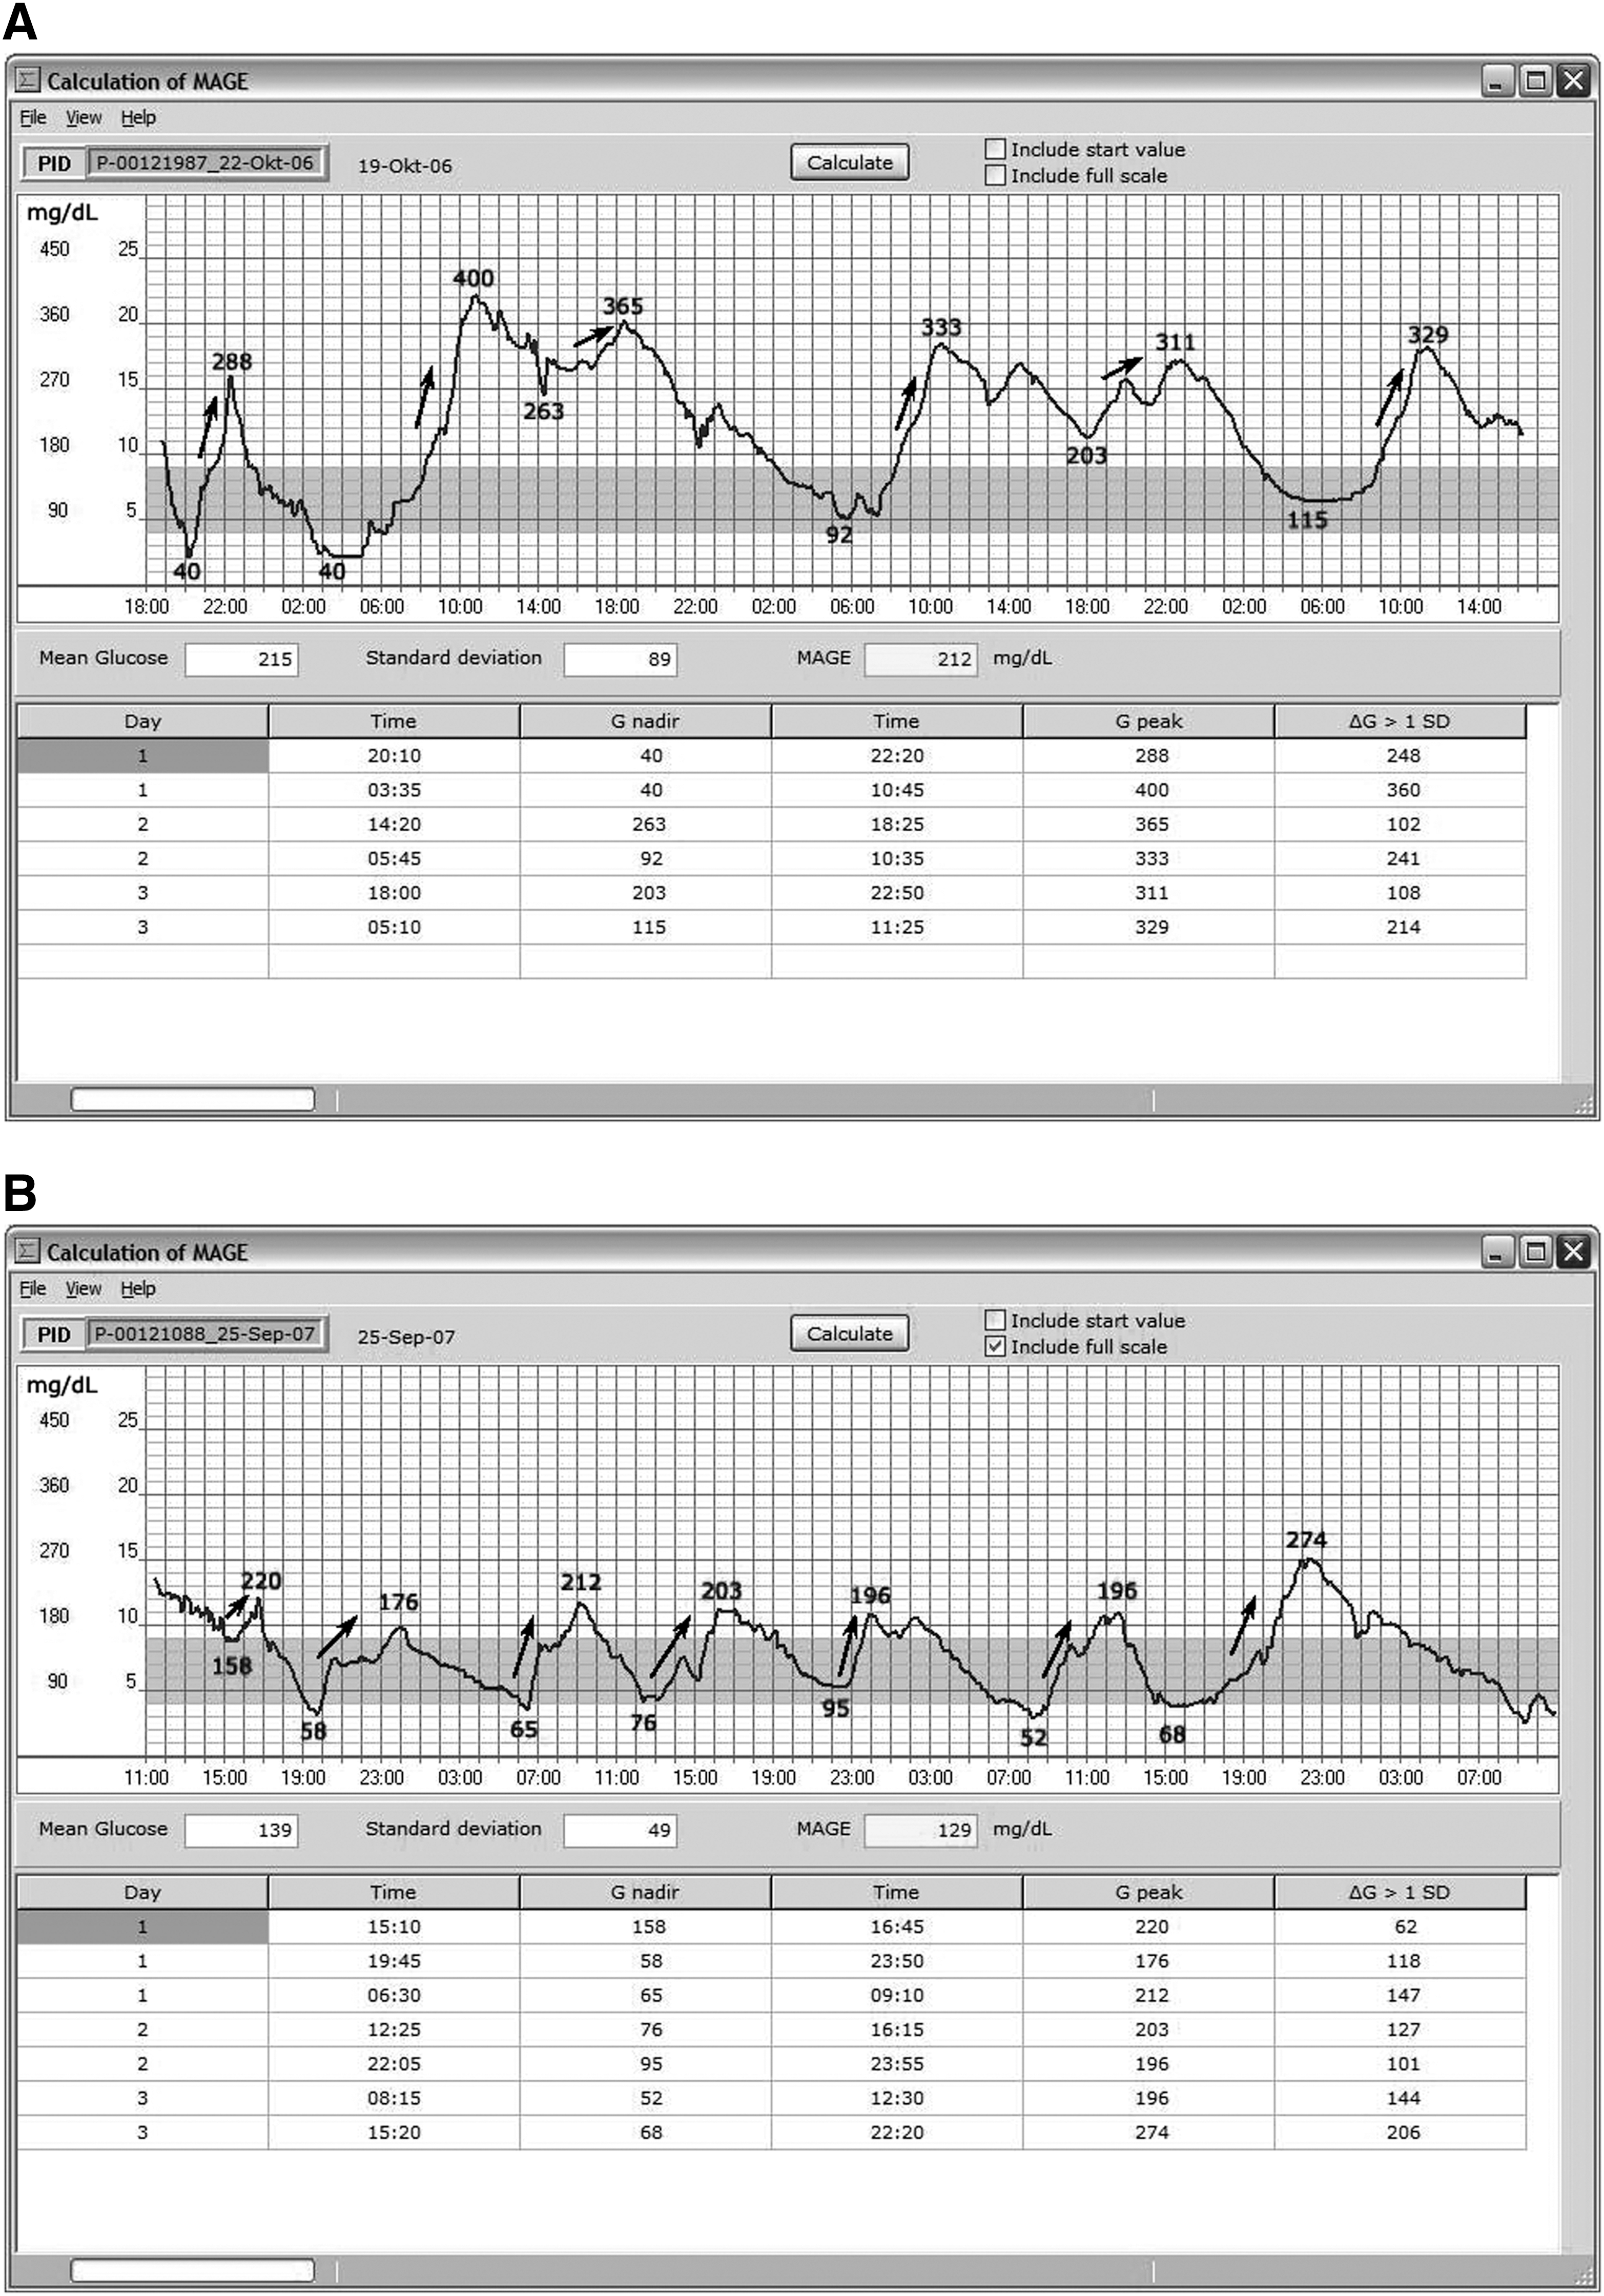
Screen shots of the graphical user interface for computerized calculation of the mean amplitude of glycemic excursions (MAGE). Continuous glucose monitoring profiles are shown of three successive 24-h periods (
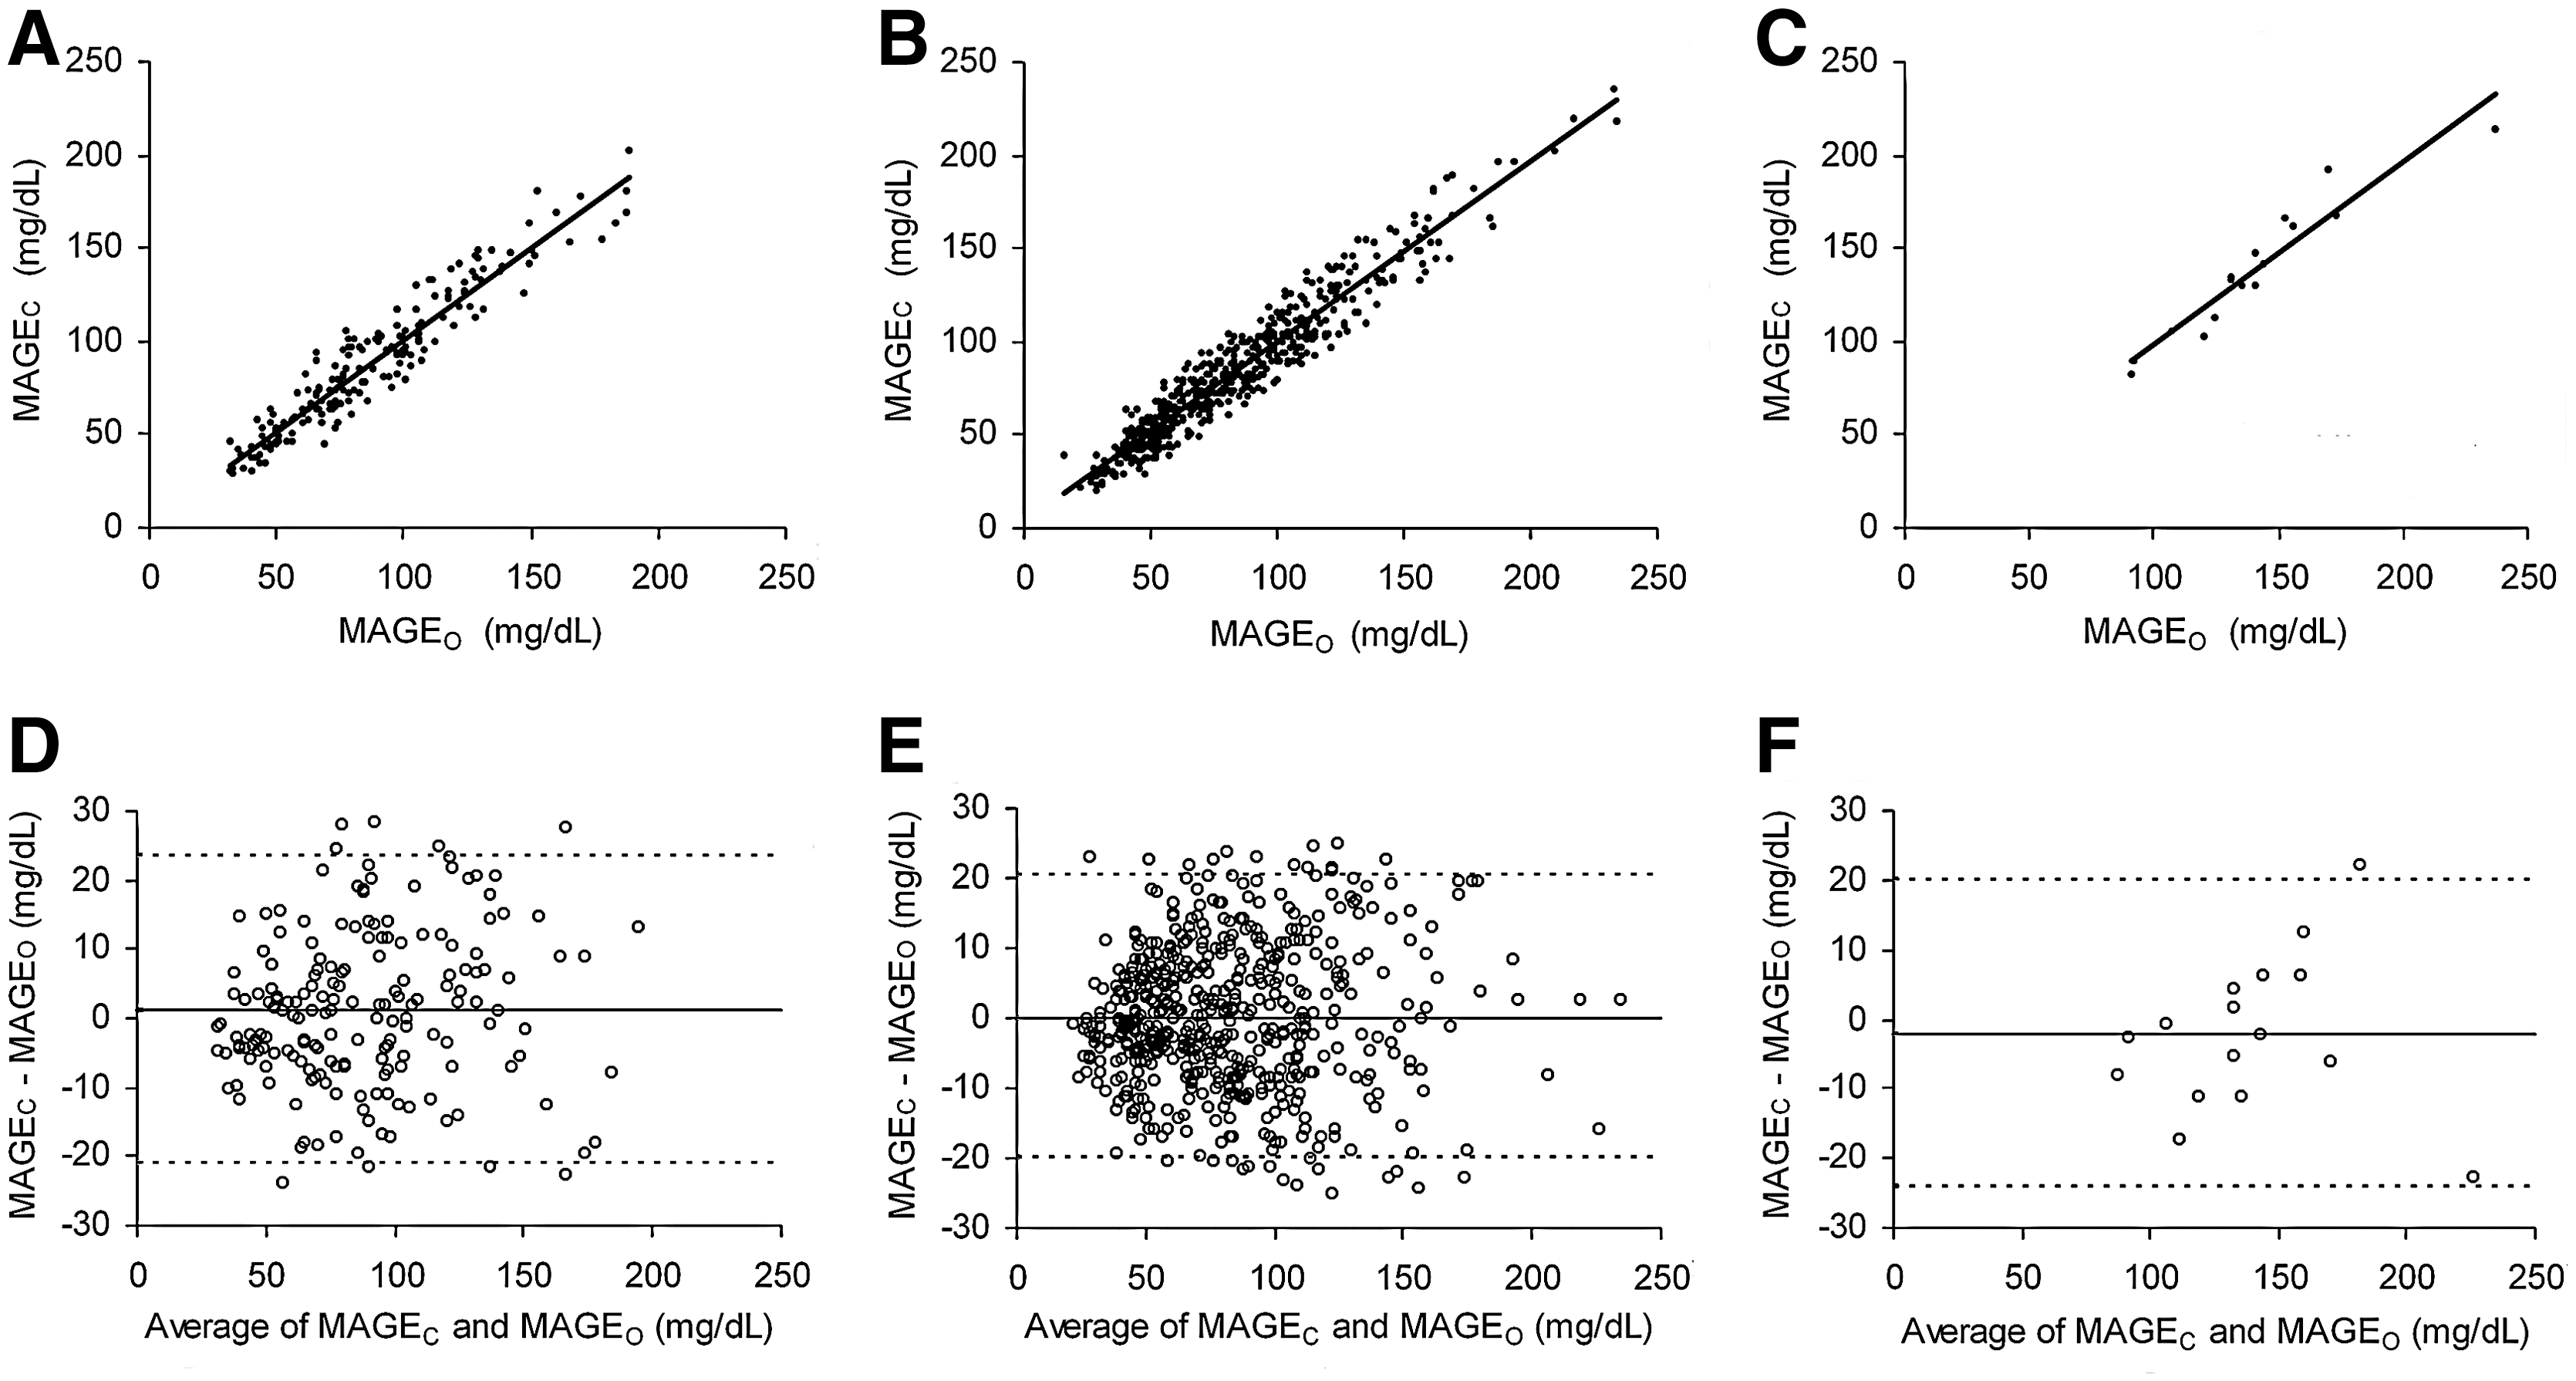
Comparison of the calculation methods
To obtain an estimate of the agreement of the calculation methods, we compared MAGEC and MAGEO values. As shown in Figure 3A–C, regression analysis in each of the type 2 and type 1 diabetes study cohorts identified highly significant linear correlations between MAGEC and MAGEO (r = 0.952, 0.960, and 0.951, respectively; P < 0.00001 for all). Bland–Altman plots (Fig. 3D–F) documented that the difference between the two methods of calculation was similar at all MAGE values, with no trend or deviation. The mean differences found for the three study cohorts were 1.20 ± 11.34, 0.1 ± 10.26, and −2.10 ± 11.16 mg/dL, respectively. Furthermore, comparison of the blinded analysis performed by the two independent researchers yielded similar correlation coefficients (r = 0.962 and r = 0.963, respectively), and Bland–Altman plots demonstrated mean differences of 0.00 ± 10.30 mg/dL and −3.70 ± 6.66 mg/dL (data not shown), which were not statistically significant.
(
Relationships of MAGEC to other measures of glycemic variability and glycemic control
When we analyzed the relationship between MAGEC and other measures of glycemic variability by linear regression analysis, as shown in Figure 4A and B, a significant overall correlation was found with both SD (r = 0.937, P < 0.0001) and MODD (r = 0.742, P < 0.001). The ratios of MAGEC to SD and to MODD were 2.54 ± 0.03 and 1.81 ± 0.06 (mean ± SE), respectively. A separate analysis of the three study cohorts showed that the relationship between MAGEC and SD remained highly significant with comparable correlation coefficients for the type 2 diabetes cohorts (r = 0.910 and 0.943, respectively; P < 0.0001 for all) as well as for the type 1 diabetes cohort (r = 0.914, P < 0.0001). The relationship between MAGEC and MODD, however, was only moderate, with correlations of r = 0.640, 0.757, and 0.688, respectively (P < 0.0001 for all). Figure 4C and D shows that bivariate comparisons of MAGEC with measures of glycemic control yielded weak correlations with both A1C (r = 0.285, P < 0.05) and Mean SG (r = 0.473, P < 0.001) for the entire study population. Correlation coefficients obtained between MAGEC and A1C and Mean SG for each of the study cohorts were, respectively, r = 0.218 (P < 0.05), 0.290, and 0.410 (P < 0.001) and r = 0.440, 0.510 (P < 0.001), and 0.430 (P < 0.05), for the two cohorts with type 2 diabetes and the type 1 diabetes cohort, respectively.
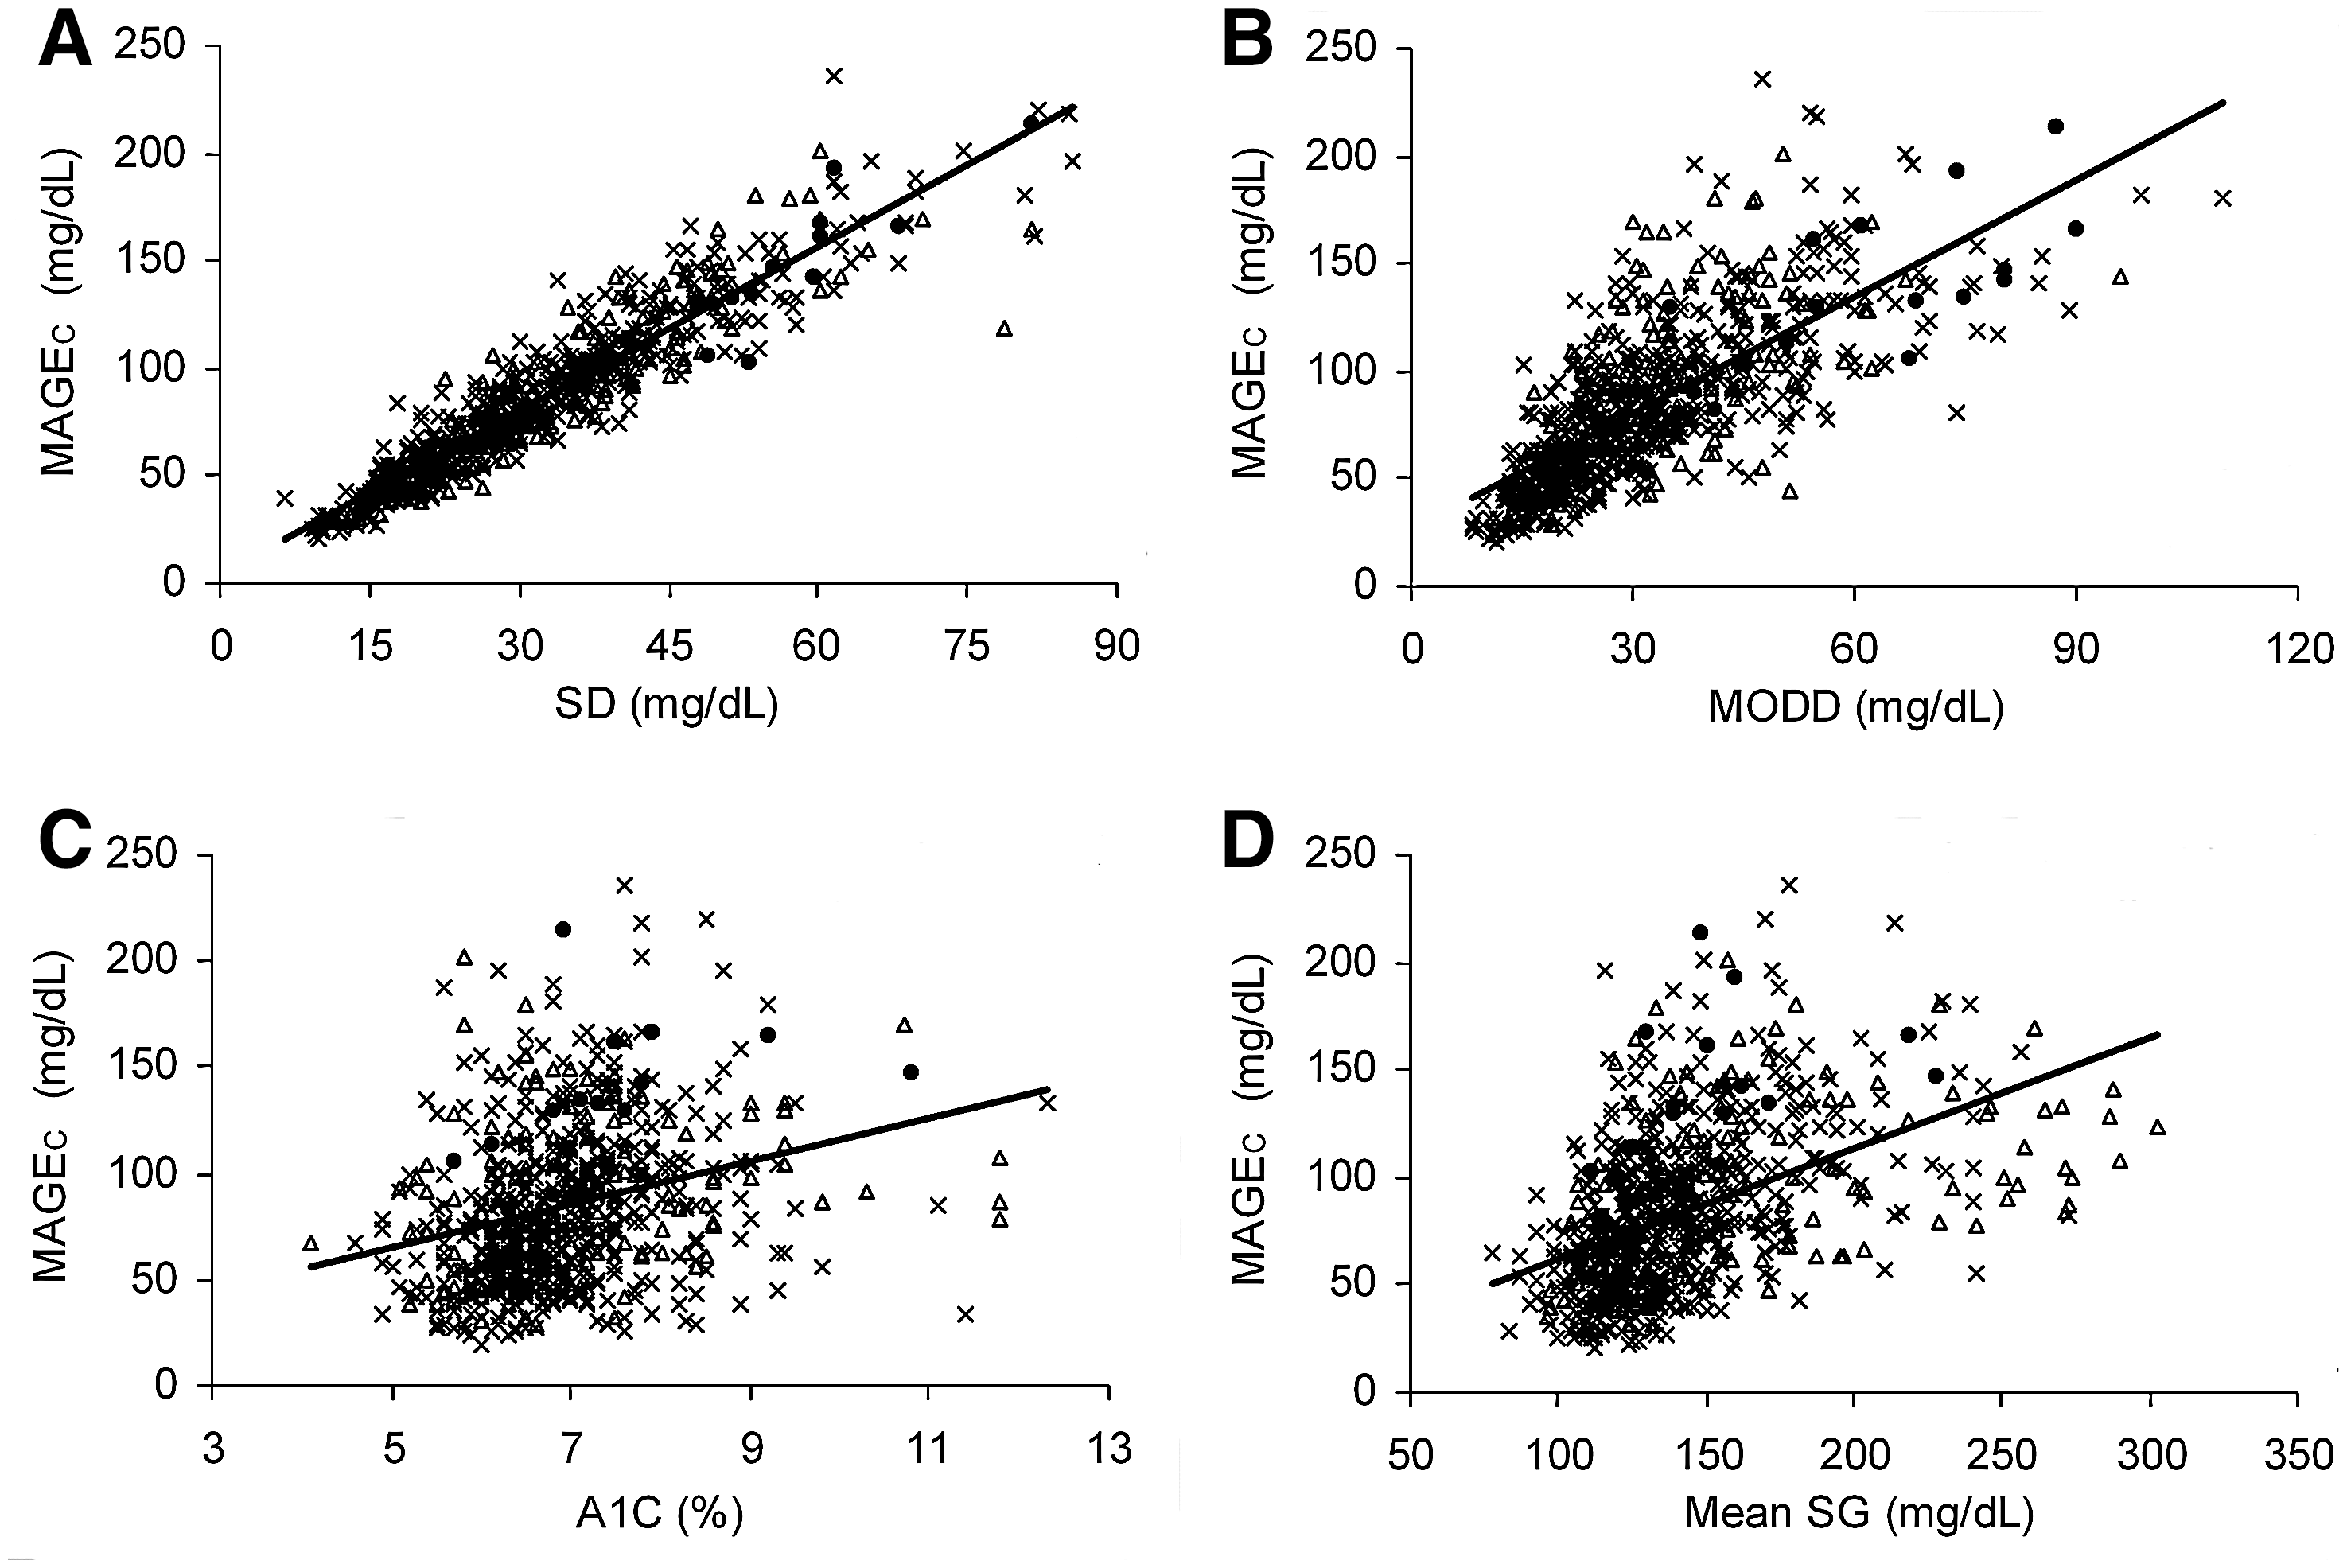
Relationships of computer-based mean amplitude of glycemic excursions calculation (MAGEC) to measures of (
Discussion
Among the various interrelated indices proposed to characterize glycemic variability, 15,16 the present article has focused on MAGE computation because this index appears to be an appropriate measure for characterizing the large glucose fluctuations that occur in poorly managed diabetes. Indeed, numerous clinical studies have previously used this classical index (MAGEO) as described by Service et al. 10 as a measure of glycemic variability. In their study of patients with type 1 diabetes, Rodbard et al. 16 used a software program for MAGE calculation to assess, in conjunction with other criteria, the response to real-time CGM; however, the program was not described, and comparisons with the original method of calculation were not reported. Thus, there is a need for reproducible and efficient methods that allow standardized quantification of MAGE.
This study describes a validated computer program that is efficient and capable of characterizing or detecting responses to different therapeutic regimens. Although in addition to calculation of MAGE, the software allows display of the Mean SG and SD of glucose, other parameters of glycemia cannot be computed. In contrast to the original method, which uses the 1 SD criterion defined from one 24-h period, the present approach used the SD calculated for the entire 72-h CGM measurement period. It might be argued, then, that in cases with large between-day variability, the values for MAGEC might be erroneous compared with those obtained by the original method of calculation; however, we observed no such discrepancy in our patient cohorts. We further note that the MAGE value obtained by either method was calculated for the entire 72-h CGM measurement period. Indeed, compared with using two successive 24-h monitoring periods for calculation, as in the original method, 10 the arithmetic mean obtained from a 72-h measurement will increase the reliability of MAGE estimation. Moreover, because the software calculates the MAGE continuously across the 72-h CGM period, problems with the discontinuity that occurs with the original graphical method as one “clicks over” 4 to the following 24-h period can be circumvented.
We also decided, for both the graphical and the computer methods, to use the amplitude of the first time the two edges of the excursion satisfied the 1 SD criterion. The information lost by neglecting incomplete upstrokes or downstrokes had a minimal effect on the magnitude of MAGE. As the results of this retrospective analysis clearly demonstrate, we detected no within-treatment-group differences between MAGEC and MAGEO. The magnitude of both MAGE indices, however, was similarly dependent on the treatment regimen and type of diabetes. In view of this very high correlation between MAGEO and MAGEC, the results of other studies that assessed glucose fluctuations by the original method can be compared with results obtained with this computer program. Furthermore, our analysis comparing MAGE results with values from other common indices of glycemic variability showed that the correlation coefficients of MAGEC with SD and MODD were in close agreement with those recently reported by Rodbard 13 and Borg et al. 17 In addition, the ratios of MAGEC to SD and to MODD that we identified are comparable to those of Rodbard. 13 Even though there is a direct proportionality between MAGE and SD, as shown by others 13,17 and confirmed by our data, we think that this association does not preclude the need to calculate MAGE. However, proposing a specific index for characterizing glycemic variability would be premature and is beyond the scope of the present work. As expected and in agreement with recent findings by Borg et al., 17 MAGE was weakly correlated with measures of general glycemia such as A1C and Mean SG, indicating that this variability index conveys different information.
An apparent limitation of this study is that the datasets used were mainly obtained from patients with type 2 diabetes, especially in the insulin-treated patients with mean MAGE values that did not differ notably from those of patients with type 1 diabetes. Only a small cohort of patients with fairly well-controlled type 1 diabetes with A1C values ranging from 5.9% to 8.1% was available for glucose profile analysis. Although these patients usually present with a somewhat higher number of glycemic fluctuations and different glucose patterns, the correlation between MAGEC and MAGEO and the Bland–Altman plot results were similar, as was the case in the cohorts with type 2 diabetes. A possible concern is whether the type 1 diabetes cohort is representative of primary care patients with type 1 diabetes. However, data for cases involving more difficult management of type 1 diabetes and extreme glucose fluctuations were not accessible for analysis because these patients are usually referred to the hospital before CGM is performed.
In summary, we have presented here a completely Windows-based, user-friendly, validated software program for the calculation of MAGE that may be useful for clinicians and practitioners in their efforts to assess glycemic stability and improve glycemic control in their patients.
Footnotes
Author Disclosure Statement
All authors declare no potential financial interest or any commercial association that might present a potential conflict of interest. All authors declare that no competing financial interests exist.
References
Supplementary Material
Please find the following supplemental material available below.
For Open Access articles published under a Creative Commons License, all supplemental material carries the same license as the article it is associated with.
For non-Open Access articles published, all supplemental material carries a non-exclusive license, and permission requests for re-use of supplemental material or any part of supplemental material shall be sent directly to the copyright owner as specified in the copyright notice associated with the article.