




Abstract
Aim:
This study evaluated the performance characteristics of a prototype Becton Dickinson (BD) (Franklin Lakes, NJ) glucose/galactose binding protein (GGBP) sensor placed intradermally (BD-ID) or subcutaneously (BD-SC) for continuous glucose monitoring.
Materials and Methods:
The performance characteristics of the prototype BD GGBP sensor after intradermal or subcutaneous placement were assessed, and its accuracy was compared with that of a glucose oxidase (GOx)-based sensor and a standard laboratory method (YSI STAT2300 analyzer, Yellow Springs Instrument, Yellow Springs, OH) under glucose clamp conditions and during an off-clamp meal challenge in 40 patients with type 1 or 2 diabetes in a 12-h feasibility study.
Results:
BD-ID and BD-SC sensors performed as well as or better than the GOx-based sensor (differences in median absolute percentage error 2–4 points in hyperglycemic and euglycemic regions, ≥ 10 points in the hypoglycemic region). For glucose values ≤ 100 mg/dL, the percentage of measurement values in consensus error plot Zone A was substantially higher with the GGBP sensors than the GOx-based sensor.
Conclusions:
The BD prototype sensor demonstrated competitive accuracy relative to a GOx-based sensor and a YSI blood standard with a single calibration and minimal warm-up. Current development work is focused on the design and manufacture of a commercially feasible device that will include marked enhancements to device robustness and longevity.
Introduction
To overcome the limitations of GOx-based systems, Becton Dickinson (BD) (Franklin Lakes, NJ) is developing a sensor that detects glucose directly with fluorescently labeled glucose/galactose binding protein (GGBP). 14 –16 The conformational change that occurs when the fluorescently labeled GGBP reversibly binds glucose produces an optical signal that is the basis of a simple, direct, equilibrium-based method of estimating blood glucose values. 17 The protein in the GGBP sensor has been genetically engineered at BD to bind glucose in the human physiological range and to produce a specific fluorescent response. The prototype investigational device, developed for subcutaneous (SC) or intradermal (ID) placement, is small and minimally invasive and requires only a minimal warm-up period. In two previous human feasibility studies (n = 16 and n = 20 patients with type 1 diabetes, respectively), GGBP-based sensors demonstrated reasonable fidelity in tracking of blood glucose and were well tolerated over monitoring periods of 6–14 h (BD company data on file). The study reported herein was conducted to evaluate the performance characteristics of the BD GGBP sensor placed intradermally (BD-ID) or subcutaneously (BD-SC) under glucose clamp conditions and during an off-clamp meal challenge in patients with type 1 or type 2 diabetes. In addition, the accuracy of the current BD-ID and BD-SC prototype sensors (31-gauge cannula with a 100-μm optical fiber) was compared with that of a commercial GOx-based sensor (Medtronic Guardian®, Medtronic Minimed, Northridge, CA) and a standard laboratory method (YSI STAT2300 analyzer, Yellow Springs Instrument, Yellow Springs, OH).
Subjects and Methods
Patients
Male or female patients 18–65 years old with type 1 or type 2 diabetes were eligible for the study if they had a body mass index from 19 to 30 kg/m2 and glycosylated hemoglobin < 11%. Exclusion criteria included uncontrolled hypertension (diastolic blood pressure > 90 mm Hg and/or systolic blood pressure > 160 mm Hg), impaired hepatic function, diffuse dermatologic abnormalities, or severe acute or chronic diseases that might, in the investigator's judgment, have interfered with study conduct. All patients provided written informed consent.
Procedures
The protocol for this open-label study (BD Technologies protocol BDT-08-CGM-02) was approved by an institutional review board for the single study site. The experimental intervention occurred during a single clinic visit at which patients' data were continuously collected with the BD GGBP sensors and a GOx-based sensor (Medtronic Guardian with a CGMS® SystemGold™ continuous glucose monitor) during a 6-h automated glucose clamp that produced a predetermined profile of glucose excursions, followed by a 6-h, off-clamp meal challenge.
On the day of the intervention, patients arrived at the clinic in the morning after a ≥ 10-h fast. Patients were to continue their prestudy insulin treatment until the evening before clinic admission. Patients on an insulin pump were to continue to use the pump until admission to the clinic but were not to administer any insulin bolus on the morning of the experiment. Each patient had three BD GGBP sensors placed subcutaneously (BD-SC; insertion depth ≥ 3 mm), three BD GGBP sensors placed intradermally (BD-ID; insertion depth < 1 mm), and one Medtronic Guardian GOx-based sensor placed subcutaneously. Intradermal insertion depth was confirmed by ultrasound measurements taken at the end of the intervention period. BD GGBP sensors are composed of acrylodan-labeled GGBP, a matrix to retain GGBP, an optical conduit for coupling light into and out of the body, and an optical reader capable of tracking the optical signal. The current prototype uses a 31-gauge cannula with a 100-μm-diameter silica core optical fiber suspended within a 25-gauge butterfly cannula (Fig. 1).
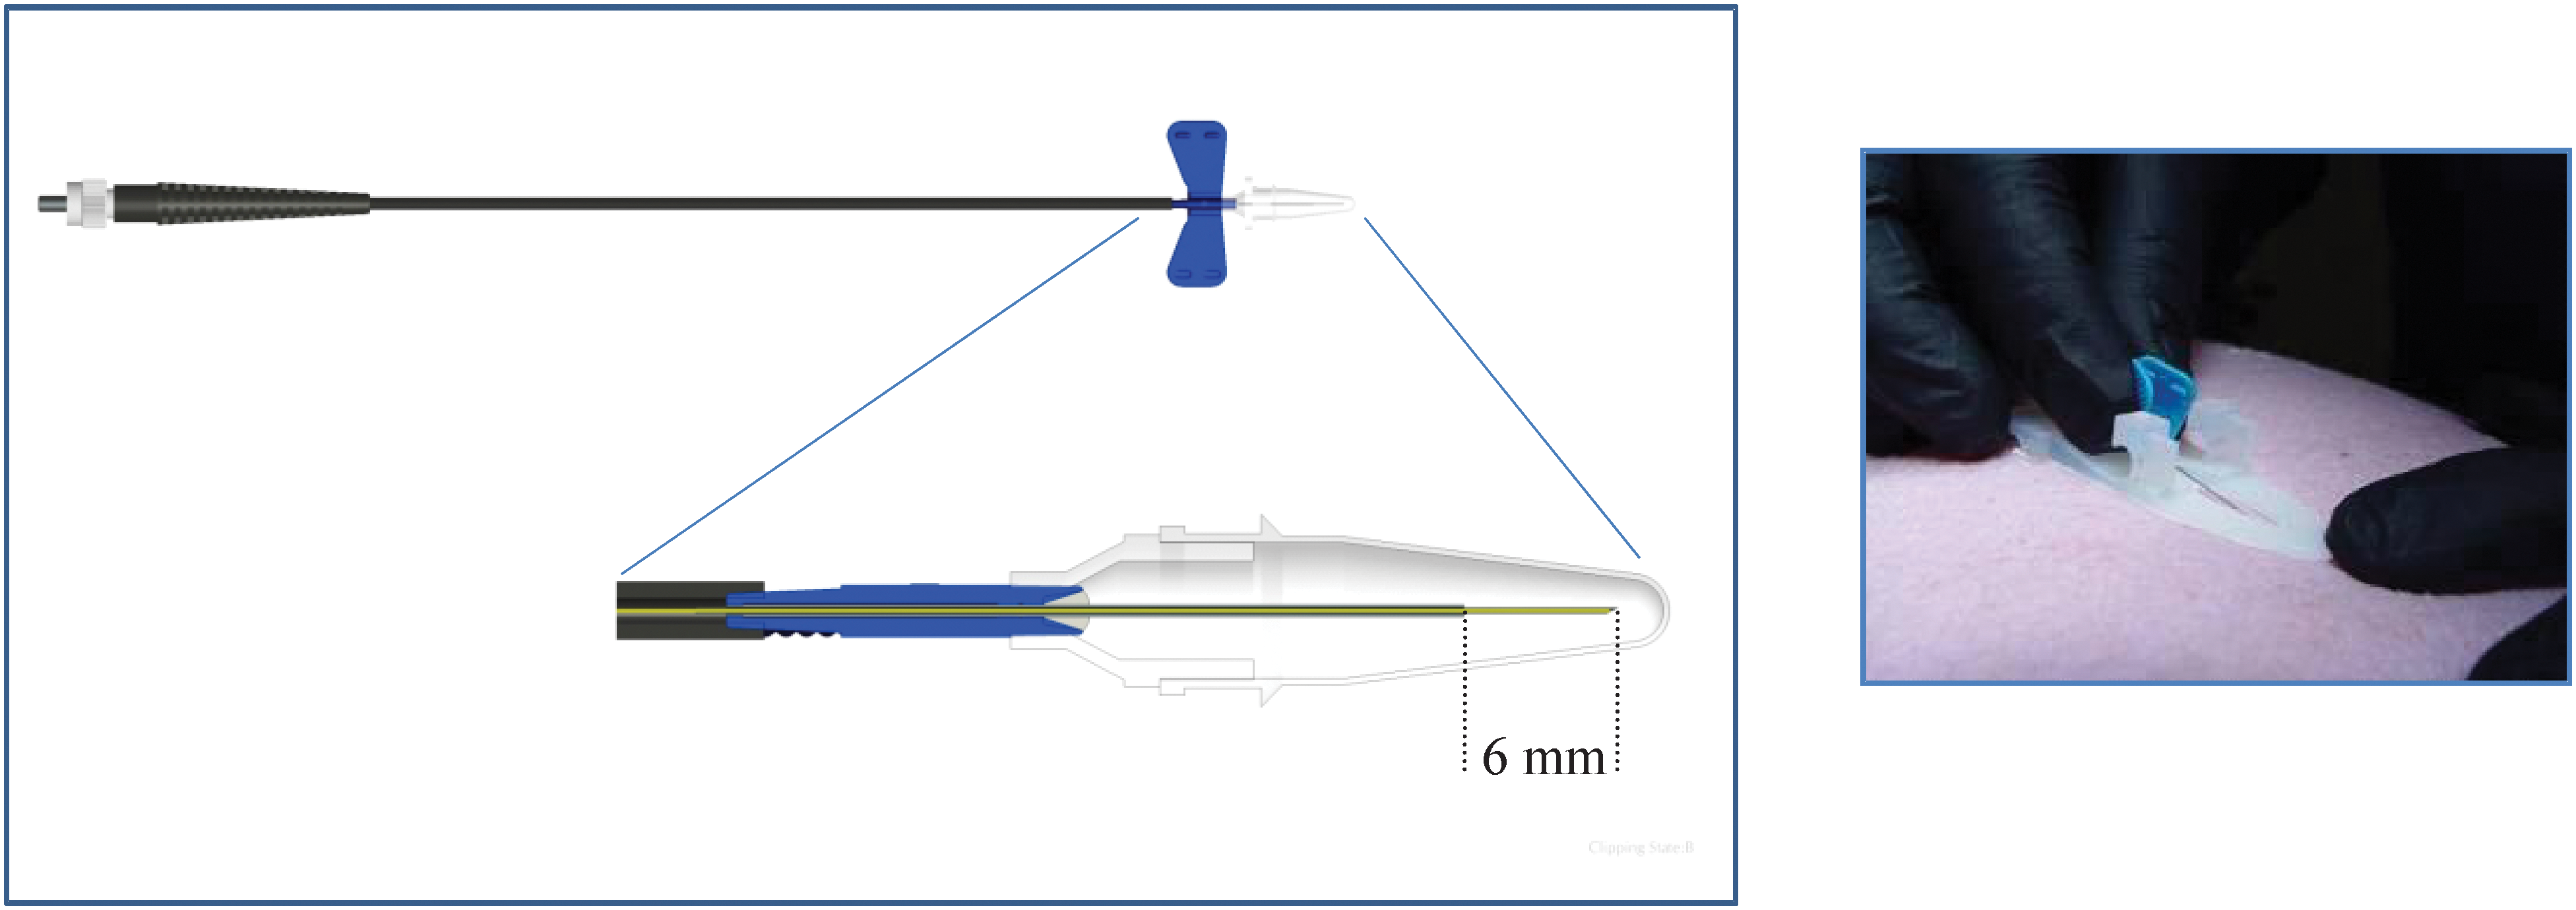
The Becton Dickinson glucose/galactose binding protein sensor (
Before the BD GGBP sensors were inserted into the periumbilical abdominal wall, an ex vivo calibration that determined sensor fluorescence values in sterile glucose solutions (0 mM, 5 mM, or 30 mM) was performed. This calibration step is utilized to define the key parameters in order to inform the algorithm needed to convert the fluorescence signal into blood glucose values. The BD GGBP sensors were inserted at t = − 60 min and was updated once at t = 0 min. The GOx-based sensor was inserted at t = − 120 min and was calibrated three times at t = 0 min, t = 120 min, and t = 360 min. Throughout the clamp period and off-clamp, meal-challenge portion of the study, GOx-based sensors were interrogated every 5 min, and BD GGBP sensors were interrogated every 3 min.
Venous blood was sampled every 5 min during the clamp period and every 10 min during the off-clamp meal challenge for determination of reference blood glucose values by a standard laboratory method (YSI STAT2300 analyzer). A Biostator® (Life Sciences Instruments, Miles Laboratories, Elkhart, IN) was used as a glucose clamp management device. For continuous blood glucose concentration measurement, a wrist or hand vein on one arm was cannulated for insertion of an 18-gauge Teflon® (Dupont, Wilmington, DE) double-lumen catheter, which was connected to the (GOx-based) glucose sensor of the Biostator. For infusion of glucose (20% in water), a vein on the opposite forearm was cannulated with an 18-gauge Teflon catheter. An insulin solution was infused continuously from a syringe pump during the baseline period in the same vein. Regular human insulin (15 U of Novolin® [Novo Nordisk, Bagsvaerd, Denmark] U100 in 50 mL of physiological saline plus 1 mL of blood) was infused intravenously via a precision pump at a flexible rate depending on individual requirements. The intravenous insulin infusion catheter was used to administer intravenous insulin boluses or glucose boluses as needed to achieve target blood glucose levels. Blood samples for external blood glucose analyses with the YSI glucose analyzer were drawn from a third intravenous catheter inserted in a cubital vein of the left arm. The left arm was placed in a hot box throughout the experiment in order to increase arteriovenous shunting.
Figure 2 shows the profile of blood glucose concentrations produced with the Biostator with administration of intravenous glucose or insulin boluses as necessary. From t = − 120 min to t = 0 min, patients' blood glucose levels were maintained at a euglycemic plateau with a blood glucose target of 90 mg/dL. This first euglycemic plateau was followed by a 45-min hypoglycemic plateau with a blood glucose target of 60 mg/dL, a 45-min hyperglycemic plateau with a blood glucose target of 240 mg/dL, and a 45-min euglycemic plateau with a blood glucose target of 110 mg/dL. At the end of this second euglycemic plateau, which occurred at approximately t = 300 min, the Biostator was discontinued, and patients received a liquid meal containing 40–80 g of carbohydrate (one to two cans of Ensure® [Abbott Nutrition, Columbus, OH] to achieve a blood glucose level ≥ 150 mg/dL 2 h post-meal) designed to produce significant glucose excursion over the ensuing several hours. During the off-clamp, meal-challenge portion of the study, insulin was administered at the discretion of the investigator. The blood glucose target for the end of the study period was 90–120 mg/dL.
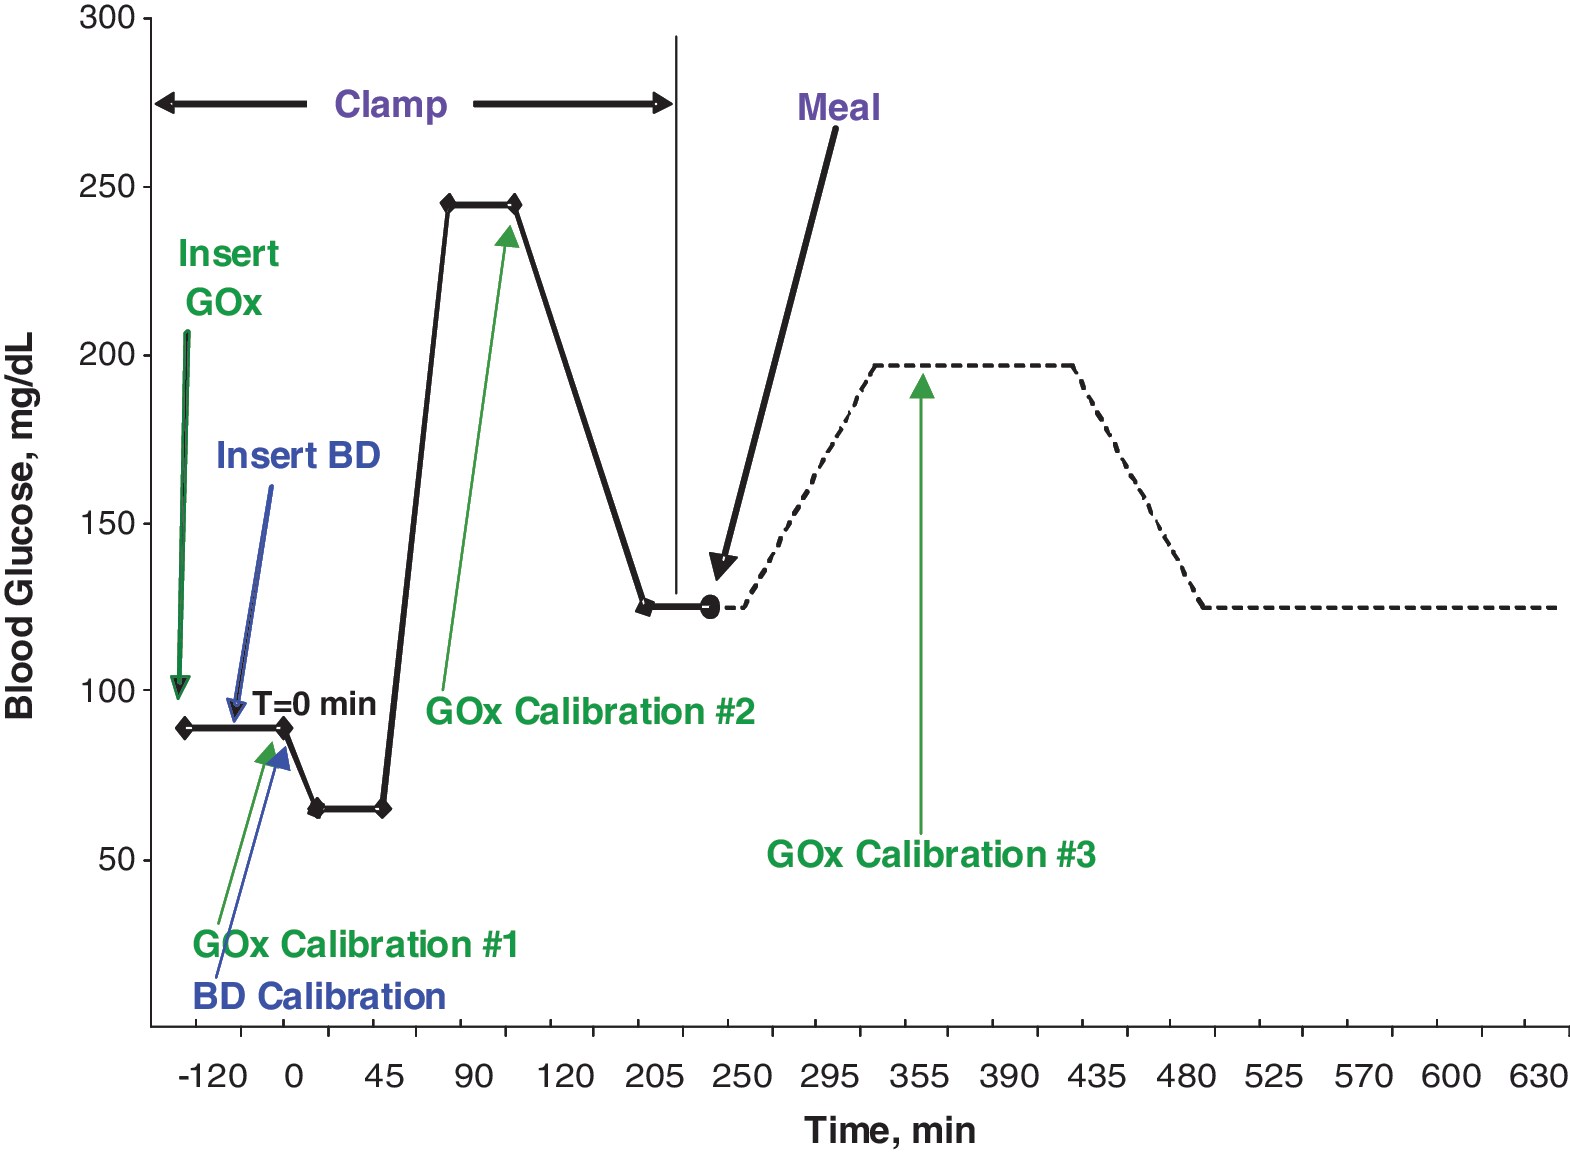
Study profile of blood glucose targets and timings of insertions and calibrations of the Becton Dickinson glucose/galactose binding protein sensor (BD) and the glucose oxidase (GOx)-based sensor. Color images available online at
Measures and statistics
The objectives of the first of two phases of data analysis in this study were to investigate the blood-to-sensor equilibrium time constant (τ) of each sensor type, compare these values among the sensor types, and characterize patient-to-patient variability in τ. The objective of the second phase of the analysis was to compare accuracy among sensor types with τ applied and with τ not applied to the data in order to assess the impact of τ on sensor accuracy. Data were separated into a training set used for estimation of time constants in Phase I and a test set used for determination of accuracy in Phase II. The training set comprised five patients selected from the sample by using stratified random sampling based on gender and diabetes type. This method was chosen instead of using consecutive subjects to achieve a more representative sample. The test set for determination of accuracy with τ applied excluded these five patients, but those five patients were included with the remainder of the sample in analyses to determine accuracy with τ not applied. The analyses comparing the τ values among sensor types and assessing patient-to-patient variability in τ used all available τ observations, not just those from the training set. In both phases of the analysis, observations were excluded for broken sensors, precalibration failures, failed ID placement (sensors inserted > 1.0 mm), and failing prespecified criteria for sufficient signal strength.
Phase I: Estimation and assessment of time constants
Transport of glucose from blood to interstitial fluid (ISF) surrounding the sensors is known to impart a temporal shift in glucose signal. 18,19 In order to correct for this shift, the transport was modeled as a diffusion process: rate of change of ISF glucose = k × ([blood glucose] − [ISF glucose]), where k was the rate constant (time−1). The blood-to-sensor equilibration time constant (τ) is here defined as the inverse of this rate constant. Transport delay effects were corrected for by applying the inverse of the equation above, i.e., the derivative of the sensor output was multiplied by the ISF and added to the sensor output: [blood glucose] = rate of change of ISF glucose × ISF + [ISF glucose]. To ensure that the derivative signal was not overly affected by sensor noise, sensor values were first smoothed by applying a spline curve fit to each sensor output using a sliding window of 24 previous measurements. Individual sensor ISF values were determined by searching integer values of 1–70 min to find the highest correlation between sensor glucose and reference glucose. The particular GOx-based sensor used in this study (Medtronic Guardian with a CGMS SystemGold continuous glucose monitor) incorporates a 10-min delay in the time association of glucose values as an integral part of its algorithm. For standardization of τ analysis between the sensor types in the current study, that delay was removed from the Medtronic meter outputs before the sensor τ determination. In the accuracy analysis performed separately, no adjustments in the Medtronic meter outputs were made.
The statistical analysis was performed using a linear mixed-effects model with the natural logarithm of τ as the response variable, a fixed effect for sensor type, and random effects for patient and the patient–sensor type interaction. Analysis of variance was used to test for an overall effect of sensor type, and contrasts were used to make pairwise comparisons between sensor types in the presence of a significant overall effect. F tests were used to test the hypothesis that interpatient variability is a significant source of variability in τ. Because the patient–type interaction component was significant, the patient component was tested separately in models for BD-ID and BD-SC sensors.
Phase II: Determination of accuracy
Blood glucose was calculated from sensor readings using the transport model described above with time constants for each sensor type derived from the five-patient training set from Phase I. Accuracy analyses were conducted to estimate the median absolute percentage error (MAPE) within each glycemic region (hypoglycemic < 75 mg/dL, euglycemic 75–180 mg/dL, and hyperglycemic > 180 mg/dL). The analysis was performed using a linear mixed-effects model with sensor type, glycemic region, and their interaction as fixed effects and patient and the patient–sensor interaction as random effects.
Two supplemental analyses were performed to further evaluate measurement accuracy. First, in order to assess the impact of sensor warm-up time on accuracy, mean absolute error in glucose measurement was plotted as a function of time since sensor insertion through approximately 2 h post-insertion for each sensor type in a post hoc analysis. Sensor updates at t = 0 min were applied retrospectively to the earliest available data, and the average and SE of all sensors' absolute errors were calculated at each time point. Second, to estimate the degree of clinical risk posed by measurement error, consensus error grids 20 were constructed for each patient and for the sample as a whole by plotting sensor glucose values against reference glucose values obtained with the YSI STAT2300 analyzer for the BD-ID sensor, the BD-SC sensor, and the GOx-based sensor.
Adverse events
Adverse events, defined as any untoward medical occurrences, were recorded throughout the study. The frequencies of adverse events and of patients with adverse events were summarized.
Results
Patients
The number of patients who enrolled in the study was 41, of whom 40 completed it. One patient was discontinued because of an adverse event of bronchospasm. Table 1 shows demographics and baseline clinical data for the sample. White males (63.4% males; 85.4% white, 12.2% African American) comprised the majority of the sample (Table 1). Approximately two-thirds (61%) of patients had type 1 diabetes; the remainder had type 2 diabetes.
n = 32.
BMI, body mass index.
Disposition of sensors
Of the 240 BD sensors and 40 GOx-based sensors targeted for placement, 235 BD sensors (115 BD-ID, 120 BD-SC) and 39 GOx-based sensors were placed (Table 2). Six of the 280 total sensors were not placed because they were broken (five BD sensors) or had calibration failure (one GOx-based sensor). Of the 235 BD sensors placed, 211 were functional ≥ 6 h after placement. The remaining 24 sensors (nine BD-ID, 15 BD-SC) met criteria for insufficient signal intensity during the first 6 h of the experiment. Of the 211 BD sensors with sufficient signal intensity during the first 6 h of the experiment, 158 (80 BD-ID, 78 BD-SC) were also functional ≥ 12 h after placement. Of the 53 sensors lost between 6 h and 12 h after placement, 50 were lost because they lost sufficient signal intensity; the remaining three were found to be ID sensors that were > 1 mm deep and therefore removed from the analysis. Of the 39 GOx-based sensors that were placed, 36 were functional ≥ 12 h after placement. Of the three GOx malfunctions, two were attributed to calibration failure; one additional sensor dislodged from its placement site.
BD, Becton Dickinson; ID, intradermal; SC, subcutaneous.
Time constant analysis
Dataset
Of a maximum possible 280 τ values in the dataset (120 for the BD-ID sensor, 120 for the BD-SC sensor, and 40 for the GOx-based sensor), the dataset for time constants comprised 97 BD-ID sensors, 104 BD-SC sensors, and 36 GOx-based sensors. Reasons for exclusions of sensors included missing τ values (because of broken sensors or calibration/insertion failures; n = 5 BD-ID sensors and n = 4 GOx-based sensors) and meeting exclusion criteria (being inserted at an inappropriate depth, failing precalibration, failing criteria for sufficient signal strength; n = 18 BD-ID sensors, n = 16 BD-SC sensors).
Results
The τ for the BD-ID sensor (14.3 min [95% confidence interval (CI) 11.8, 17.3]) was greater than that for the GOx-based sensor (8.2 min [95% CI 6.4, 10.5]), which was greater than that for the BD-SC sensor (5.4 min [95% CI 4.5, 6.5]). The variance component for patient–type interaction was significant (P < 0.0001), a result indicating that results for subject variability could vary between sensor types. In separate models run for ID and SC sensors, the variance component attributed to patient was not significant (P > 0.2 in both cases).
Sensor accuracy
Dataset
Of the 271 sensors placed, 89 were excluded wholly or partly from accuracy analyses for reasons including insufficient signal strength, the patient's not meeting a prespecified glucose threshold during the postmeal excursion, broken sensors, precalibration failure sensors, and sensors inserted at an inappropriate depth. In addition, as prespecified in the data analysis plan, all data from the five patients in the training set from Phase I were excluded from the Phase II accuracy analysis that applied τ but were included in the Phase II accuracy analysis that did not apply τ.
Results
MAPE with τ applied was significantly lower with the BD GGBP sensors than the GOx-based sensor in each glycemic region (Fig. 3). Furthermore, MAPE with τ applied was statistically significantly lower with the BD-ID sensor than the BD-SC sensor in each glycemic region (Fig. 3). In the analyses in which τ was not applied, the only statistically significant pairwise comparisons were observed in the hypoglycemic region between the BD-ID sensor (MAPE 8.4 [95% CI 7.5, 9.4]) and the GOx-based sensor (MAPE 19.1 [95% CI 15.8, 23.2]) and between the BD-SC sensor (MAPE 9.2 [95% CI 8.2, 10.3]) and the GOx-based sensor (P < 0.001). None of the comparisons between the BD-ID sensor and the BD-SC sensor was statistically significant in analyses in which τ was not applied.
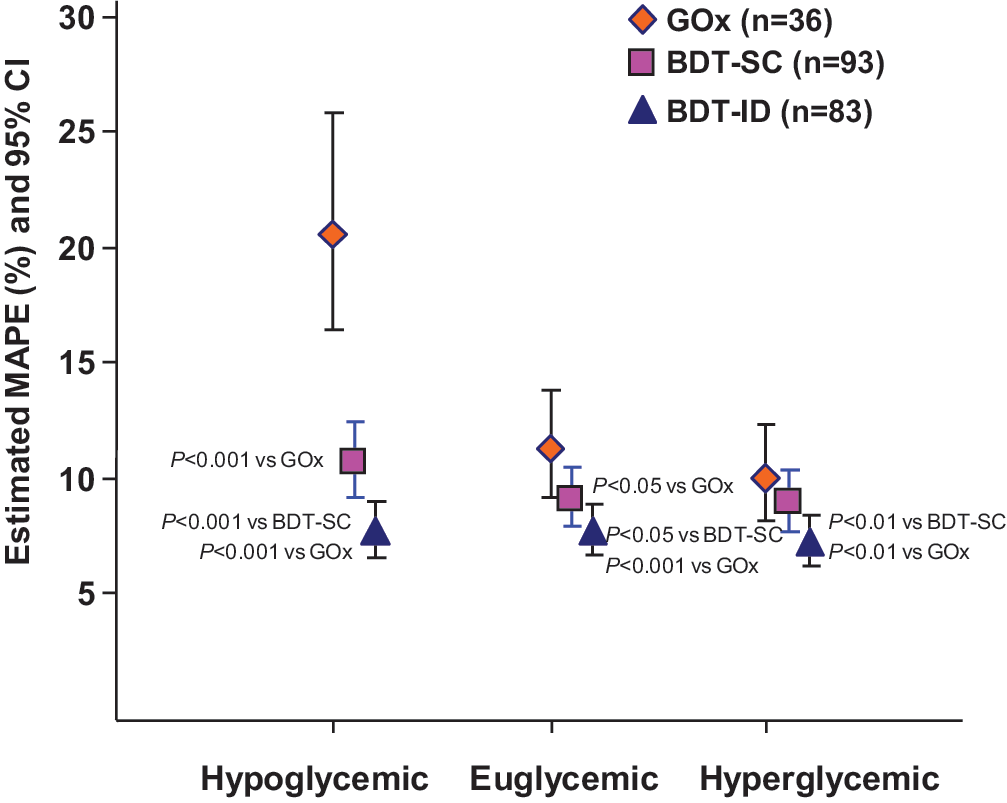
Median absolute percentage error (MAPE) with 95% confidence interval (CI) values for each glycemic region with the Becton Dickinson Technologies (BDT)-subcutaneous (SC), BDT-intradermal (ID), and glucose oxidase (GOx)-based sensors.
The BD-ID and BD-SC sensors, which were powered on 15 min after insertion, began tracking with a low absolute measurement error very soon after being powered on (Fig. 4). The GOx-based sensor, which was calibrated 2 h after insertion as per device requirements, had high absolute measurement error through at least the first 4 h after insertion.

Mean (bars indicate SE) absolute error in glucose measurement as a function of time since insertion of the Becton Dickinson (BD)-intradermal (ID), BD-subcutaneous (SC), and glucose oxidase (GOx)-based sensors. Note that sensor calibrations at t = 0 min were applied retrospectively to the earliest available data, and the average and SE of all sensors' absolute errors were calculated at each time point. All times shown are relative to the mean insertion time for each sensor type. GOx-based sensors were calibrated approximately 2 h after insertion, whereas BD sensors were powered on 15 min after insertion and began data collection immediately.
For all glucose values, the percentage of values in consensus error grid Zone A (no effect on clinical action) was higher with both the BD-ID sensor (85.8%) and the BD-SC sensor (83.9%) than with the GOx-based sensor (75.4%) (Fig. 5). The percentage of values in Zones A (no effect on clinical action) and B (altered clinical action—little or no effect on clinical outcome) was similar among sensors (97.8% with BD-ID, 97.6% with BD-SC, and 93.0% with GOx). For glucose values ≤ 100 mg/dL, the percentage of values in Zone A was substantially higher with both the BD-ID sensor (92.1%) and the BD-SC sensor (91.5%) than the GOx-based sensor (55.5%). Similarly, the percentage of values in Zones A and B was higher with both the BD-ID sensor (98.3%) and the BD-SC sensor (98.9%) than the GOx-based sensor (73.7%). The differences in percentage A + B between the BD-ID sensor versus the GOx-based sensor and between the BD-SC sensor and the GOx-based sensor were statistically significant for glucose values ≤ 100 mg/dL (P < 0.001).

Consensus error grids (
Adverse events
Seventeen adverse events were reported in 14 patients during the study. The only adverse events reported more than once were headache (five events) and backache (three events). One patient was withdrawn from the study because of an event of bronchospasm. Most of these adverse events can be attributed to the prolonged immobilization.
Discussion
In this feasibility study, investigational BD GGBP sensors placed ID or SC demonstrated safety in patients with type 1 and type 2 diabetes and had good accuracy relative to a commercially available GOx-based sensor versus a YSI blood standard under both glucose clamp conditions and during an off-clamp meal challenge. That these differences are also clinically significant is suggested by results with the consensus error plots. In interpreting the results, the confounding of reference glucose with other factors—particularly time and rate of change—should be considered. Sensor performance changes over time and time-related changes in sensor performance can vary by sensor type. In this study designed to follow a particular pattern of reference glucose changes, glucose levels and rates of change were partially confounded with time.
The findings with the GOx-based sensor are consistent with the previous observations that GOx-based sensors require prolonged warm-up times, have suboptimal accuracy in the hypoglycemic range, need frequent calibration during the day, and are subject to interference by numerous endogenous and exogenous substances that affect oxidation current. 1,4 The BD GGBP sensor, which is a fluorescence-based, optical system rather than an electrochemical-based system, requires minimal warm-up as demonstrated in the current study. In addition, the BD GGBP sensor performs well in the hypoglycemic range—a finding consistent with the hyperbolic shape of the GGBP binding curve, the steepest part of which occurs at the lowest glucose values. Third, the BD GGBP sensor has minimal in vivo calibration requirements. In the current study, the BD GGBP sensor performed well with one in vivo calibration update after insertion, whereas the GOx-based sensor was calibrated three times after insertion in a manner consistent with product labeling. Going forward, it is anticipated that the commercial sensor will have lot calibration done at the factory followed by as little as one in vivo calibration. Sources of measurement error with GOx-based sensors include a rate-limiting oxygen deficiency in blood or ISF and the accumulation of oxidation by-products that can inhibit the enzyme and degrade its protective layer. 21 –24
The results for the time equilibrium constants for each sensor type show that there is a much more significant time shift associated with the ID sensor compared with those placed SC (14.3 min vs. 5.4 min). Despite this higher time constant, the ID sensors had better accuracy across all three glycemic zones compared with the GGBP sensors placed SC (Fig. 3). The additional importance of τ as a key parameter in the estimation of blood glucose was demonstrated by the relative accuracies of the sensors with and without it. The accuracy comparisons of the BD sensors to the GOx-based sensor are clearly impacted by the use of τ in the blood glucose estimation algorithm. When the time constant τ was used, MAPE was statistically significantly lower with the BD GGBP sensor versus the GOx-based sensor in all glycemic regions. Interpatient variability did not significantly contribute to variability in τ, a finding that is encouraging in suggesting that patient-specific τ values are not needed and that a commercial embodiment of the BD GGBP sensor may be able to incorporate a “factory” calibration scheme and default algorithm that provides accurate measurement in association with a one-time in vivo calibration.
The majority of these BD prototype GGBP sensors demonstrated reasonable in vivo longevity over a 12-h period, but a significant number of them lost signal intensity during the study with concomitant increase in glucose estimates (Fig. 6). Possible explanations for this loss of signal include disruption of the protein hydrogel matrix on insertion, degradation of protein in vivo, and obscuration of the optical path. While photobleaching can be a cause of signal loss in fluorescent systems, our preclinical studies have shown only a modest loss of signal after several hundred interrogations over 3 days in vitro (BD company data on file).
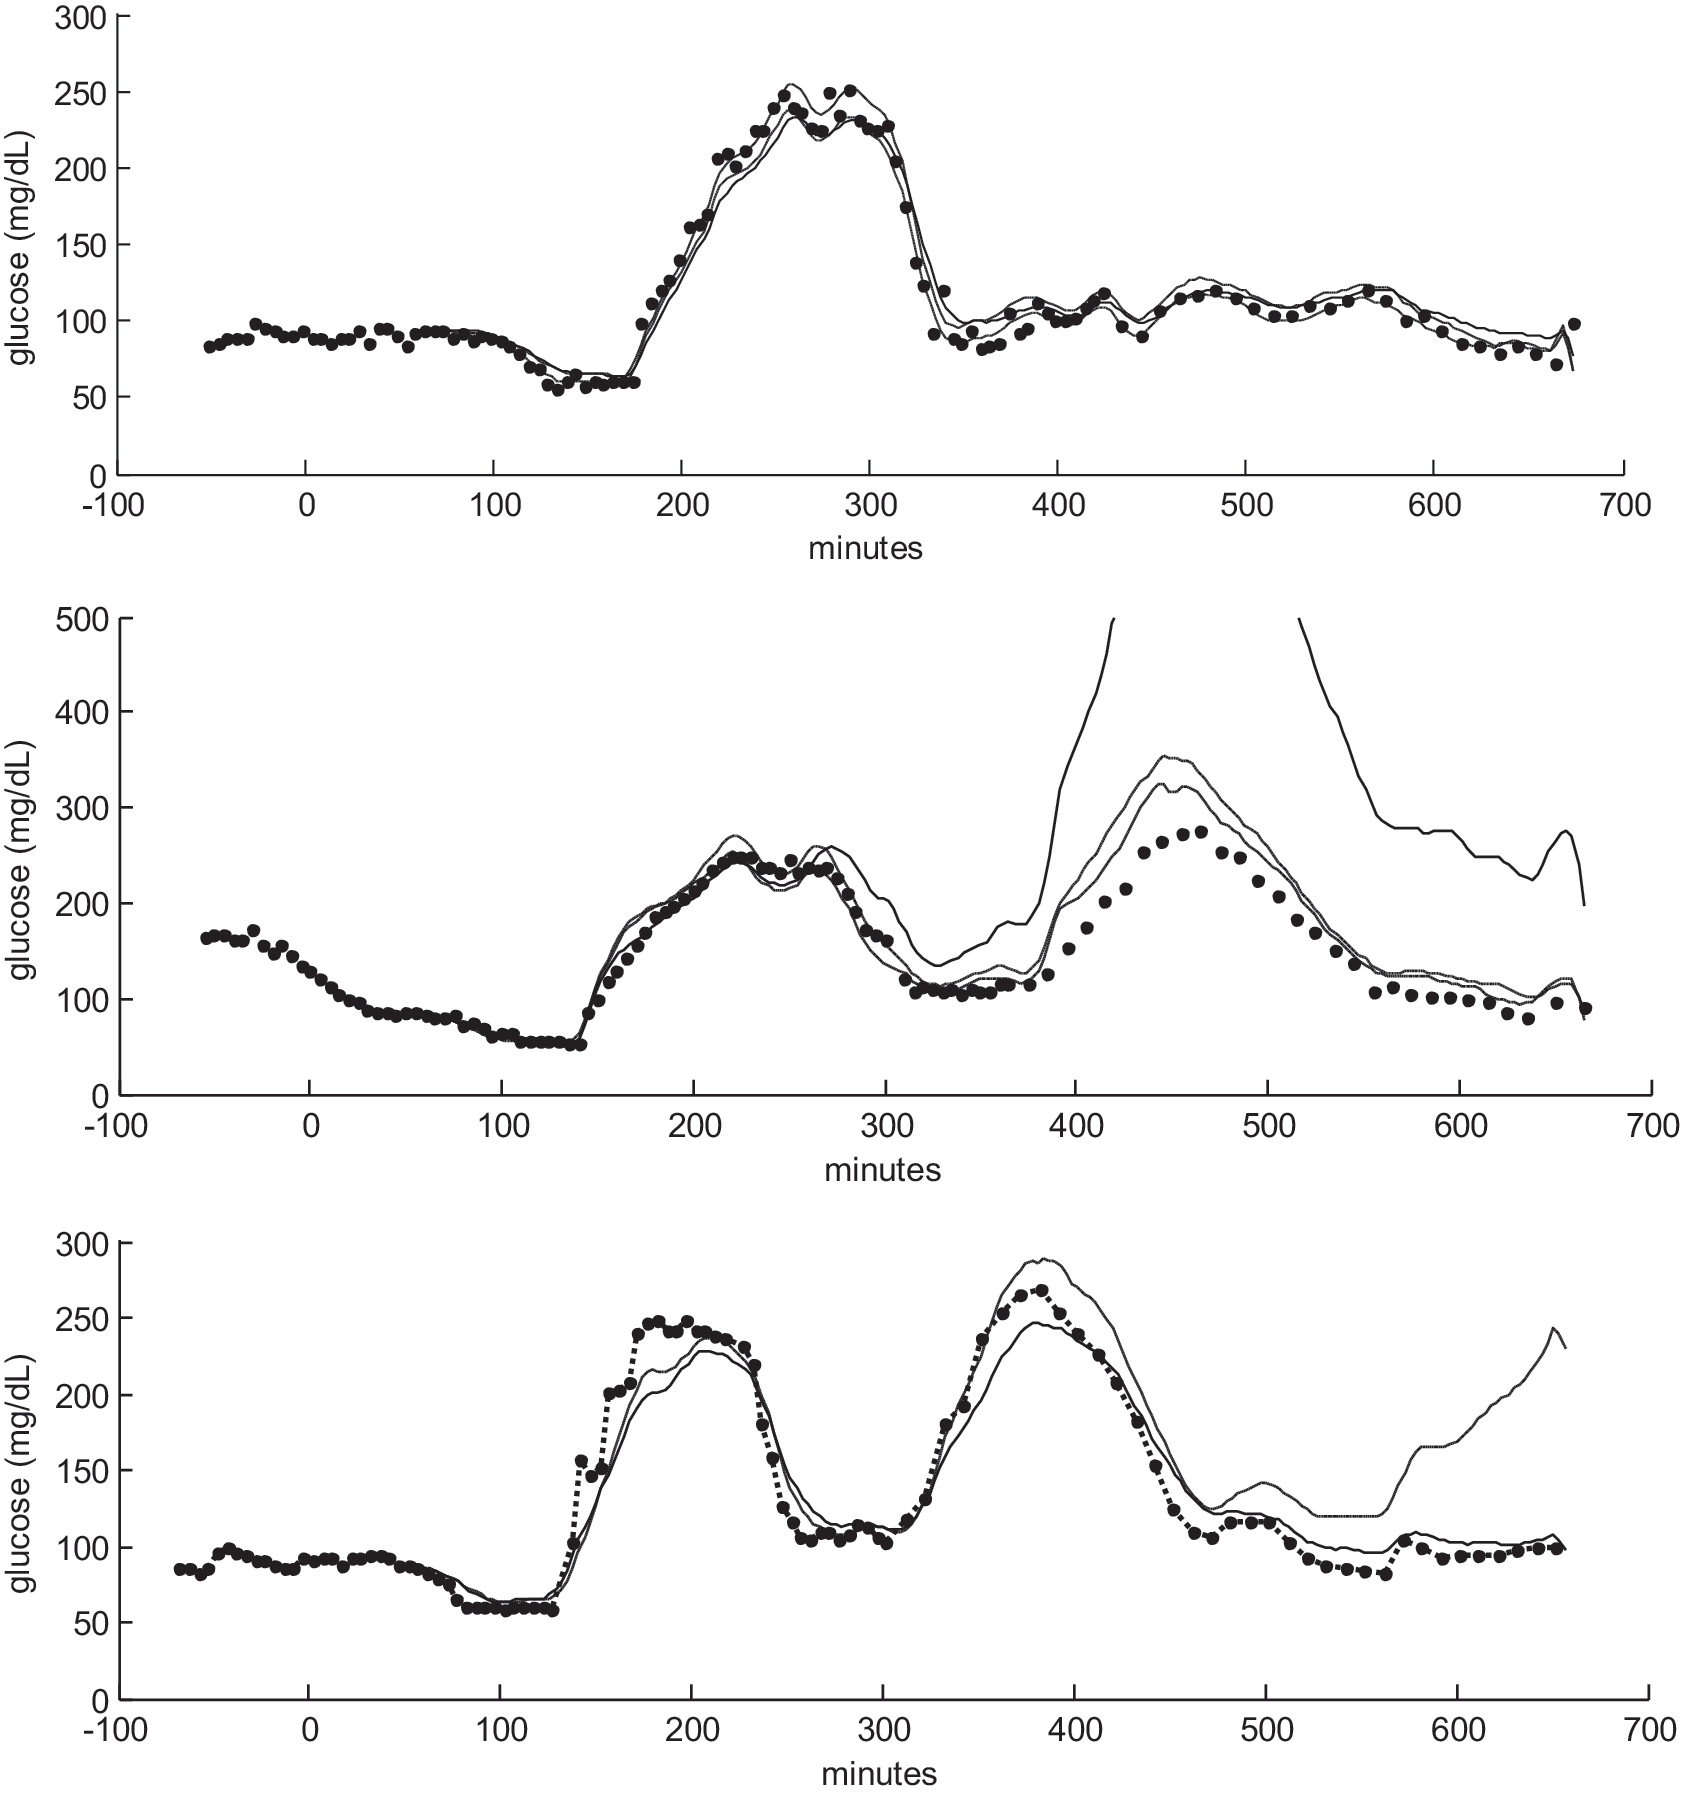
Sensor tracings for three subjects: (
There was no protective layer over the hydrogel matrix in this study. The addition of protective layers as well as enhanced chemical fixation of the matrix to the cannula is anticipated to enhance the longevity and robustness of the sensor.
Footnotes
Acknowledgments
The authors acknowledge the following individuals for their invaluable contributions throughout the GGBP project and the study reported herein: Terry Amiss, Andrew Atalig, Aldelberto Barba, Kara Birchfield, Jocelyn Brewster, Michael Cash, Wensheng Cai, Richard Clarke, Sarah Gabriel, Perry Haaland, Rick Klug, Emmanuel Nishanth, Jamie Reyes, Christian Sandmann, Douglas Sherman, and Diane Sutter. The authors also acknowledge Jane Saiers, Ph.D. (The WriteMedicine, Inc.) for assistance with writing this manuscript. Becton Dickinson funded Dr. Saiers' work.
Author Disclosure Statement
K.J., A.L., D.K., S.K., J.H., B.R., E.M., and K.W. are employed by BD Technologies, the maker of the BD GGBP sensor. L.M. and M.H. declare no competing financial interests.
This study has registration number NCT01093833 at Clinical