




Abstract
Background:
We assessed the reference change value (RCV) of currently available hemoglobin A1c (HbA1c) laboratory assays, which is defined as the critical difference between two consecutive HbA1c measurements representing a significant change in health status.
Methods:
We examined the individual laboratory coefficients of variation (CVs) in the Dutch/Belgian quality scheme based on 24 lyophilized samples and calculated the RCV per laboratory (n = 220) and per assay method. In addition, two pooled whole blood samples were sent to the participating laboratories. The individual laboratory results were compared to the assigned value ± an allowable total error (TEa) of 6%.
Results:
At HbA1c values of 41.0 mmol/mol (5.9%-Diabetes Control and Complications Trial [DCCT]) and 61.8 mmol/mol (7.8%-DCCT), 99% and 98%, respectively, of the laboratories reported a value within a TEa limit of 6%. The analytical CV of the HbA1c method used in 78% of the laboratories is <2.4%. The mean RCV at an HbA1c value of 53 mmol/mol (7.0%-DCCT) for methods of Bio-Rad is 5.9 mmol/mol (0.59%-DCCT); for Arkray/Menarini, 4.3 mmol/mol (0.43%-DCCT); for Roche, 6.5 mmol/mol (0.65%-DCCT); for Tosoh, 3.3 mmol/mol (0.33%-DCCT); and for other methods, 6.3 mmol/mol (0.63%-DCCT).
Conclusions:
The analytical performance of the majority of laboratory HbA1c methods is within the clinical requirements. However, based on the calculated RCV, 21.8% of the laboratories using different HbA1c methods are not able to distinguish an HbA1c result of 59 mmol/mol (7.5%-DCCT) from a previous HbA1c result of 53 mmol/mol (7.0%-DCCT). It can be presumed that differences in HbA1c results of 5 mmol/mol (0.5%-DCCT) do influence treatment decisions.
Introduction
From an analytical point of view, the difference between two serial HbA1c measurements depends on the coefficient of variation (CV): the intra-individual biological variation (CVw) and the analytical variation (CVa) of the HbA1c laboratory assay. These two sources of variation can be combined in the so-called reference change value (RCV), which is the critical difference in the change in a patient's serial test results that can be considered significantly different at a probability of 95%. 5,6 In other words, this means that if an RCV of 7.0 mmol/mol (0.7%-DCCT) HbA1c units is found, an HbA1c value of 58 mmol/mol (7.5%-DCCT) would not be significantly different from a previous HbA1c value of 53 mmol/mol (7.0%-DCCT).
Currently there are more than 30 HbA1c laboratory methods available on the market, and information on the analytical performance of each assay method may not be readily available. In addition, the same HbA1c assay may have different performance characteristics within and between various laboratories. External HbA1c quality schemes reveal average analytical performance of the different HbA1c methods used in the field and do not make available the results of individual laboratories to others besides the laboratory concerned. Indeed, the aggregated results, in general, indicate sufficient analytical performance of the majority of the methods but provide no insight in the performance of all laboratories individually. 7
The aim of the current study was to present the analytical performance of a large portion of available HbA1c laboratory assays currently available on the market, based on the individual results of the HbA1c values of the participating laboratories in the Dutch and Belgian external quality scheme. Moreover, the results of a separate ring survey with fresh whole blood are presented. Based on this information we calculated the RCV, which may aid the healthcare professional to interpret differences in serial HbA1c measurement results.
Research Design and Methods
The results of two External Quality Assurance Services (EQAS)—the Stichting Kwaliteitsbewaking Medische Laboratoria (SKML) in The Netherlands and the Wetenschappelijk Instituut voor de Volksgezondheid (WIV) in Belgium—and the results of a ring survey with two pooled fresh whole blood samples were used to assess the individual laboratory performance of various HbA1c laboratory methods. 8 Not all laboratories (n = 550) participated in the ring survey with two pooled fresh whole blood samples, and therefore only the results of the laboratories that submitted results in both surveys (SKML/WIV and fresh whole blood samples) were used (n = 220).
The design of the Dutch SKML and Belgian WIV scheme is based on 24 lyophilized interconnected samples. The samples are sent annually to all participating laboratories and stored at −20°C or below. Each sample is requested to be analyzed every fortnight, and the results are to be submitted to the website of SKML/WIV. The 24 samples were in fact 12 samples in duplicate. The duplicates were blinded to prevent any influence on results. From the duplicates the CVa was calculated, using the following formula:
where CVa is the analytical CV, Δ is the difference between duplicates, n is the number of duplicates, and
The CVa was used to calculate the RCV, which is the critical difference in the change in a patient's serial test results that can be considered significantly different at a probability of 95%. The RCV is calculated with the following formula:
5,6
where CVa is the analytical CV and CVw is the intra-individual or within-person biological CV.
For a healthcare provider to be able to conclude that a significant difference of 5.0 mmol/mol (0.5%-DCCT) at a medical decision point of 53 mmol/mol (7.0% DCCT) was caused by significant changes in glycemic control of a patient instead of analytical imprecision of the HbA1c method, the percentage RCV should be <7.1% ([0.5/7.0] × 100 = 7.1%). This RCV results in a CVa of 2.4% when applying a CVw of 1%. We used a CVw of 1%, in line with the data presented by Rohlfing et al., 9 who stated that in patients with diabetes, fluctuations in HbA1c levels are not random, but should be considered pathologic, i.e., caused by changes in glycemic state. Furthermore, we calculated the RCV with a CVw of 3.4%, in line with the data presented by Ricos et al. available on the Westgard website. 10 Based on the percentage RCV and the HbA1c medical decision point of 53 mmol/mol (7.0%-DCCT), the absolute RCVs of the various methods were derived (in mmol/mol and %-DCCT).
To avoid discussions about commutability of lyophilized samples for certain methods with respect to systematic error (bias), we used two pooled fresh whole blood samples that were sent halfway through the interval of the SKLM/WIV scheme (in May) to the laboratories, similar to the College of American Pathologists' (CAP) survey.
7
The values were assigned with five International Federation of Clinical Chemistry (IFCC) Secondary Reference Measurement procedures on two days in duplicate.
11
The acceptance limit of an allowable total error (TEa) of 6% was used.
12
TEa is calculated as follows:
Statistics
Computations were performed using Microsoft® Excel 2002 (Microsoft, Redmond, WA) software.
Results
Figures 1 and 2 show the results of the ring survey of two pooled fresh whole blood samples at respective HbA1c values of 41.0 mmol/mol (5.9%-DCCT) and 61.8 mmol/mol (7.8%-DCCT). Of the laboratories, 99% and 98%, respectively, met the criterion of TEa <6%.
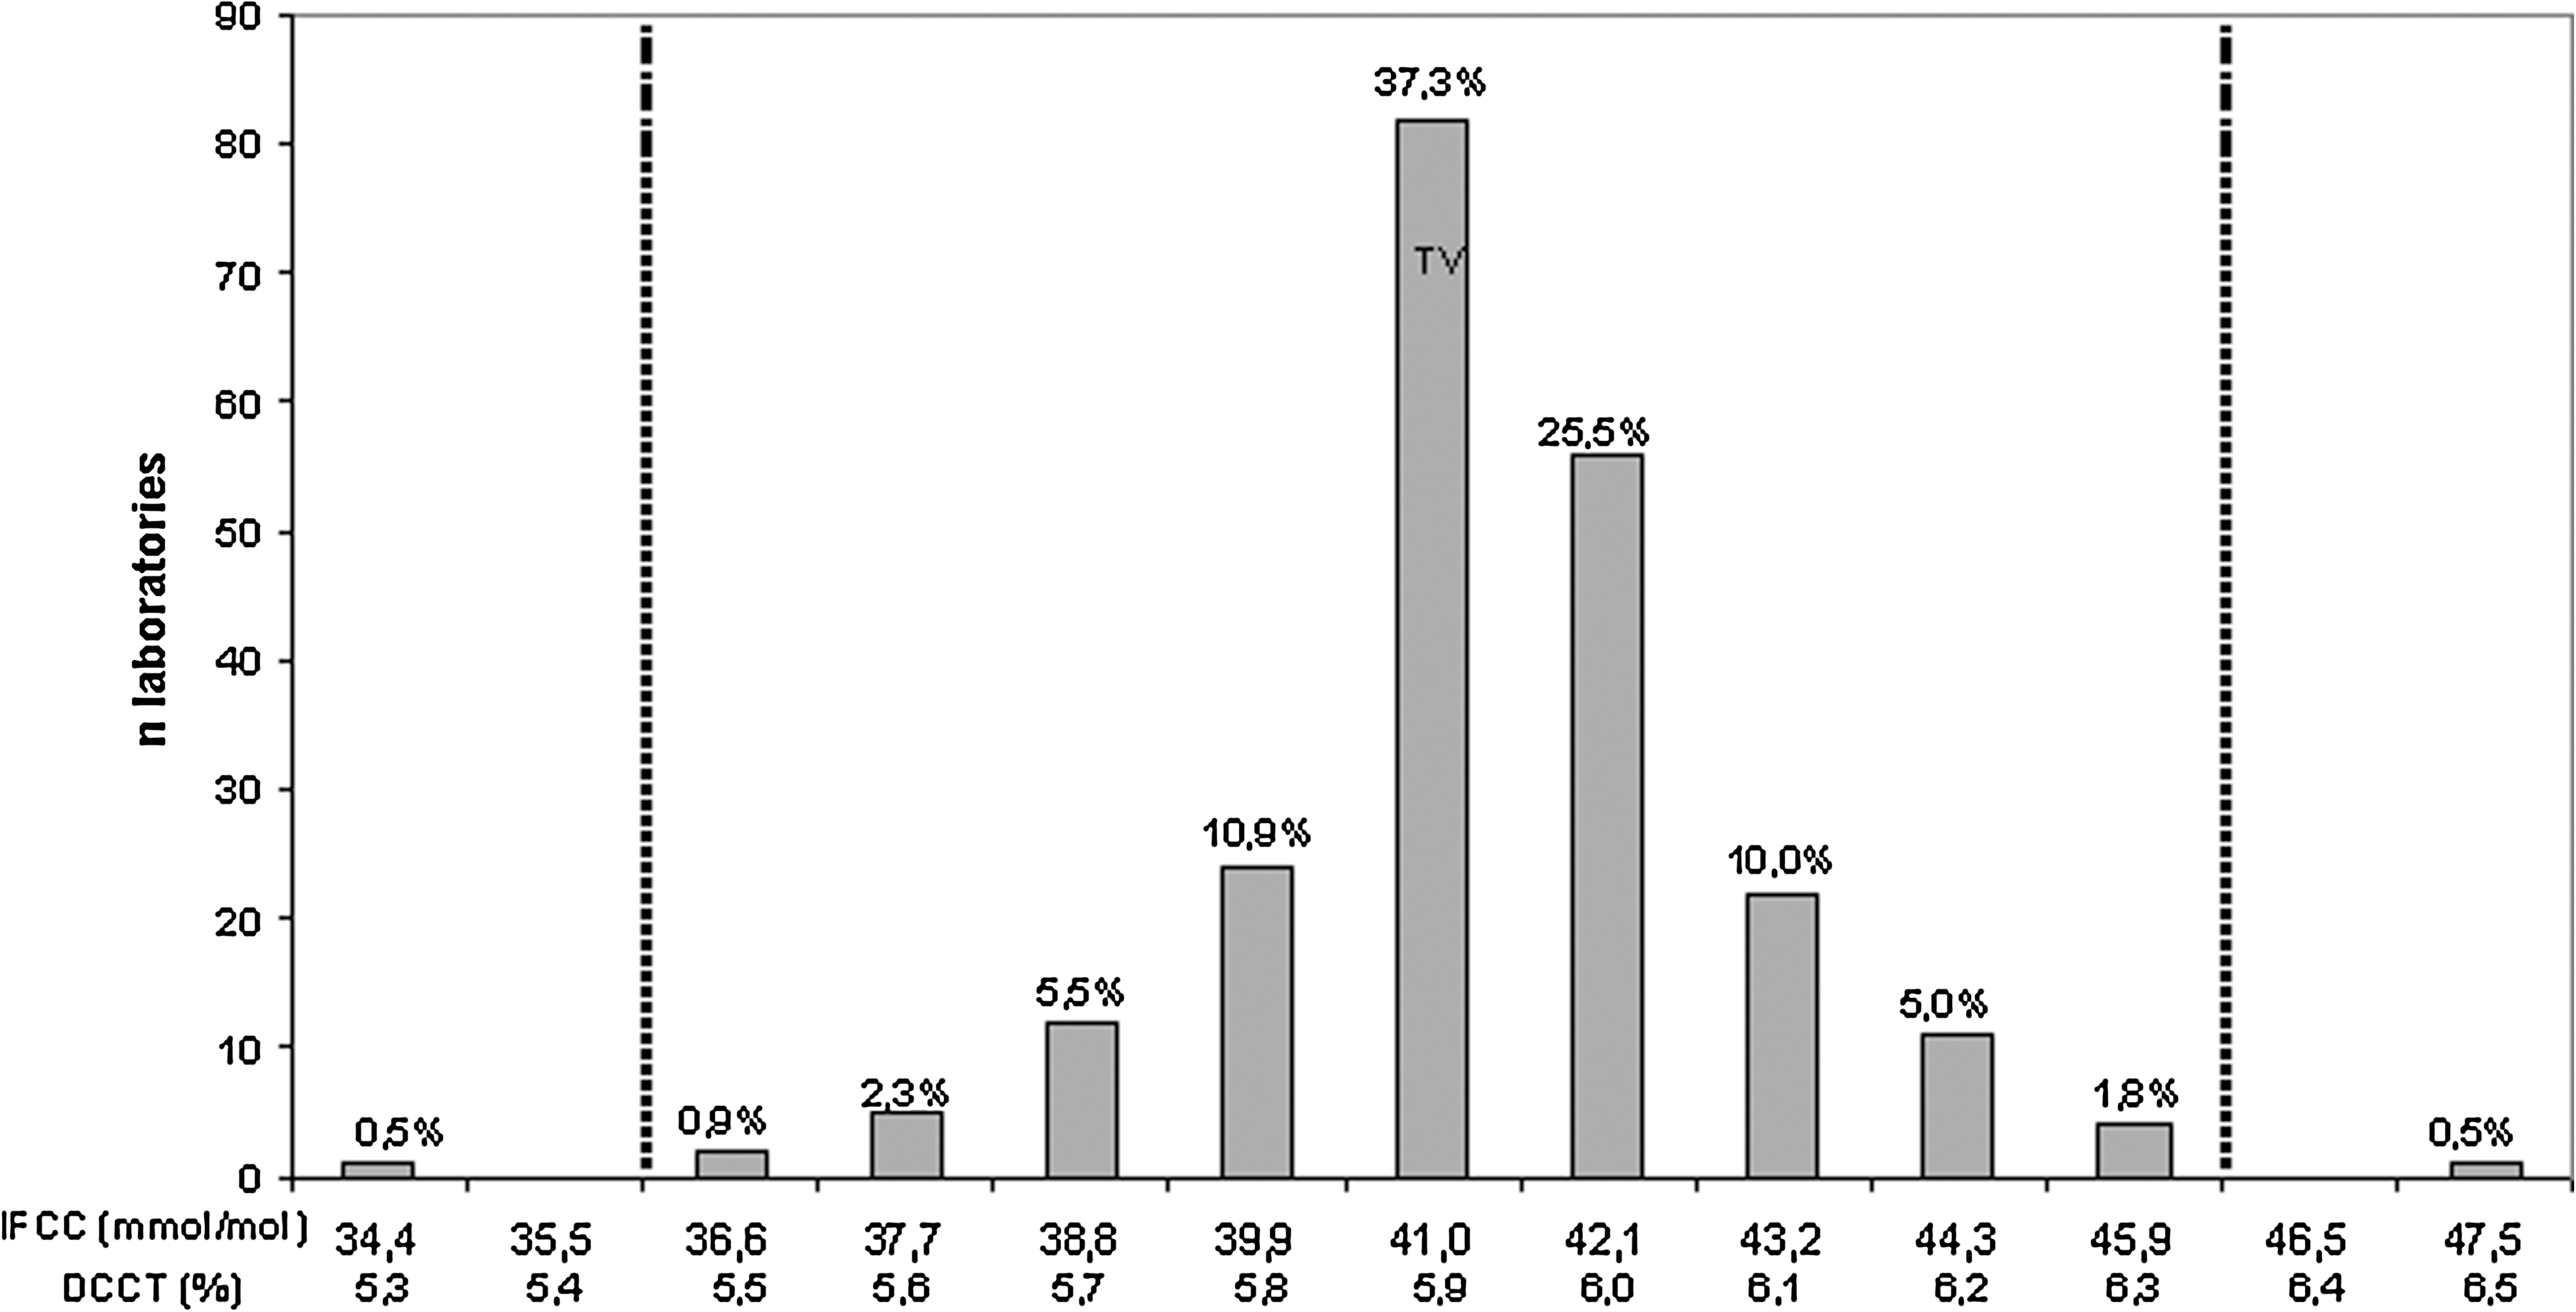
Measured hemoglobin A1c results compared with the target value (TV) of 41.0 mmol/mol (5.9%-Diabetes Control and Complications Trial [DCCT]) ± allowable total error of 6%. IFCC, International Federation of Clinical Chemistry.

Measured hemoglobin A1c results compared with the target value (TV) of 61.8 mmol/mol (7.8%-Diabetes Control and Complications Trial [DCCT]) ± allowable total error of 6%. IFCC, International Federation of Clinical Chemistry.
The calculated CVa in the SKML survey gives an impression of the CV used in the laboratory over a longer time, as both duplicate samples are assayed over a period of several months. Of the HbA1c laboratory methods, 69%, 78%, and 86% have a CVa of ≤2.0%, ≤2.4%, and ≤3.0%, respectively (Table 1). One of the remarkable findings is that 41.9% of the laboratories using immunoassays have a CVa >3.0% compared with only 10.4% of the laboratories using a high-performance liquid chromatography–based method.
Bio-Rad, Hercules, CA; Arkray/Menarini, Kyoto, Japan and Florence, Italy, respectively; Roche, Basel, Switzerland; Tosoh, Tokyo, Japan.
Whole blood and hemolysate mode.
Beckman Coulter (Brea, CA) Synchron LX, Beckman Unicel DxC, Siemens (Munich, Germany) Dimension RxL, Vitros® 5,1 FS (Johnson & Johnson, Raritan, NJ), Trinity Biotech (Bray, County Wicklow, Ireland) Ultra2 HPLC and PDQPlus, Roche Hitachi (902-911-912-Modular) Tina-quant.
CVa, analytical coefficient of variation; HPLC, high-performance liquid chromatography.
Table 2 shows the results of the mean and the range of the absolute RCVs calculated at an HbA1c value of 53 mmol/mol (7.0%-DCCT) with different intra-individual biological variations (1% and 3.4%). Fifty-nine percent of the laboratories using a method from Bio-Rad, 93% of the laboratories using a method from Arkray/Menarini, 42% of the laboratories using a method from Roche, and 95% of the laboratories using a method from Tosoh were able to meet the criterion of having a RCV of <7.1% at an HbA1c value of 53 mmol/mol (7.0%-DCCT) calculated with a CVw of 1%. Overall, almost 22% of the methods used in laboratories were not able to distinguish an HbA1c result of 59 mmol/mol (7.5%-DCCT) from a previous HbA1c result of 53 mmol/mol (7.0%-DCCT). This means that one in five laboratories using various HbA1c methods do not meet the criteria for optimal diabetes care management.
For clarity of presentation, only Diabetes Control and Complications Trial (DCCT) values are shown. Bio-Rad, Hercules, CA; Arkray/Menarini, Kyoto, Japan and Florence, Italy, respectively; Roche, Basel, Switzerland; Tosoh, Tokyo, Japan.
Whole blood and hemolysate mode.
Beckman Coulter (Brea, CA) Synchron LX, Beckman Unicel DxC, Siemens (Munich, Germany) Dimension RxL, Vitros® 5,1 FS (Johnson & Johnson, Raritan, NJ), Trinity Biotech (Bray, County Wicklow, Ireland) Ultra2 HPLC and PDQPlus, Roche Hitachi (902-911-912-Modular) Tina-quant.
CV, coefficient of variation; CVw, intra-individual biological CV; HPLC, high-performance liquid chromatography; RCV, reference change value.
Discussion
In this study we derived the CVa from the individual participating laboratories in the Dutch SKML/Belgian WIV external quality scheme. Almost every laboratory was able to report HbA1c results within a TEa limit of 6%. However, based on the calculated RCVs, almost 22% of HbA1c methods are not able to distinguish an HbA1c result of 59 mmol/mol (7.5%-DCCT) from a previous HbA1c result of 53 mmol/mol (7.0%-DCCT). This may have a profound impact on the management of patients with diabetes if changes in medication are made due to changes in serial HbA1c measurements. Indeed, the International Diabetes Federation recommends starting insulin therapy above an HbA1c value 58 mmol/mol (7.5%-DCCT), 13 and the ADA/EASD consensus statement states that therapy changes should be initiated if HbA1c levels are above 53 mmol/mol (7.0%-DCCT). 4 However, if the analytical variability of the laboratory assay is >2.4%, corresponding to an RCV of >5.0 mmol/mol (>0.5%-DCCT), a clear distinction based on patient health status between 53 mmol/mol (7.0%-DCCT) and 58 mmol/mol (7.5%-DCCT) is not possible. It is important that the limitations of current HbA1c laboratory methods are understood by healthcare professionals as these may have important clinical implications.
The design of the Dutch/Belgian SKML/WIV scheme differs in approach compared with the CAP survey. The CAP survey sends three fresh pooled samples to all participating laboratories twice a year. Results are presented per method, number of laboratories applying that method, mean bias, and inter-method/laboratory CV. The current CAP acceptance limit is 8% but will be tightened to 6% in the future. 12 The design of the Dutch SKML/Belgian WIV scheme is based on 24 lyophilized interconnected samples. The advantage of lyophilized samples is the long-term stability; therefore, analytical variation can be determined over a longer period of time. However, the best way to assess the RCV is with controls, based on patient material, analyzed daily on the HbA1c instrument. The results of the two pooled fresh whole blood samples showed sufficient analytical performance of almost every method used in a laboratory based on a TEa of 6%. Although a CVa of 3% is a realistic goal, a value of less than 2% is definitely desirable. 14 –16 Indeed, our results suggest that a value of less than 2.4% should be implemented in order to be able to detect changes in HbA1c levels of 5.0 mmol/mol (0.5%-DCCT).
We chose to use a CVw of 1% to calculate the RCV. On the Westgard website 10 Ricos et al. presented a CVw of 3.4%. Applying a CVw of 3.4% results in an absolute RCV of 6.6 mmol/mol (0.66%-DCCT) at a medical decision point of 53 mmol/mol (7.0%-DCCT) without taking into account analytical variation. Rohlfing et al. 9 suggested a CVw of <1%, which seems more appropriate and was also supported by our own data (E.L.-W., unpublished data). Hence, a CVw of 3.4% implies that the CVa could not have a significant impact on the RCV, and therefore changes in serial HbA1c would mostly rely on biological variation, which seems unlikely.
Conclusions
Thus, the analytical performance of some HbA1c methods is not accurate enough to sufficiently support treatment decisions in the management of patients with diabetes when differences in serial HbA1c measurements amount to 5 mmol/mol (0.5%-DCCT) or less. ADA guidelines for treatment of patients with diabetes may assume higher-quality laboratory testing than might be available in the real world. Laboratories using methods with a CVa >2.4% should consider changing to a method with better precision. In our opinion, the laboratory-specific RCV should be provided to the healthcare professional in order to make this professional aware of the fact that changes in serial HbA1c results might not be caused by true changes in the degree of glucose control, but also may be due to the variability of the method used to measure HbA1c in a specific laboratory.
Footnotes
Acknowledgments
This manuscript could not have been written without having the results of the Dutch SKML and Belgian WIV. We thank the SKML and WIV for sharing these results with us.
Author Disclosure Statement
No competing financial interests exist.