
Abstract
Background:
Previous studies have shown that at the near steady state attained by slow insulin infusion, the local glycemia of subcutaneous fluid tracks the venous glucose concentration (i.e., it is not perturbed by the infusion of insulin). Here we test whether the subcutaneous glycemia near the site of injection of a bolus of insulin is perturbed by the injection in the minipig model without diabetes.
Methods:
A bolus of short-acting diluted insulin was administered in the animal's flank while three to five continuous glucose monitoring systems measured the subcutaneous glucose concentrations at 0.5, 1, 2, and 3 cm (“near sensors”) and at 10–15 cm (“far sensors”) from the injection site.
Results:
We found no statistically significant (P < 0.05) evidence that near and far sensors differ in response time, that is, the elapsed time to onset of signal drop or the elapsed time to minimum signal following insulin injection. We found mixed evidence that near and far sensors differ in the percentage drops at the glycemic minimum. The near versus far difference for near sensors at 0.5 and 3 cm from the injection site was statistically significant (P < 0.05): the average percentage drops for these near sensors were 3% and 11%, respectively, below those for far sensors. We did not find evidence of a difference for near sensors at 1 and 2 cm.
Conclusions:
Because there is some evidence that insulin injection can cause a minor perturbation (about ≤10%) in the local glycemia, caution is warranted when co-locating glucose sensing and insulin injection sites.
Introduction
In the past, the pharmacodynamics of insulin were thought to pose a significant barrier to a co-located system due to insulin effects at the administration site. 9 If insulin infusion in the immediate vicinity of a glucose sensor transiently increased the difference between local ISF glycemia and plasma glycemia, it would degrade sensor accuracy. 10 –12 Lindpointer et al. 10,11 studied the feasibility of estimating plasma glucose concentrations from glucose levels obtained directly at the site of subcutaneous insulin administration in subjects with diabetes and found that there was no statistically significant perturbation of local glycemia by slowly infused insulin. They sampled the ISF after 60 min of continuous insulin infusion, a period long enough to allow equilibration of the tissue and plasma glucose concentrations. Hermanides et al. 12 compared subcutaneous and plasma glucose readings using microdialysis sensors at 10 cm and 0.9 cm from an insulin infusion site in 10 patients with diabetes. They compared the average difference in glucose levels over a period of several hours and found no significant difference between near and far sensor readings but reported a difference of about 5 min between the response times of the near versus far sensors.
The purpose of our present study was to characterize the effect of a subcutaneous insulin injection on proximal ISF glucose concentrations, monitored by a group of Freestyle Navigator® (Abbott Diabetes Care, Alameda, CA) CGM sensors located at various distances from the site of insulin injection. 13 For the past 5 years our laboratory has tested CGM sensors in 4–12-week-old minipigs. The outputs of simultaneously worn sensors were found to be well correlated and properly recorded feeding-associated increases and insulin injection-associated declines in glycemia. Metabolic research and testing of insulin and analogs have been done extensively in minipigs because of their physiological similarity to humans in both bodily glucose dynamics and absorption of insulin from subcutaneous tissue. 14 –20
Materials and Methods
The study was done with 10 young (4–12 weeks and 3.5–16 kg) Sinclair minipigs (Sinclair Research, Columbia, MO) without diabetes. The minipigs were provided water ad libitum and were fed approximately 300 g of Mazuri MiniPig Youth chow (Northwood International LLC, Brentwood, MO) twice daily. The minipig housing at the University of Texas Animal Resources Center (Austin, TX) was in compliance with the National Institutes of Health's Guide for the Care and Use of Laboratory Animals. The Institutional Animal Care and Use Committee of the University of Texas approved all protocols. During the implantation of the sterile sensors the minipigs were anesthetized with isoflurane.
To monitor ISF glucose, three or five FreeStyle Navigator CGM sensors were implanted in the minipig, at distances of 5 mm, 1 cm, 2 cm, and/or 3 cm from the intended insulin injection site in the upper flank and at the opposite side of the spine at 10–15 cm removed from the injection site (Fig. 1). For sensors at 1, 2, or 3 cm we performed approximately 10 tests each; for sensors at 5 mm we performed only four tests. The quantity of data for 5 mm is smaller because this test series was added late in the study to maximize the information obtained from the animals.
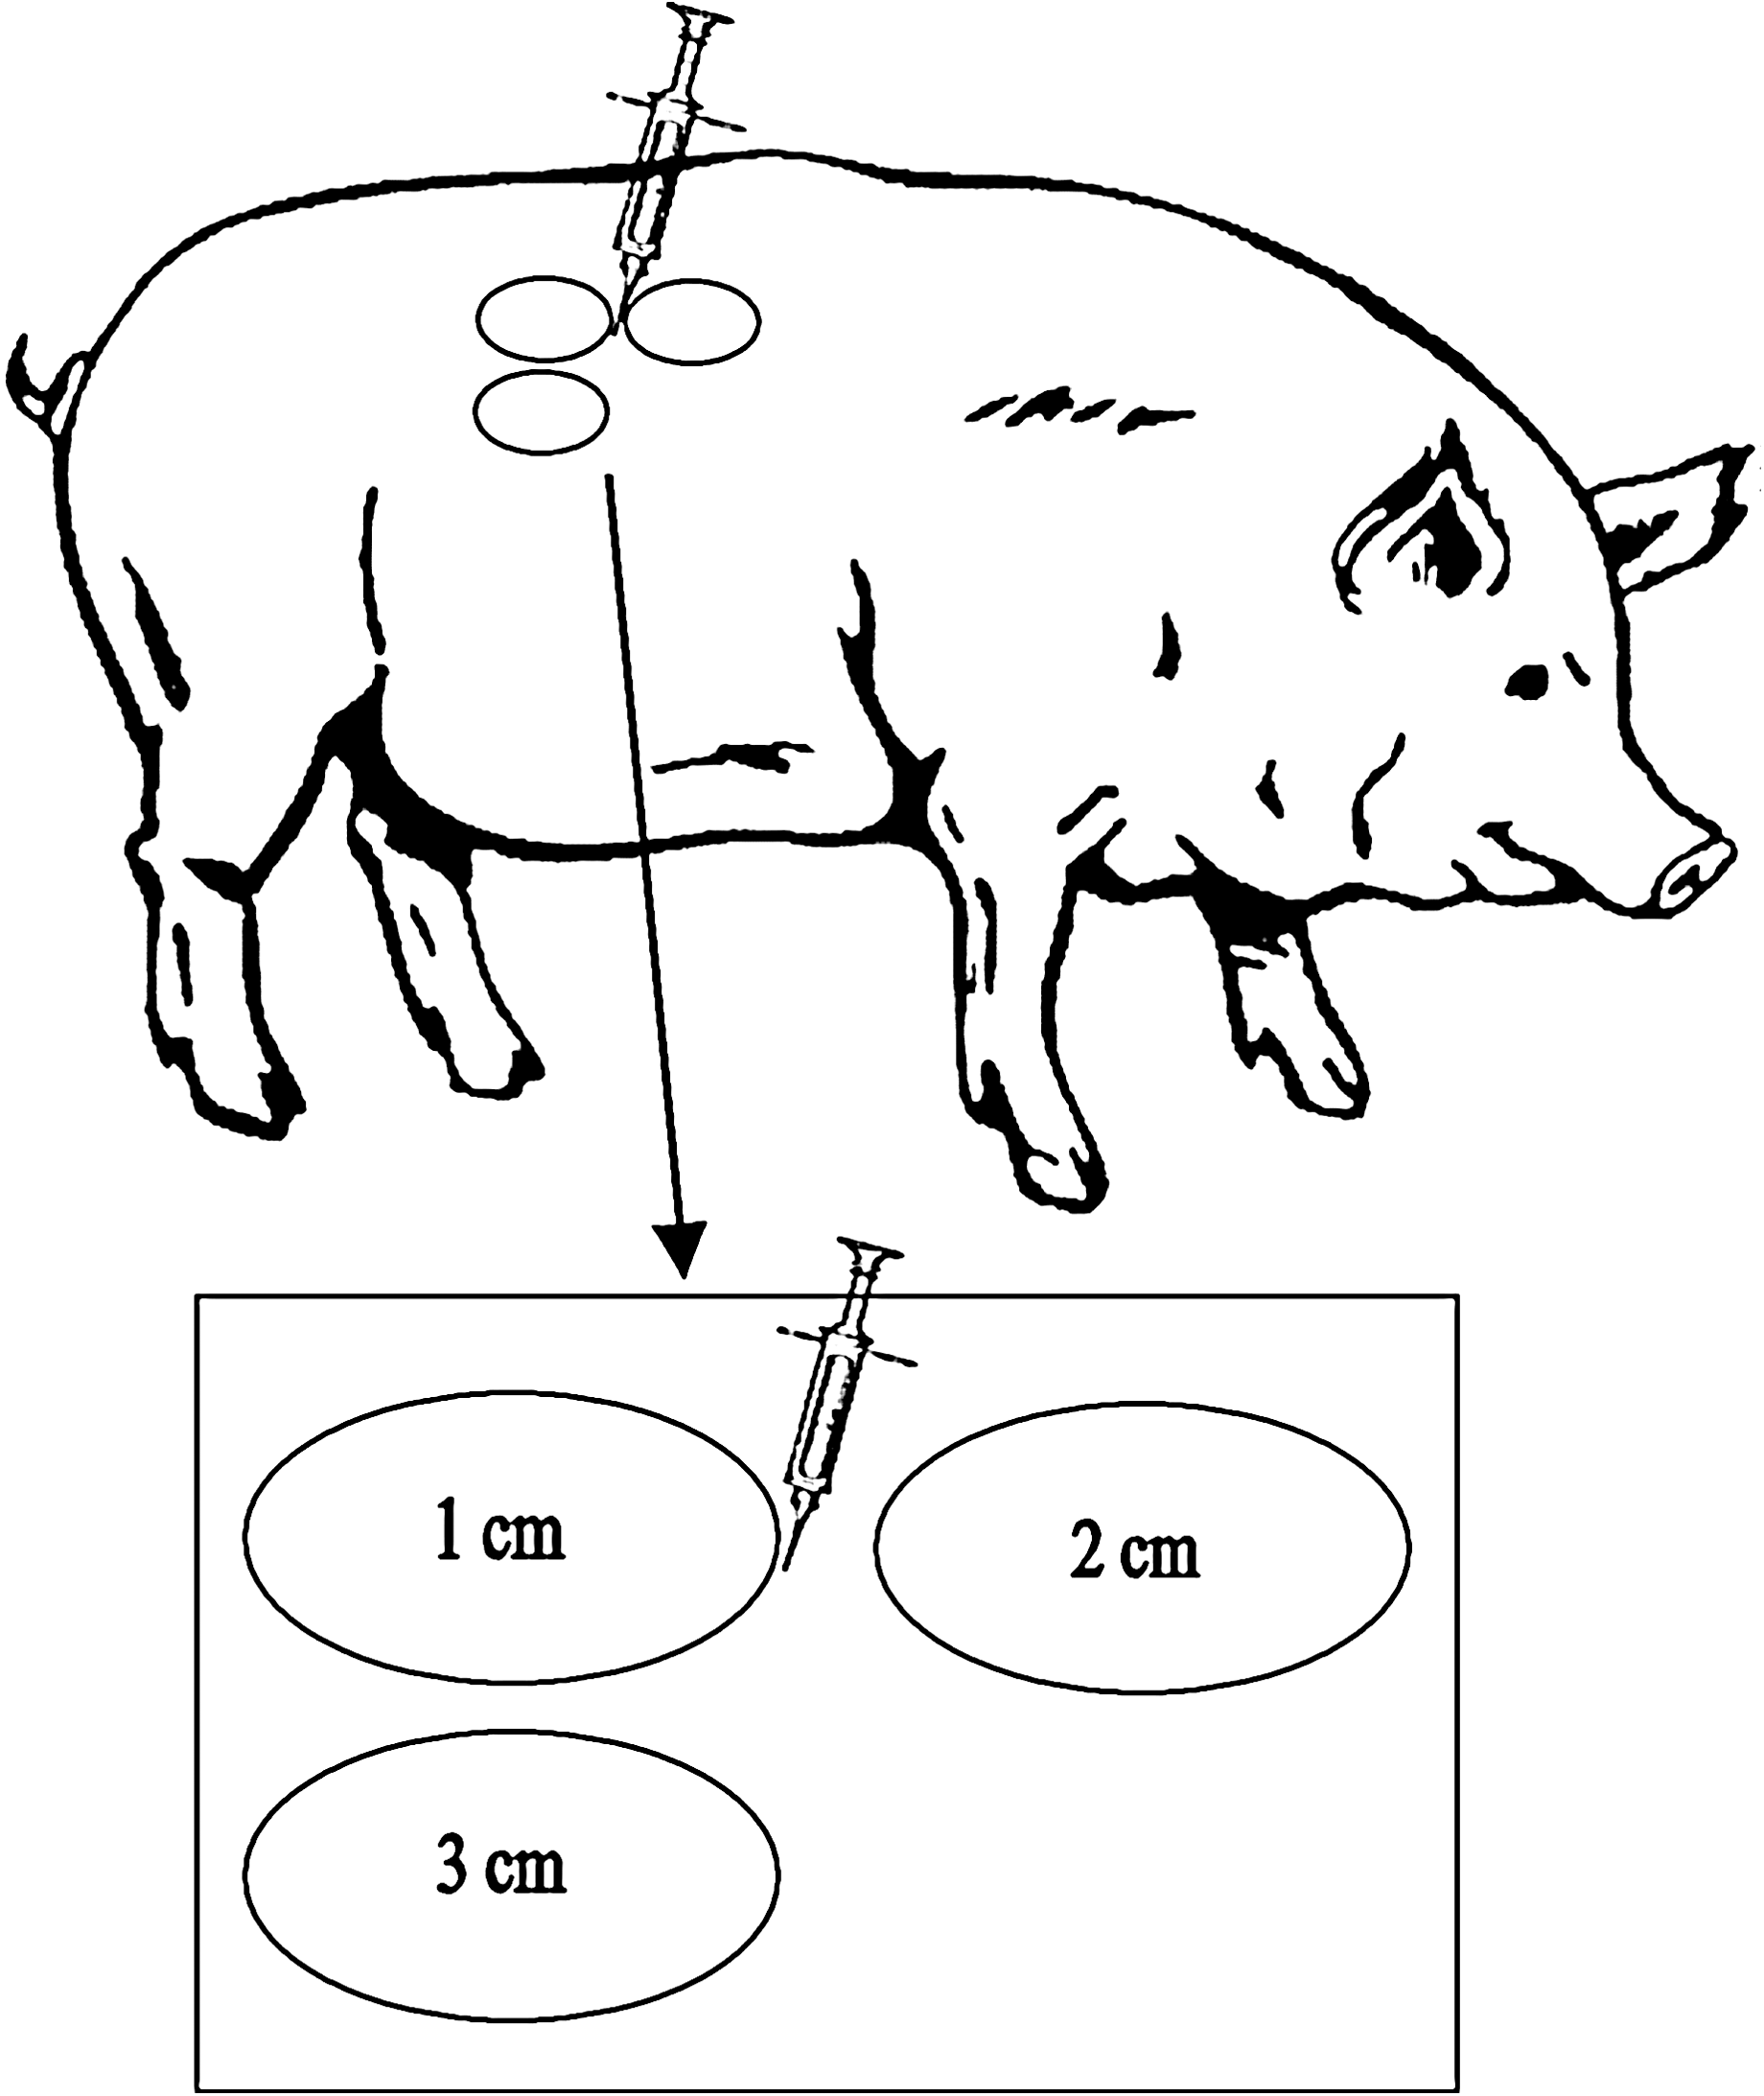
Diagram of the relationship between glucose sensors and insulin injection site.
Following implantation of the sensors the minipigs were returned to normal activity for a day. The following day, minipigs were fed at approximately 8:00 a.m. and then received an insulin injection at approximately 11:00 a.m. when their glycemia was steady. A single dose of 0.2 IU/kg short-acting insulin aspart (Novorapid®, Novo Nordisk, Bagsvaerd, Denmark) was injected at the predetermined site. For more accurate dosing, the insulin was diluted 1:10 with sterile water, yielding a total volume of 60–190 μL. Such dilution of injected insulin is practiced in diabetic neonates and in small animals. 21 The minipigs were fed approximately 1 h after injection. The time of injection and subsequent feeding were synchronized with the CGM clocks.
Figure 2 shows the current outputs for sensors in a typical experiment. Because the sensors cannot be conveniently calibrated in vivo in minipigs, their current signals were analyzed. Although their current signals varied linearly with glycemia, their absolute currents differed. For this reason, the percentage change in current, rather than the absolute change, was used for analyzing the data. The analysis involved determination of the currents at the times of insulin injection, onset of the glycemic drop, and glycemic minimum. The onset of glycemic drop was defined as the beginning of a protracted decline in glucose signal levels after peak signal level after insulin injection (see Fig. 2). The glycemic minimum was defined as the beginning of recovery of glycemia to normal levels, usually approximately 30 min after injection.

Current signals of implanted glucose sensors during an example test. Times and signal levels at the points indicated (insulin injection, the onset of signal drop, and the minimum signal after injection) were determined for analysis of the effect of sensor–injection distance. Note that this figure is in grayscale; a color version is in Supplementary Data at
The elapsed time between the insulin injection and the onset of the glycemic drop (Δt
e) in the experiments varied between 2 and 27 min among the runs (see Supplementary Fig. S1; Supplementary Data are available online at
Results and Discussion
Table 1 and Supplementary Fig. S2 address the question whether the elapsed time between the insulin injection and the onset of the glycemic drop differs for sensors near (0.5, 1, 2, and 3 cm) and far (10–15 cm) from the insulin injection site. The majority of the data points (19 of 34) clustered within 1 SD (SD approximately 1 min) of (far Δt e–near Δt e) = 0, indicating that the majority of the two groups of sensors responded to insulin statistically simultaneously, not in a distance-dependent manner. Some data points were considerably displaced from (far – near) = 0 (see Supplementary Fig. S2). Obtaining some deviant data points has been fairly typical in our animal testing. Lacking an experimental rationale for declaring them outliers, we have retained them all for the statistical analysis. The top half of Table 1 summarizes a matched-pair t test to determine whether, within an experiment, the (far Δt e – near Δt e) of a near sensor differed from that of its far sensor counterpart. The mean differences (far – near) were similar to the SE, and none of the differences was significant at the P < 0.05 level. For sensors at 1, 2, and 3 cm, the mean differences were small, between +1 and −1 min. For sensors at 5 mm the mean difference was negative; this is discussed below. The bottom half of Table 1 summarizes a binomial (sign) test to determine whether onset occurred in nearer sensors before or after their test-mate far sensors (i.e., was the onset of the glycemic drop for the near sensor consistently before or after that for the far sensor, regardless of Δt e values). There was no statistically significant ordering for sensors at 0.5, 1, and 2 cm distances, but for sensors at 3 cm there was ordering: onset started first at the near sensor in six out of nine tests. Although the 3 cm result approaches statistical significance (P < 0.05), it is unsupported by results for the 0.5, 1, and 2 cm sensors.
The top half of the table summarizes a matched-pair t test to determine whether the reaction time of near sensors differs from that of their test-mate far sensor. The bottom half summarizes a binomial (sign) test to determine whether near sensors react before their test-mate far sensor (i.e., whether their responses were ordered) regardless of their reaction time value.
Table 2 and Supplementary Figure S3 address the question whether the elapsed times between injection and postinjection glycemic minima (Δt min) differ for near and far sensors. Most of the data points (25 of 38) clustered within 1–2 SDs (SD approximately 1 min, again) of (far Δt min – near Δt min) = 0, indicating that most of the near sensors and test-mate far sensors reached the glycemic minima statistically simultaneously. Some data points were considerably displaced from (far – near) = 0 (see Supplementary Fig. S3). All points were retained for the statistical analysis. The top half of Table 2 summarizes a matched-pair t test to determine whether the (far Δt min – near Δt min) for near sensors differed from that of their test-mate far sensor. For the 0.5, 1, and 3 cm sensors, the mean difference was similar to the SE (1–1.5 min), with only the mean difference for the 2 cm sensors (2.4 min) exceeding the SE and approaching statistical significance. The anomalous behavior of sensors at 5 mm continued: their mean difference was negative (i.e., their Δt min times were longer than those of their remote test-mates). The bottom half of Table 2 summarizes a binomial (sign) test to determine whether near sensors reached signal minimum before their test-mate far sensor (i.e., whether the Δt min values were ordered by distance). The ordering, if any, was statistically insignificant.
The top half of the table summarizes a matched-pair t test to determine whether the time to signal minimum of near sensors differs from that of their test-mate far sensor. The bottom half of the table summarizes a binomial (sign) test to determine whether near sensors reach signal minimum before their test-mate far sensor (i.e., whether their responses were ordered, regardless of the time value).
Sensors at 5 mm showed, on average, a delayed onset of signal drop (2 min) and also a delayed signal minimum (1.8 min) relative to far sensors. We have called this “anomalous” because one might have expected that the higher concentration of insulin at the nearest sensor site would accelerate, not decelerate, the local glycemic drop. One plausible explanation is dilution of local glucose by the bolus volume injected. At the distance of 5 mm the injected volume of insulin and water may perturb the local glycemia by transiently diluting the glucose, as shown by Lindpointer et al. 10
Table 3 and Supplementary Figure S4 address the question whether the difference in glucose signal drop percentage (Δs min = 100 × [signal at onset – signal at minimum] ÷ signal at injection) differs for the near and the far sensors (i.e., near percentage drop – far percentage drop). The high proportion of data points (25 of 38) within 1–2 SDs (SD = 12%) of (near Δs min – far Δs min) = 0 indicates that the percentage drop for most near sensors was essentially the same as for their test-mate far sensors. Some data points were considerably displaced from (near Δs min – far Δs min) = 0 (see Supplementary Fig. S4). All points were retained for the statistical analysis. The top half of Table 3 summarizes the matched-pair t test to determine whether the percentage drop of near sensors differed from that of their test-mate far sensor. For the 0.5, 1, and 3 cm sensors, the mean difference (near – far) was negative, and for the 0.5 and 3 cm sensors this difference was substantially greater than the SE and statistically significant (P < 0.05). The mean difference was positive only for the 2 cm sensor; this was the result of a single point (the 2 cm sensor in Test 10). The bottom half of Table 3 summarizes the binomial (sign) test to determine whether near sensors consistently dropped less than their test-mate far sensor, regardless of the percentage value. The sign test agreed with the t test: the 0.5 and 3 cm sensors dropped less than their remote test-mates.
The top half of the table summarizes the matched-pair t test to determine whether the percentage drop of near sensors differed from that of their test-mate far sensor. The bottom half of the table summarizes the binomial (sign) test to determine whether near sensors dropped further than their test-mate far sensor (i.e., whether their responses were ordered, regardless of the percentage value).
Conclusions
Using CGM sensors in minipigs we measured local glycemia after injection of diluted insulin, and we used this information to determine whether sensors near the injection site behaved differently from sensors far from the injection. Possible differences between diluted and full-strength insulin were not investigated in this study. Lindpointer et al. 10,11 and Hermanides et al. 12 used undiluted insulin in their studies. The former found no statistically significant perturbation of local glycemia by slowly infused insulin. The latter found no significant difference in glucose levels between near (0.9 cm) and far (10 cm) sensors but reported about a difference of 5 min between the response times of the near versus far sensors.
The null hypothesis was that the near and far sensors did not behave differently; the alternate hypothesis was that they did differ. We found no statistically significant (P < 0.05) evidence that near and far sensors differ in response time, that is, the elapsed time to onset of signal drop or the elapsed time to minimum signal following insulin injection. The average time differences between near and far sensors ranged from approximately 2 min early to approximately 2 min late, with an SE of approximately 1.5 min. We found mixed evidence that near and far sensors differ in the percentage drops at the glycemic minimum. The difference for near sensors at 0.5 and 3 cm and sensors far from the injection site was statistically significant (P < 0.05): the average percentage drops for these near sensors were 3% and 11%, respectively, below those for far sensors. (Note that n = 4 for 0.5 cm sensors.) To put these differences in perspective, Weinstein et al. 13 found a 10% coefficient of variation between two sensors worn by the same person in a massive clinical trial of the FreeStyle Navigator, and King et al. 22 found a 10% median absolute relative deviation for the Minimed CGMS Gold (Medtronic Minimed, Northridge, CA). We did not find evidence of difference for sensors at 1 and 2 cm. Because there is some evidence that insulin injection can cause a minor perturbation (about ≤10%) in the local glycemia, caution is warranted when co-locating glucose sensing and insulin injection sites.
Footnotes
Acknowledgments
We thank our colleagues at the Animal Resources Center at the University of Texas for their help with the animal experiments, Abbott Diabetes Care for the FreeStyle Navigator CGM systems used, and the reviewers for useful comments that improved the article.
Author Disclosure Statement
This work and all authors were supported by royalties paid by Abbott Diabetes Care to the University of Texas. A.H. consults to Abbott Diabetes Care.
References
Supplementary Material
Please find the following supplemental material available below.
For Open Access articles published under a Creative Commons License, all supplemental material carries the same license as the article it is associated with.
For non-Open Access articles published, all supplemental material carries a non-exclusive license, and permission requests for re-use of supplemental material or any part of supplemental material shall be sent directly to the copyright owner as specified in the copyright notice associated with the article.