
Abstract
Background:
The aim of the present study was to examine symptoms of hypoglycemia, to develop a method to quantify individual differences in the consistency of symptom reporting, and to investigate which factors affect these differences.
Methods:
Participants recorded their symptoms with every episode of hypoglycemia over a 9–12-month period. A novel logistic-type latent variable model was developed to quantify the consistency of each individual's symptom complex and was used to analyze data from 59 subjects (median age, 57.5 years [range, 22–74 years], 65% male, 77% type 1 diabetes) who had experienced 19 or more hypoglycemic episodes. The association between the calculated consistency parameter and age, sex, type and duration of diabetes, and C-peptide and serum angiotensin converting enzyme concentration was examined using a generalized linear model. Analyses were performed under a Bayesian framework, using Markov chain Monte-Carlo methodology.
Results:
Individuals exhibited substantial differences in between-episode consistency of their symptom reports, with only a small number of individuals exhibiting high levels of consistency. Men were more consistent than women. No other factors affected consistency in patients with normal hypoglycemia awareness.
Conclusions:
By using a novel stochastic model as a quantitative tool to compare the consistency of hypoglycemic symptom reporting, much greater intra-individual variability in symptom reporting was identified than has been recognized previously. This is relevant when instructing patients on identification of hypoglycemic symptoms and in interpreting symptomatic responses during experimentally induced hypoglycemia.
Introduction
When educating patients about the recognition of hypoglycemia, it is important to consider factors that may cause variation in their symptoms. Hypoglycemic symptoms are age-specific, in that young children have difficulty recognizing hypoglycemia 3 and often exhibit behavioral changes, 4,5 whereas neurological symptoms are prominent in elderly patients. 6 The symptom profile does not differ between type 1 diabetes and insulin-treated type 2 diabetes. 7 –9 Neither the causative agent (insulin or tolbutamide) 10 nor the patient's gender 11 influences the nature of the symptoms experienced during hypoglycemia.
Some hypoglycemia-related symptoms may be more reliably associated with blood glucose levels than others, and a given symptom is not equally predictive of hypoglycemia in everybody, 12 suggesting a degree of between-subject variability. It is accepted that each individual's symptom complex is idiosyncratic. 1 However, an additional important issue is the degree to which individuals report similar patterns of hypoglycemia-related symptoms across episodes. The reliability with which these symptoms occur influences the ability to detect the onset of hypoglycemia. 13 The symptoms reported by children exhibit marked variability between episodes of hypoglycemia, 3 but it is not known whether adults exhibit similar intra-individual variability.
The aim of the present study was to examine the symptoms of hypoglycemia recorded prospectively over a 9–12-month period by adults with type 1 and type 2 diabetes, to develop a model for quantifying the consistency of the symptom complex recorded on each occasion by every individual, and to examine what factors might produce inter-individual differences in the consistency of symptom reporting.
Subjects and Methods
Data were collected during a 12-month multicenter epidemiological study that examined the effects of type of diabetes and treatment modality on the frequency of hypoglycemia in 381 participants, 17–75 years old. 14 Subjects were recruited into five groups: (1) type 2 diabetes treated with a sulfonylurea; (2) type 2 diabetes treated with insulin for <2 years; (3) type 2 diabetes treated with insulin for >5 years; (4) type 1 diabetes of <5 years in duration; and (5) type 1 diabetes of >15 years in duration.
The clinical diagnosis of type 1 and type 2 diabetes was corroborated by enzyme-linked immunosorbent assay measurements of glucagon-stimulated C-peptide. The presence of retinopathy was assessed using digital retinal photography. Serum angiotensin converting enzyme (considered to be a putative marker for increased risk of severe hypoglycemia at the time that the study was designed 15 –17 ) and hemoglobin A1c were measured in a central laboratory. Exclusion criteria were as follows: hemoglobin A1c >9%, severe diabetes complications, history of seizures, malignant disease, severe systemic disease, or pregnancy. The protocol received multicenter ethics approval. Subjects gave informed consent.
Subjects performed regular capillary glucose monitoring using a Medisense G glucose meter (Abbott Laboratories, Abbott Park, IL). All episodes of hypoglycemia were recorded on standard forms, noting the date, time, duration, symptoms, treatment received, and concurrent blood glucose. Subjects were asked to record all episodes associated with a capillary glucose <3.0 mmol/L (<54 mg/dL) or any episodes associated with symptoms typical of hypoglycemia. Although subjects were encouraged to measure blood glucose, episodes were accepted as valid if typical hypoglycemic symptoms resolved with carbohydrate, even if no blood glucose measurement was available. Episodes associated with glucose levels >4.0 mmol/L were not considered valid. Symptoms were recorded using a standard list (Table 1). The state of hypoglycemia awareness was assessed with a validated scale. 18 Each month, subjects returned forms recording all hypoglycemic episodes with telephone follow-up if no form was received. As the intensity of hypoglycemic symptoms is diminished following antecedent hypoglycemia, 19 –21 any episode of hypoglycemia occurring within 24 h of a preceding episode was excluded from further analysis.
Modeling and analysis
In the statistical model developed, individuals report specific symptoms with a probability that depends on a random threshold being crossed. The behavior of thresholds is modeled through a probability distribution whose degree of concentration around a central value provides a measure of an individual's symptom-reporting consistency. Under a Bayesian approach, following observation of binary indicators of symptom experience (i.e., whether or not an individual experiences a given symptom), information on unobserved latent factors and the variability of the thresholds becomes available through their posterior distribution, which is obtained using Markov chain Monte-Carlo methodology. 22 Bayesian methods and Markov chain Monte-Carlo techniques are used in the analysis of latent variable models in psychology. 23,24 Latent variable and threshold models are commonly used in the behavioral sciences, 25 and stochastic methods have been used in diabetes to model the decision-making processes that lead to treatment of hypoglycemia. 26
Computations were performed using the statistical package R. 27 Markov chain Monte-Carlo techniques were implemented using winBUGS software. 28 The lack of previous similar analyses prevented formal power calculations. A pragmatic decision was made that participants should have experienced at least two episodes of hypoglycemia per month on average. The data were checked for sample bias resulting from patients with more frequent episodes potentially experiencing lower number of symptoms, but no such association was found (ρ = −0.09).
Model for intra-individual consistency
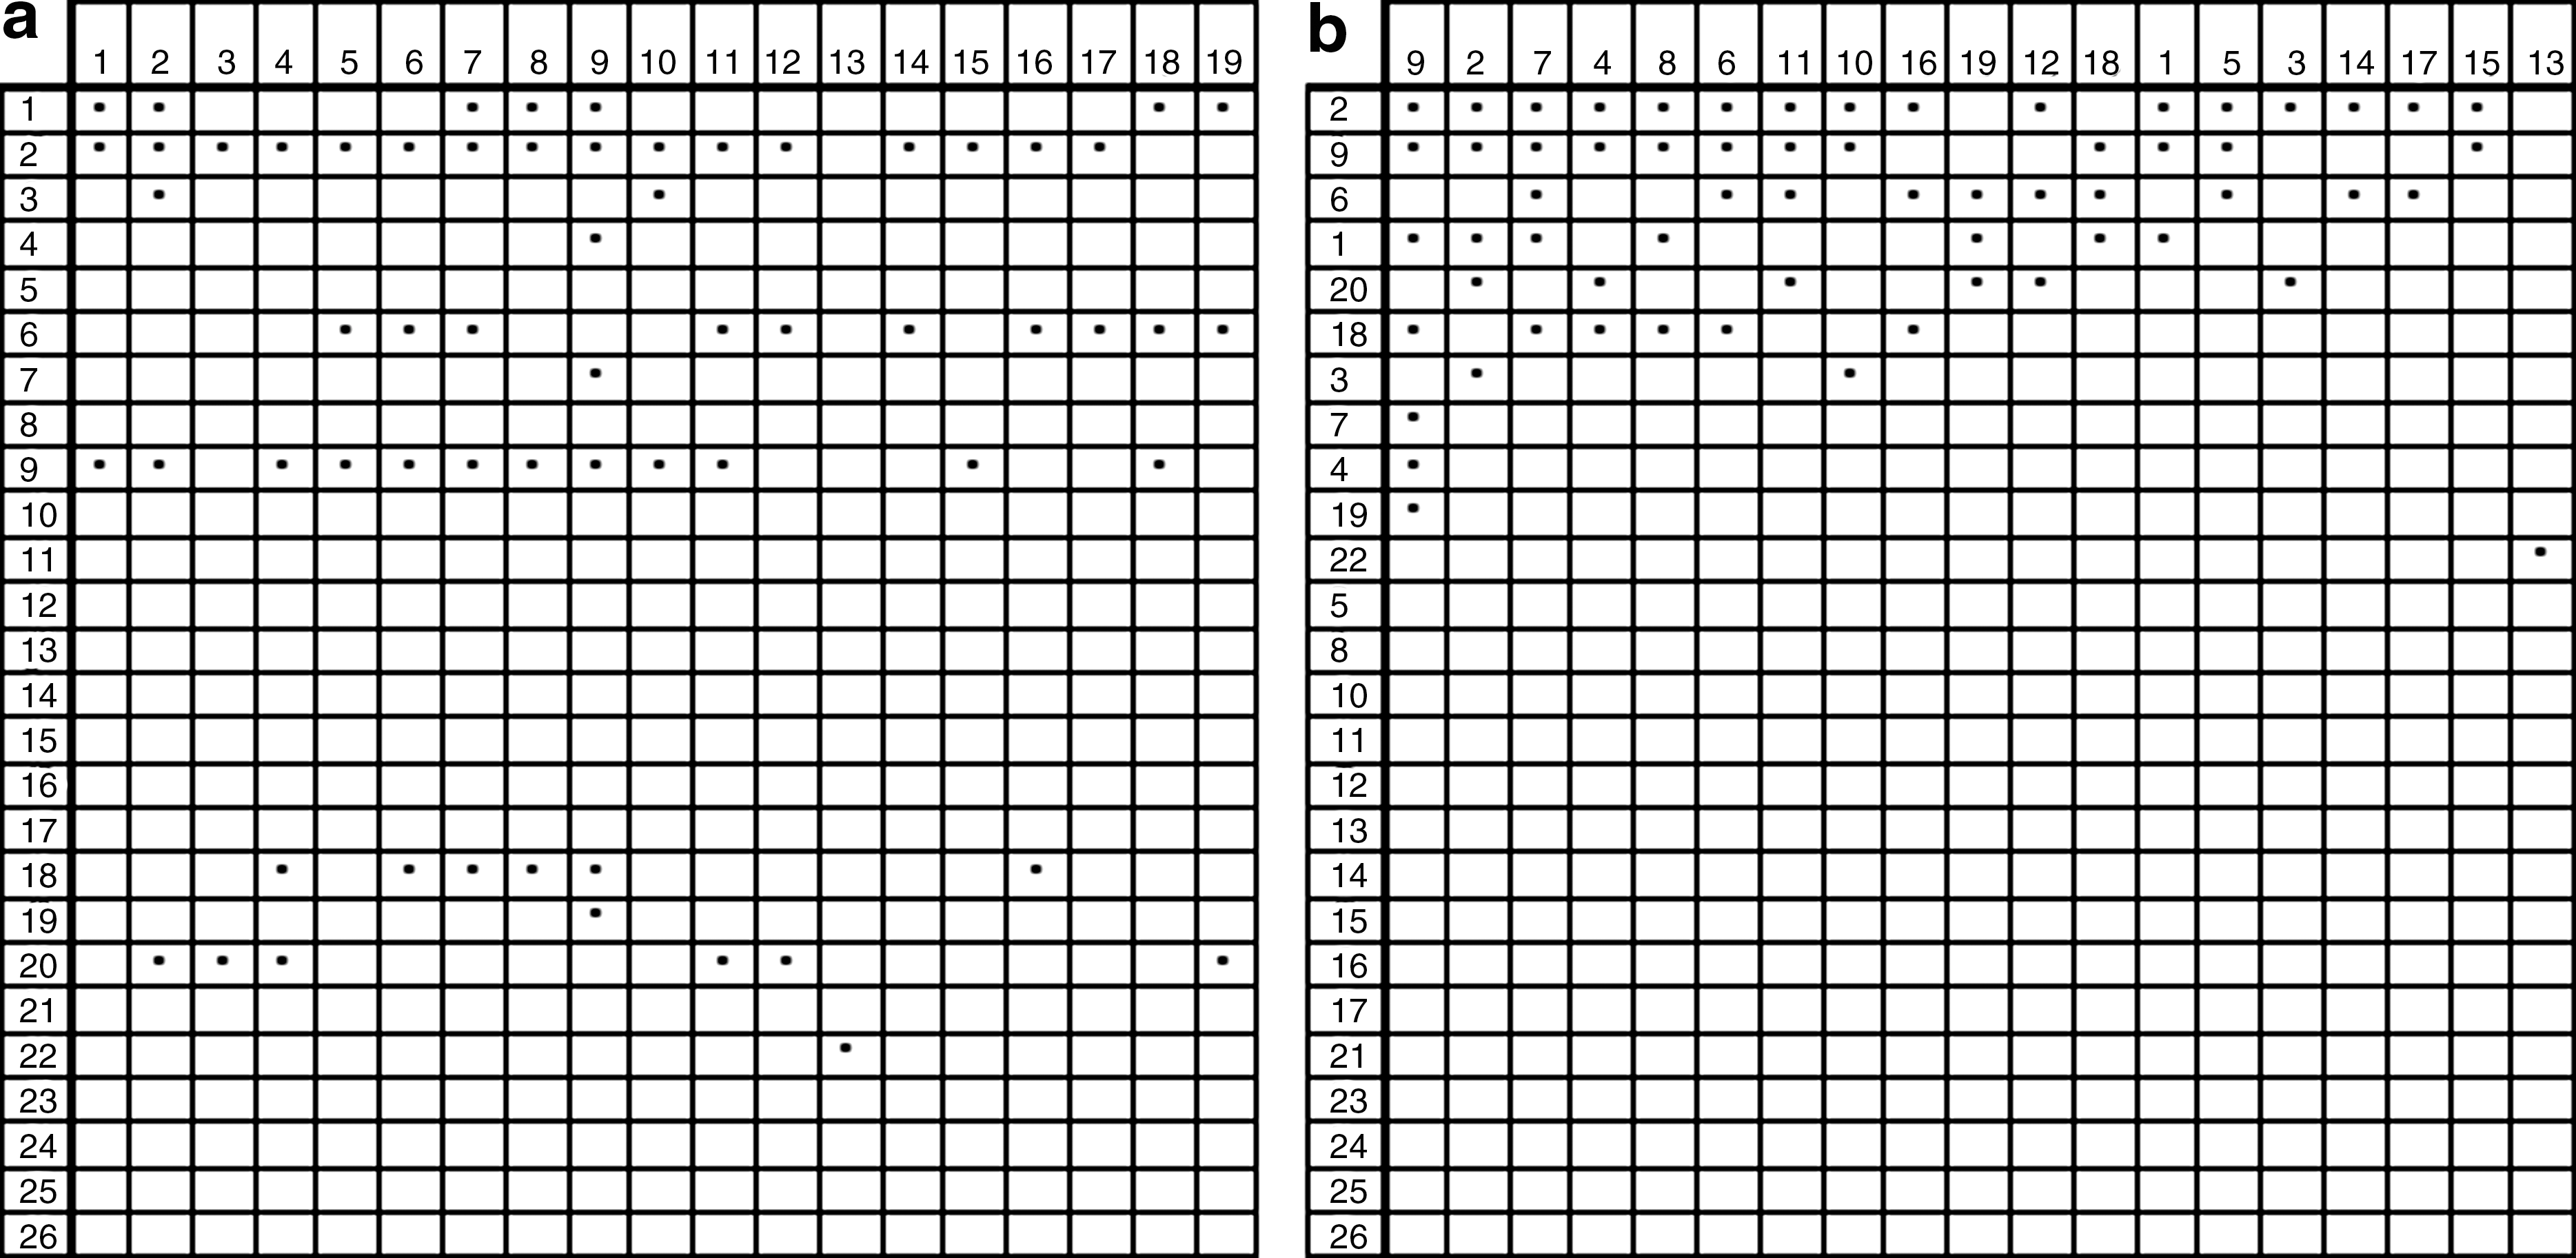
The random threshold determining the probability of an individual reporting specific symptoms relates to latent variables that govern the intensity of a given symptom on a given occasion and the individual's propensity to experience that symptom. Within our statistical model, assessment of intra-individual consistency is based on a principle of hierarchical symptom reporting where order is imposed by both propensity and intensity. Thus, a symptom is more likely to be reported if it is intense (e.g., profuse versus mild perspiration) and if the individual has a strong tendency to experience that symptom. This modeling approach can be represented graphically by regarding each subject's responses as a J × K matrix of indicator variables (J = number of symptoms; K = number of episodes) (Fig. 1a), where each reported symptom is represented by a marked cell. Rearranging the rows according to the frequency with which symptoms are experienced and the columns according to the number of symptoms per episode (Fig. 1b), we obtain a representation where the degree of clustering of marked cells can be regarded as a measure of consistency.
(
This is expressed within a parametric framework using a logistic-type latent variable model. We assume that the unobservable random thresholds τijk
(associated with individual i reporting symptom j at episode k) follow a
with
The precision parameter
Association between consistency and patient-specific factors
Generalized linear model methodology was used to investigate the effect of the following patient-specific covariates on consistency: gender, age, diabetes type (1 or 2), duration of diabetes, retinopathy, hypoglycemia awareness score (1–7, with higher scores corresponding to diminishing awareness of hypoglycemia), body mass index, stimulated C-peptide, hemoglobin A1c, and serum angiotensin converting enzyme activity. For modeling purposes retinopathy was subdivided into no retinopathy, background retinopathy, and proliferative retinopathy. A generalized linear model with gamma errors (see Supplementary Appendix; Supplementary Data are available online at
(where the GEN represents gender, DUR represents duration, RET1 represents no retinopathy, RET2 represents background retinopathy, RET3 represents proliferative retinopathy, AWAR represents awareness of hypoglycemia, BMI represents body mass index, CPEP represents C-peptide, HBA represent hemoglobin A1c, and ACE represents angiotensin converting enzyme), and the effect of each covariate was assessed using 95% equal-tailed Bayesian intervals of the corresponding b coefficients.
Results
A total of 3,474 episodes of hypoglycemia from 59 patients were examined, of which 91% were confirmed by capillary glucose readings. After exclusion of hypoglycemic episodes occurring within 24 h of a previous event, 2,699 episodes remained for analysis. Table 2 summarizes the subject characteristics and hypoglycemic episodes within each group. The most commonly recorded symptoms were weakness, decreased concentration, sweating, and hunger (28.7%, 28.2%, 21.8%, and 21.1% of episodes, respectively).
Data are given as median (range) unless otherwise stated.
ACE, angiotensin converting enzyme; T1Ins < 5, type 1 diabetes with <5 years' duration; T1Ins > 15, type 1 diabetes with >15 years' duration; T2tabs, type 2 diabetes treated with oral agents; T2Ins < 2, type 2 diabetes treated with insulin for <2 years; T2Ins > 5, type 2 diabetes treated with insulin for >5 years.
The distribution of the estimated precision parameter

Histograms of (
Some subjects in this study merit individual consideration. Subject 1028 (type 1 diabetes for >15 years) was asymptomatic during all of his 45 recorded episodes. He had reported a hypoglycemia awareness score 18 of 7, denoting total loss of warning symptoms, and had the highest estimated consistency (96.7; 95% Bayesian interval 92.9–98.7). In Bayesian statistics, the credible or Bayesian interval plays a similar role to confidence intervals in frequentist statistics. Subject 4003 (type 1 diabetes for >15 years) had the second highest consistency score (75.86; 95% Bayesian interval 60.7–87.6), was asymptomatic during 74.1% of his reported episodes, and was the only other subject with an awareness score of 7. Subject 5044 (type 1 diabetes for <5 years) had no symptoms during 51% of her episodes but had a hypoglycemia awareness score of 2, implying good awareness. Her consistency score was 40.4 (95% Bayesian interval 29.7–51.7). All other subjects were symptomatic during at least 50% of their reported hypoglycemic episodes. The single subject treated with oral agents was asymptomatic on 36% of episodes, all of which were confirmed biochemically (blood glucose 3.1–3.5 mmol/L). All of these subjects were included in the analysis as the presence or absence of symptoms was considered to form part of the variability of their symptom profiles.
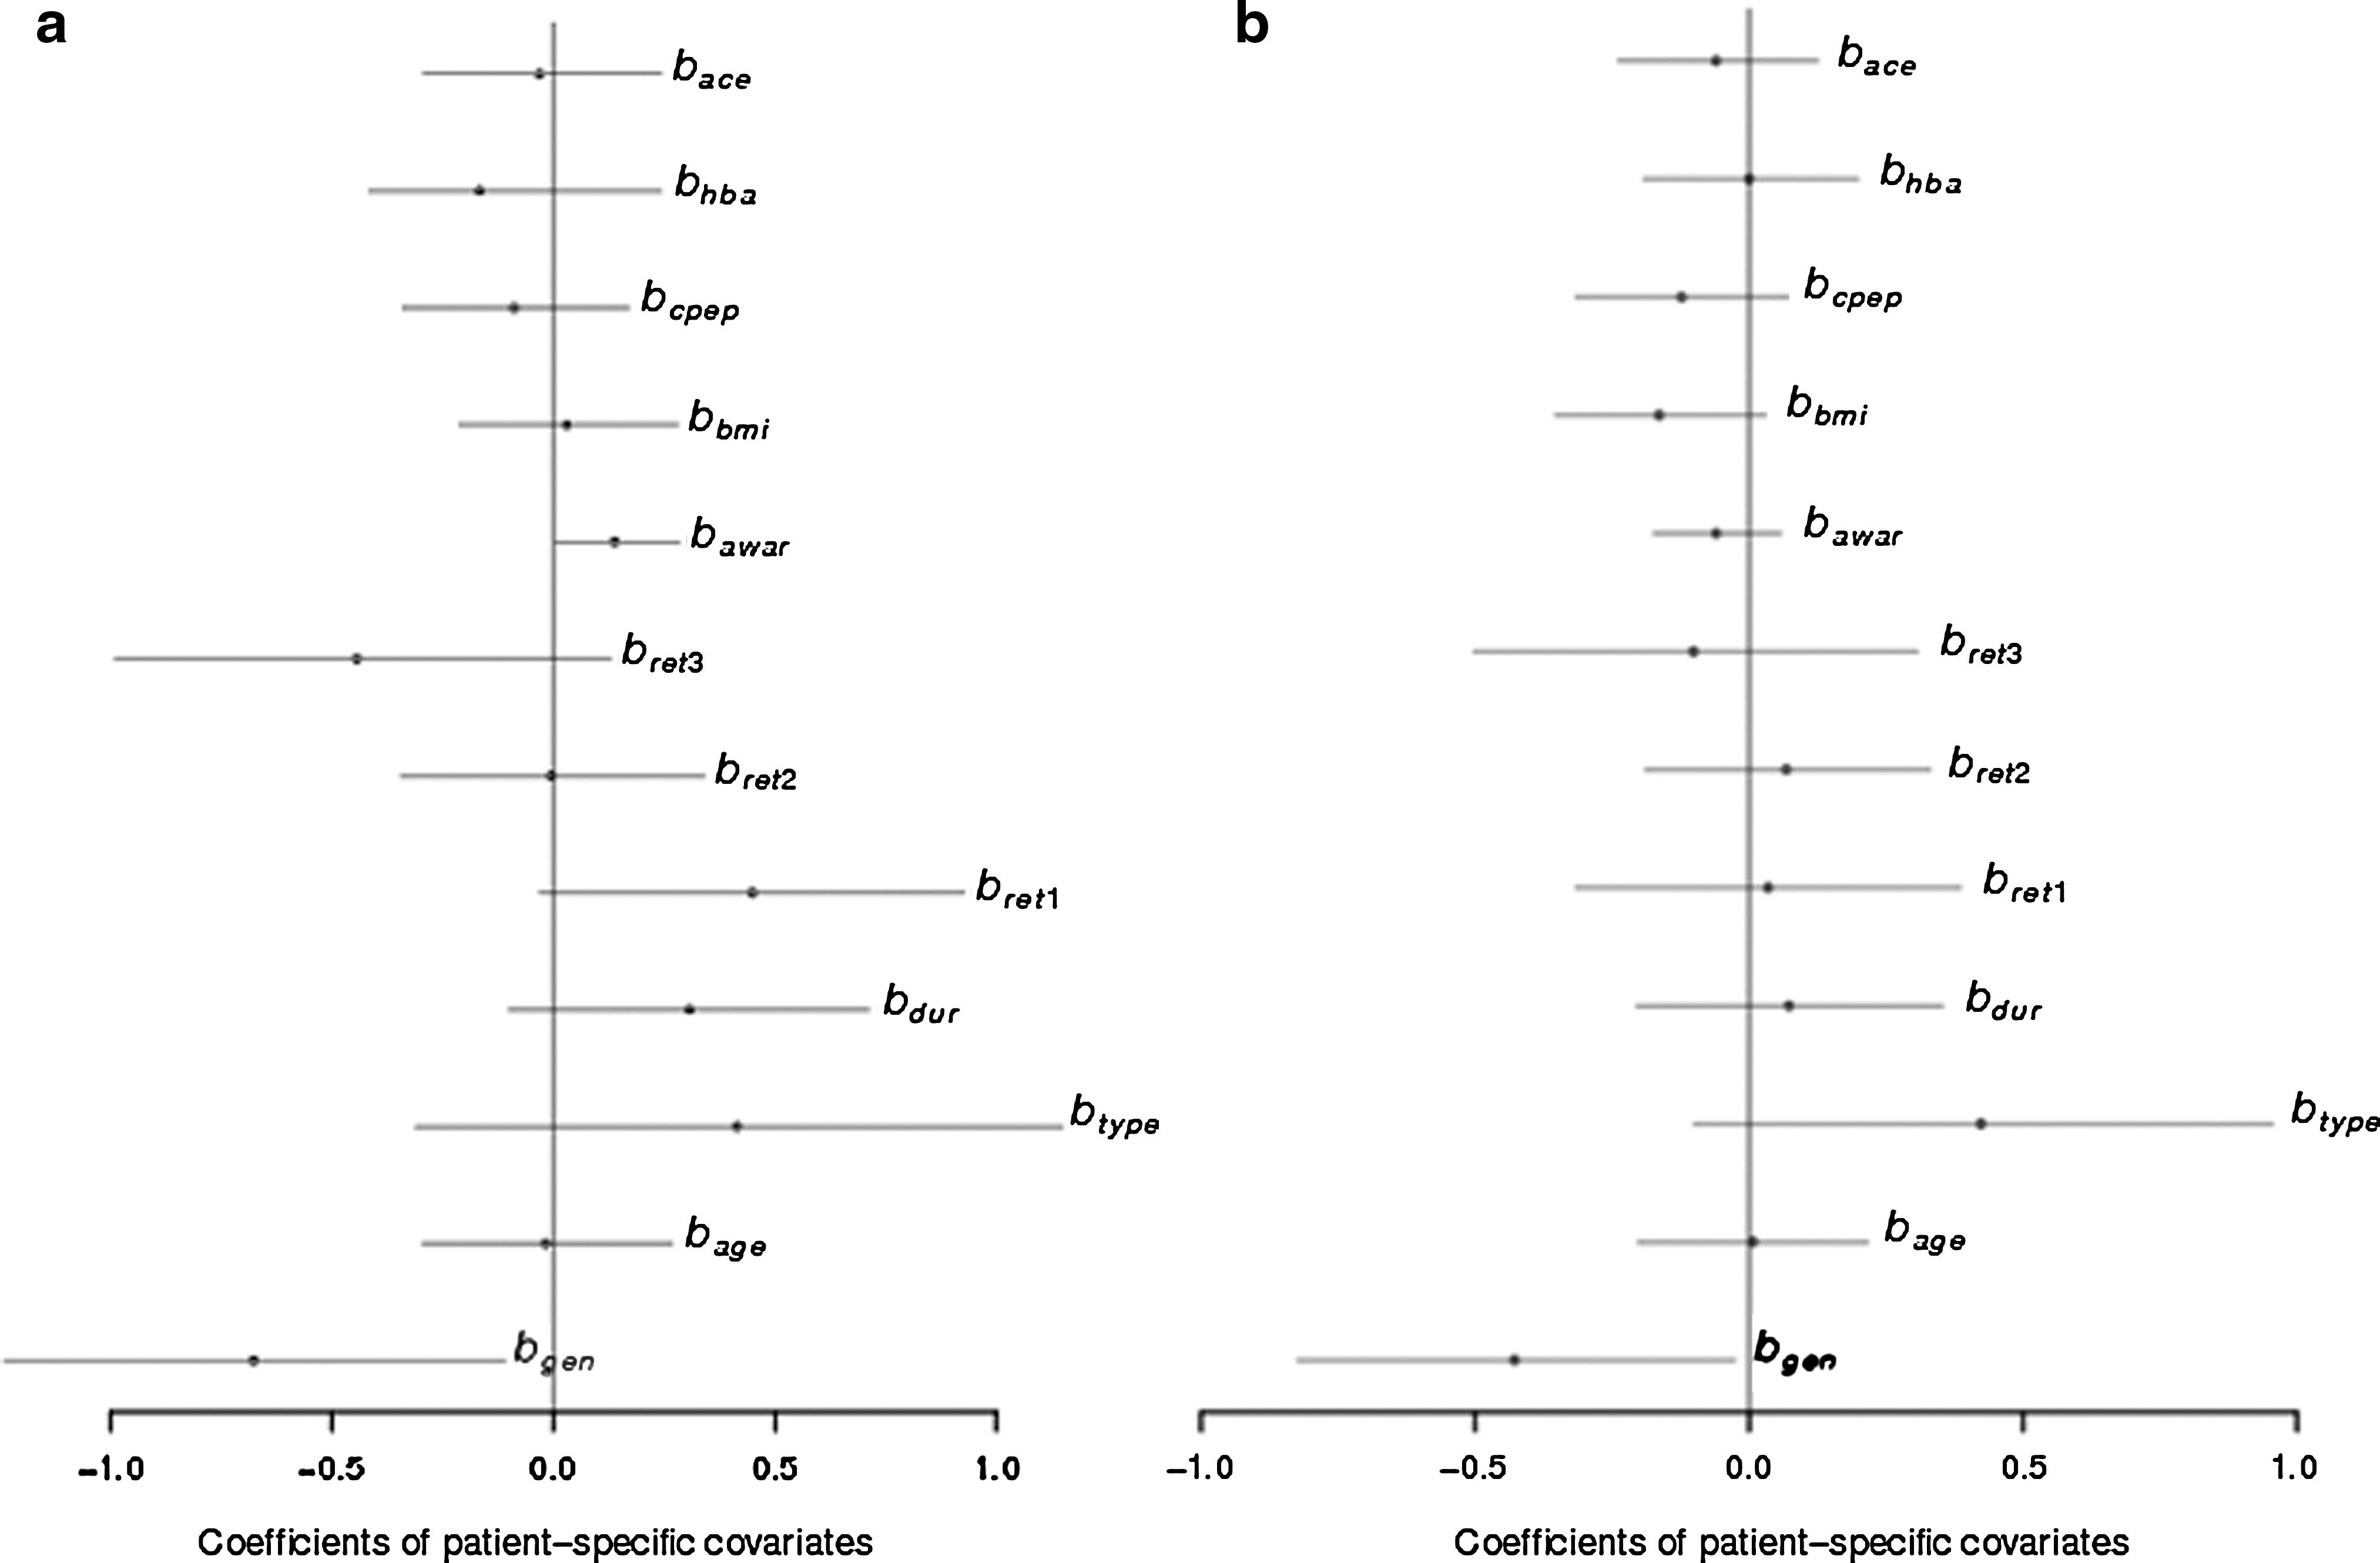
When the effect of specific covariates on the consistency measure was examined, gender and hypoglycemia awareness were the only factors that had a systematic effect. Figure 3a shows 95% Bayesian intervals for all covariate coefficients. The mean of the gender coefficient, b gen, was −0.677 (95% Bayesian interval −1.239, −0.110). This suggests that female subjects were less consistent than male subjects (gender was coded as 0 = males and 1 = females). The mean of the coefficient of awareness, b awar, was 0.138 (95% interval 0.006, 0.284), which implies that those with impaired awareness recorded lower variability in their symptoms than those with higher awareness.
(
However, if subjects 1028 and 4003 (asymptomatic on 100% and 74% of episodes, respectively) are excluded from the analysis, only gender has a significant effect, with females being less consistent than males (b gen = −0.43 with 95% Bayesian interval −0.82, −0.03) (Fig. 3b).
Discussion
The present study has demonstrated and quantified episode-to-episode, intra-individual variability in symptoms of hypoglycemia reported by adults with diabetes. It has also found some determinants of inter-individual differences in this symptom (in)consistency. It is accepted that each individual's hypoglycemia symptom complex is characteristic. However, the wide range and skewed distribution of the precision parameter
The most commonly reported symptoms were weakness, decreased concentration, sweating, and hunger. These have previously been demonstrated to be the earliest perceived symptoms of hypoglycemia 29 and those that are most commonly 13 and accurately 12 associated with hypoglycemia. However, the main aim of this study was not to study population similarities but rather to examine intra-individual consistency of symptom reporting.
The statistical analyses in the present study raise some important points for patient education and hypoglycemia research. First, when patients are taught that their hypoglycemic symptoms are idiosyncratic, they should also be informed that their symptoms will probably vary between episodes. Reinforcing this point may avoid a failure to recognize hypoglycemia as a result of symptom variation. Second, it is probably useful for patients to have an awareness of how consistent their symptoms are because people who have at least one reliable symptom of hypoglycemia only detect blood glucose levels below 3.9 mmol/L on 50% of occasions, whereas individuals with four or more reliable symptoms recognize similar blood glucose levels on 75% of occasions. 13 Finally, previous studies have relied on very few snapshots of the hypoglycemic symptom profile, either recorded during experimental hypoglycemia 10,11,30,31 or documented retrospectively by patients in what was thought to represent their “typical” symptom profile. 2,6 –8,32 The findings of the present study challenge the validity of the latter approach for the purpose of advising individual patients, as the degree of between-episode variability is much greater than has previously been appreciated.
Of the factors examined, only female gender increased symptom variability in a systematic way. Although impaired awareness was associated with increased symptom consistency in the initial analysis, this effect was no longer observed once the two individuals with awareness scores of 7 were excluded. One of the limitations of this analysis is that it cannot distinguish between a completely consistent person with full symptom awareness and a consistently asymptomatic individual. However, for individuals with a combination of symptomatic and asymptomatic episodes, the presence or absence of symptoms contributes to the consistency of their symptom profile, and it was thought important not to exclude asymptomatic episodes completely.
It was surprising that the subject treated with oral agents was asymptomatic during 36% of episodes, despite recording a normal hypoglycemia awareness score. 1 All his episodes were confirmed with glucose readings. In the United Kingdom, patients treated with oral agents are not routinely asked to check capillary glucose levels, so he had probably not realized that his awareness was impaired prior to participation in this study.
The relationship between consistency of symptom reporting and gender has not been reported previously. Symptoms of hypoglycemia develop at similar blood glucose thresholds in men and women with type 1 diabetes, 33 but the magnitude of the counterregulatory response is lower in women, 34 which may influence the intensity of the symptomatic response. Female counterregulatory responses are less affected by antecedent hypoglycemia and exercise than responses in men. 35 It could be hypothesized that the gender differences in this study relate to under-reporting by females as a result of lower symptom intensity, but it is not possible to confirm this as subjects were not asked to note symptom intensity.
It is possible that other factors, such as the activities engaging the individual at the time of the episode, may have an effect on symptom consistency, but it would be logistically difficult to study these in greater detail. Earlier work has classified hypoglycemic symptoms in physiological terms. 2,4,6 –8 Appropriate grouping of symptoms may be able to account for additional sources of between-group variation for an individual patient in the model, thus giving scope for including relevant effects for symptom groups in future analyses.
Not all hypoglycemic episodes in this study were confirmed biochemically. However, the presence of typical symptoms that resolve with ingestion of carbohydrate is conventionally taken as evidence of hypoglycemia. Insistence on biochemical corroboration would have further restricted the number of episodes available for analysis and most episodes (91%) were confirmed.
In subjects with normal awareness, it would be interesting to stratify episodes according to blood glucose level to investigate whether this had an effect on symptom reporting. However, this was not possible in the present study for several reasons. Although a fall in blood glucose in a adult without diabetes triggers the secretion of counterregulatory hormones and the onset of cognitive and symptomatic changes at reproducible blood glucose thresholds 33,36 within a defined hierarchy, 37 these thresholds become altered in diabetes, and the same blood glucose level may affect individuals with diabetes in different ways. Second, data from field studies can never be as controlled as data generated in a laboratory. Confirmation of hypoglycemia may have occurred several minutes before or after rescue carbohydrate was administered. Thus, the blood glucose measurement may not have coincided exactly with the blood glucose nadir or the peak of symptom intensity. Finally, blood glucose meters are less accurate in the hypoglycemic range, and it would not have been possible to confirm these readings with venous samples outside the confines of a tightly regulated laboratory study. However, there is the potential to examine this question in a follow-up study.
The study has several strengths, including its size (2,699 episodes of hypoglycemia), its prospective design, and its duration. Although some previous studies have collected symptoms prospectively, 12,38,39 they have not attempted to compare symptoms between episodes. Furthermore, prospective field data could be regarded as more generalizable than hypoglycemia data collected under laboratory conditions.
The present study demonstrates that intra-individual between-episode symptom variability is much greater than has been previously appreciated and that there are marked individual differences in this consistency. Caution should be exercised when interpreting patients' retrospective recall of what they regard to be their “typical” hypoglycemic symptoms. Female gender was the only factor found to have a systematic association with increased variability of the symptom complex. Given this observed variability, clinicians should advise patients against being too dogmatic in their perception of what constitutes their cardinal hypoglycemic symptoms, as these may vary considerably between episodes. This variability should also be considered when interpreting hypoglycemic symptom responses under different experimental conditions or when comparing different therapeutic interventions.
Footnotes
Acknowledgments
The primary hypoglycemia study was funded by the Department for Transport, which had no role in study design, data collection, data analysis, data interpretation, or writing of the paper. We acknowledge the work of the UK Hypoglycaemia Study Group in collecting the data used for these analyses. B.M.F. and I.J.D. are members of The University of Edinburgh Centre for Cognitive Ageing and Cognitive Epidemiology, part of the Cross Council Lifelong Health and Wellbeing Initiative (G0700704/84698). Funding from the Biotechnology and Biological Sciences Research Council, Engineering and Physical Sciences Research Council, Economic and Social Research Council, and Medical Research Council is gratefully acknowledged.
Author Disclosure Statement
B.M.F. has been a member of an advisory panel for, and has received honoraria/consulting fees from, Eli Lilly, Novo-Nordisk, GlaxoSmithKline, MSD, and Takeda. N.N.Z., G.S., G.J.G., and I.J.D. report no competing financial interests.
References
Supplementary Material
Please find the following supplemental material available below.
For Open Access articles published under a Creative Commons License, all supplemental material carries the same license as the article it is associated with.
For non-Open Access articles published, all supplemental material carries a non-exclusive license, and permission requests for re-use of supplemental material or any part of supplemental material shall be sent directly to the copyright owner as specified in the copyright notice associated with the article.