
Abstract
Background:
There is no consensus as to the best method to assess glycemic variability from continuous glucose monitoring (CGM) data. Rate of change has been suggested as a preferred method of assessing glycemic variability, but this assertion has not been validated.
Methods:
Forty-eight hours of CGM data were analyzed from 22 subjects (seven controls and 15 with type 1 diabetes) purposively sampled to reflect a range of glycemic variability. SD, mean amplitude of glycemic excursion, continuous overall net glycemic action, SD of rate of change (SDRC), and average absolute rate of change (AARC) were calculated and correlated with a clinical assessment of variability. SDRC and AARC were recalculated following a data smoothing process involving aggregation.
Results:
SDRC calculated from non-aggregated glucose readings gives a weaker correlation (r = 0.66) with the clinical assessment of variability than the correlations obtained by other indices (r = 0.90–0.96). Following a process of data aggregation, to exclude clinically insignificant fluctuations of blood glucose, we demonstrated that 60 min was the optimal aggregation period. The correlation between clinical assessment of variability and SDRC, 60-min aggregated, is 0.93, which is comparable to correlations shown by other established indices. Similar results are obtained for AARC.
Conclusions:
Rate of change calculated after appropriate data aggregation is a valid index of glycemic variability. Optimal data aggregation is achieved by aggregating into 1-h blocks.
Introduction
Currently available continuous glucose monitoring (CGM) devices allow us to obtain data on glucose fluctuations every 1–5 min for 3–6 days. From these data multiple indices of glycemic variability can be calculated. For the purpose of this article glycemic variability is defined as the extent to which there is acute short-term fluctuation of blood glucose.
It has previously been suggested, by some authors, that rate of change should be the preferred method of analyzing short-term blood glucose fluctuation. 5 Other authors have suggested alternative indices should be preferred, including SD 6 and mean amplitude of glycemic excursion (MAGE). 7 There is no consensus as to which of the available indices is the most appropriate.
Some previous publications analyzing rate of change have used SD rate of change (SDRC) as the preferred index. 5,8,9 Average absolute rate of change (AARC) has also been used. 5 These publications did not determine whether it is valid to calculate rate of change from raw data of frequently sampled blood glucose readings or whether it is mandatory to perform data aggregation prior to calculation of the index. The optimal time period for data aggregation is also unclear, with previous publications using both 15-min 9 and 60-min 8 aggregation.
The aim of this study is to establish whether the two indices of rate of change (AARC and SDRC) are valid and appropriate indices of glycemic variability and what methodology should be used to calculate them.
Patients and Methods
We performed retrospective analysis of 48 h of anonymized ambulatory CGM data from 30 subjects purposively sampled from a large population who were recruited to a multicenter observational study designed to assess the frequency of hypoglycemic episodes. 10
Subjects
Subjects for the original study were recruited from both primary and secondary care at six centers in the United Kingdom. For inclusion, subjects had to be 17–75 years old with hemoglobin A1c <9%. For the current analysis, data from 30 subjects were selected comprising 20 patients with type 1 diabetes and 10 control subjects without diabetes. The subjects with diabetes were purposively sampled to reflect a range of disease duration. Eight of the 30 subjects (five with diabetes and three controls) did not have a complete 48-h period of unbroken valid data and were excluded from further analysis. The data from the remaining 22 subjects (15 with type 1 diabetes and seven controls) were analyzed.
Data collection
Subjects in this study had performed a minimum of 96 h of continuous blood glucose monitoring using the Minimed Medtronic CGM system (CGMS®, Medtronic Minimed Ltd., Northridge, CA). During that period they were required to calibrate the device using five capillary glucose readings per day. Data were downloaded to a computer using version 1.7a of the Medtronic Solutions software. Further data management was performed using Microsoft (Seattle, WA) Excel. We excluded data that did not meet strict validity criteria (mean absolute error >28%, fewer than four calibration points per 24 h, or data not between two valid paired calibration points). 10 The first two complete, consecutive days of valid CGM data from midnight to midnight were analyzed for each subject. The data consist of glucose readings every 5 min, providing 576 readings in a 48-h period.
Calculation of indices
The indices calculated were as follows: SD, MAGE, 11 continuous overall net glycemic action (CONGA), 12 AARC, and SDRC. SD, CONGA, AARC, and SDRC were calculated using an Excel spreadsheet. MAGE was calculated manually. CONGA was calculated using three different time periods—1 h, 2 h, and 4 h—giving rise to three indices, CONGA1, CONGA2, and CONGA4, respectively. The formula for calculating rate of change at a particular time point is [BG(t 2) −BG(t 1)]/(t 2 − t 1), where BG(t 1) and BG(t 2) are consecutive CGM readings taken at times t 1 and t 2. 8 AARC was calculated as the mean of the absolute rate of change observed between each 5-min glucose reading. SDRC was calculated as the SD of all the rate of change values, including positive and negative rate of change. Formulae for the calculation of all indices are given in the Appendix.
Aggregation
AARC and SDRC were recalculated following a process of data aggregation. Individual sensor glucose data (acquired at 5-min intervals) from the subjects were aggregated into blocks of 15 min, 30 min, 60 min, 120 min, 180 min, and 240 min to provide a single mean glucose value for each block. AARC and SDRC were recalculated, using the aggregated data and the same methodology outlined above.
Clinical assessment of variability (clinical lability score)
A clinical lability score (CLS) was derived for each CGM trace based on the methodology used to develop the lability index by Ryan et al. 13 This was done by blinded review of the CGM data, in graphical form, by two independent clinicians experienced in management of intensive insulin therapy and clinical use and interpretation of CGM traces. Each 24-h graph of data was known as a trace. The clinicians independently scored each trace on a scale of 0–10 according to the degree of lability observed. Zero represents perfect stability, and 10 represents extreme lability. The clinicians were advised to initially rank all the traces in order, from lowest lability to highest, and then allocate each trace a score from 0 to 10. Clinicians were advised to engage in an iterative process to ensure consistency. Once the score for each trace had been independently allocated by each clinician, the CLS for a subject is then calculated. CLS is the mean of the four readings obtained (two clinicians, scoring two 24-h traces).
Correlation between indices of variability
The indices of glycemic variability were correlated with the CLS using Spearman's correlation. The correlation coefficients were compared using the Fisher z-transform test. Following the process of data aggregation, the correlation coefficients were recalculated. This was done as a correlation between the recalculated index from aggregated data and the CLS determined from the data in their original form.
Results
The CLS values for the 22 subjects were in the range of 1.0–8.0. Overall mean clinical lability was 4.44 ± 1.83. Clinical lability for subjects with diabetes was 5.28 ± 1.52, whereas for control subjects it was 2.64 ± 0.88. Correlation between the two clinicians' assessment of clinical lability was high (r = 0.87).
The correlation between indices of glycemic variability and clinical lability are shown in Table 1.
AARC, average absolute rate of change; CONGA1, CONGA2, and CONGA4, continuous overall net glycemic action calculated using three different time periods of 1 h, 2 h, and 4 h, respectively; MAGE, mean amplitude of glycemic excursion; SDRC, SD rate of change.
Three of the indices—MAGE, SD, and CONGA—show a strong correlation with a clinical assessment of variability. Correlation coefficients are in the range of 0.90–0.96.
Rate of change indices (AARC and SDRC) calculated using raw, non-aggregated data, give much weaker correlation coefficients of 0.53 and 0.66, which are significantly less than the other correlations (P = 0.007).
The data for the correlations between CONGA 2 and CLS and for the correlation between non-aggregated AARC and CLS (the strongest and weakest correlations, respectively) are shown graphically in Figure 1.

(
Figure 1a shows the strong correlation (r = 0.96) demonstrated between the index CONGA2 and the CLS. Figure 1b shows the much weaker correlation (r = 0.53) between rate of change (AARC), calculated from non-aggregated data, and the CLS.
Following a process of data aggregation, both rate of change indices show a progressive improvement in their correlation with clinical lability (Table 2 and Fig. 2). The highest level of correlation is demonstrated with 60-min aggregation of data. At this point AARC (60-min aggregated) shows a correlation coefficient of 0.96, which is equal to the best correlation shown by any index. Optimal aggregation for SDRC is also at 60 min and demonstrates a correlation of 0.93. Further aggregation of data beyond 60 min gives no additional benefit and leads to a decline in correlation.
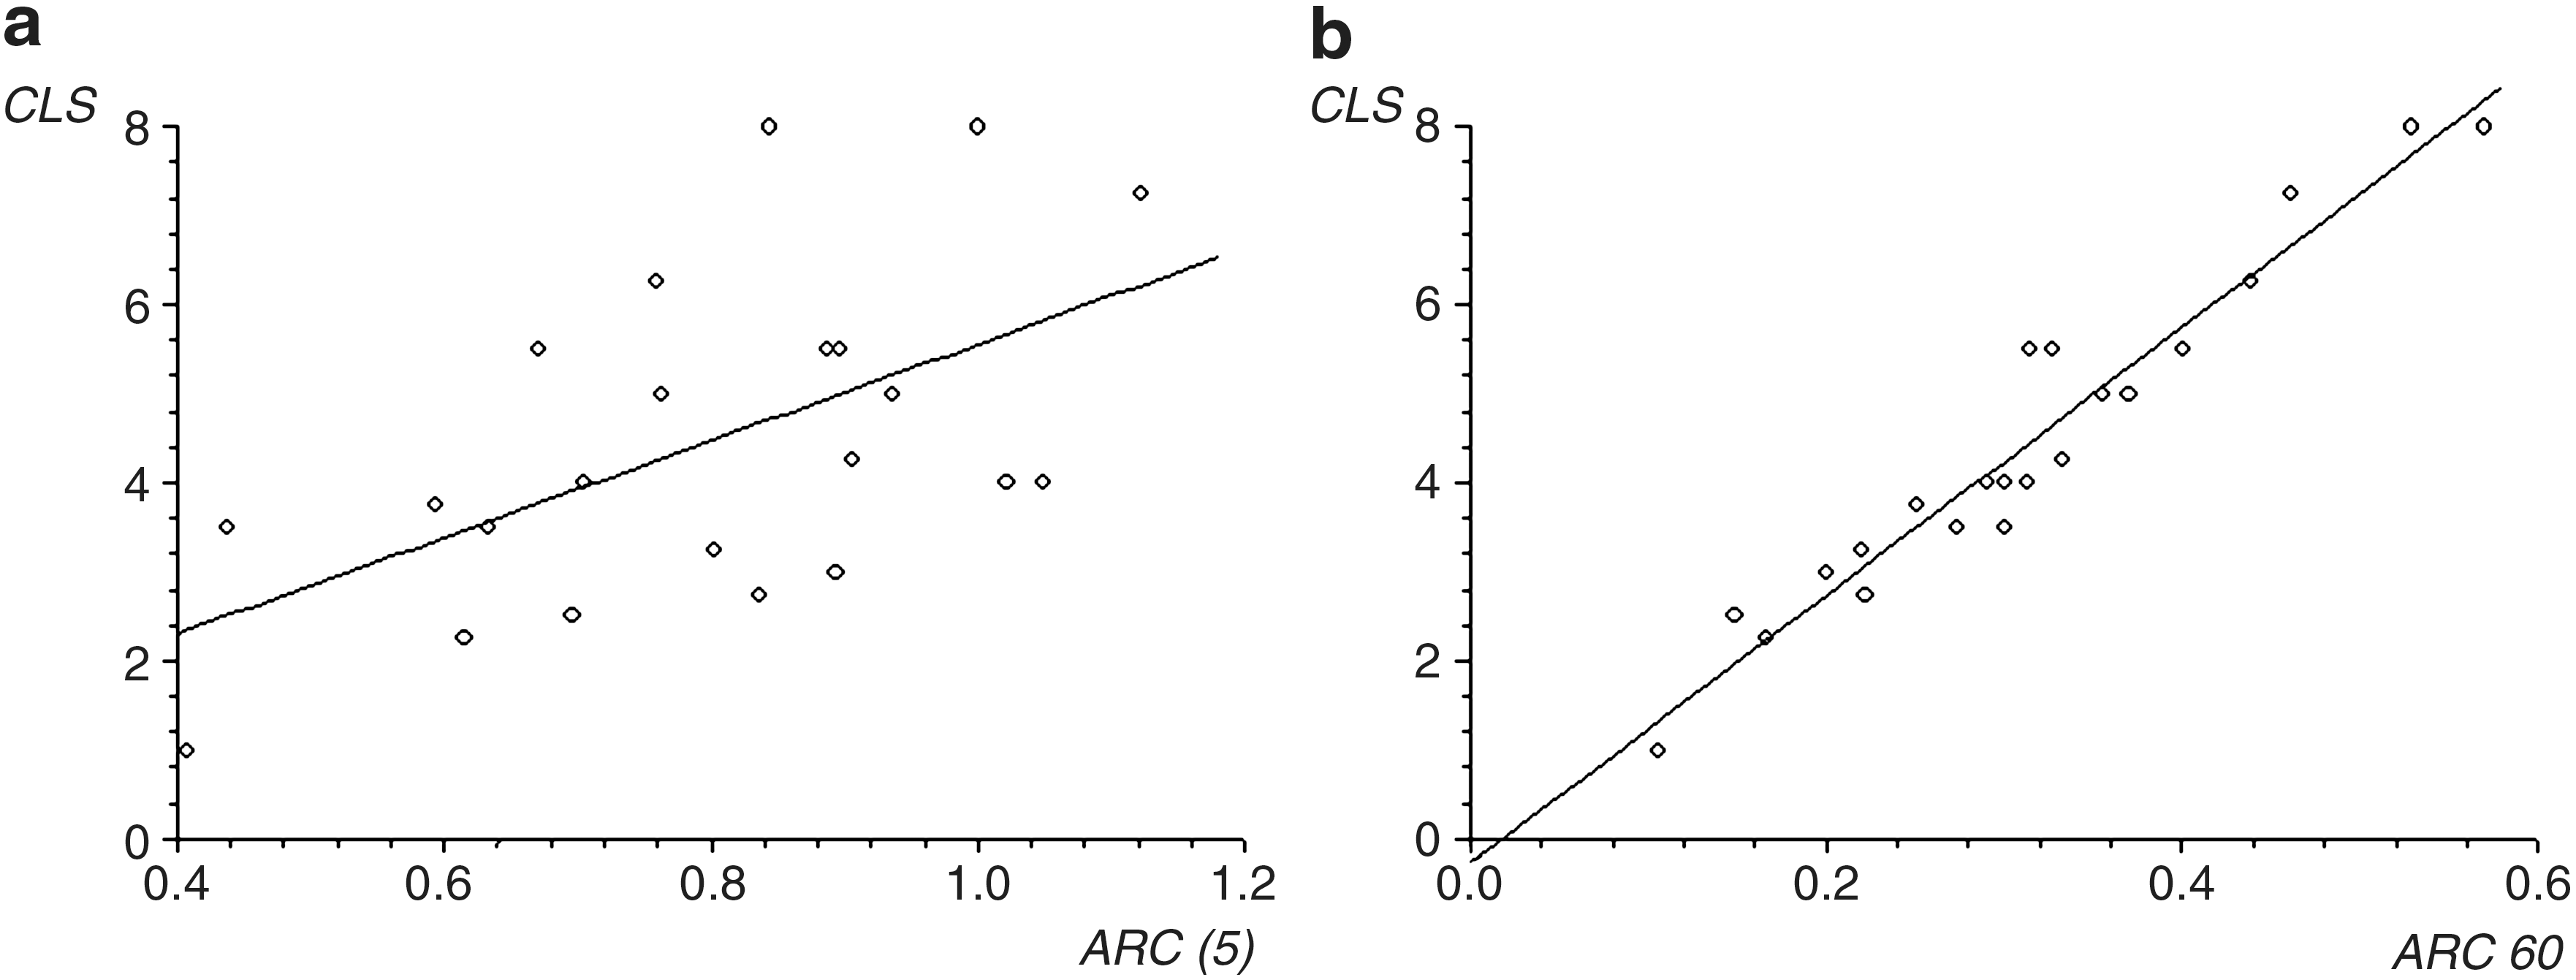
(
Correlation improves with aggregation, and optimal correlation is demonstrated at 60-min aggregation.
AARC, average absolute rate of change; SDRC, SD rate of change.
Figure 2a demonstrates the weak correlation (r = 0.53) between non-aggregated rate of change data (AARC) and CLS. Figure 2b shows that rate of change data aggregated into 60-min blocks gives a strong correlation (r = 0.96) with CLS.
Discussion
This study shows that three widely used measures of glycemic variability (SD, MAGE, and CONGA) correlate closely to each other and to clinical assessment of variability. However, AARC and SDRC, calculated on raw, 5-min interval data, provide a poor assessment of variability. Aggregating the data into 60-min blocks provides good correlation with other indices of variability and with clinical assessment.
We have defined glycemic variability as the extent to which there is acute, short-term, intraday fluctuation in blood glucose. Using this definition, a literature review demonstrates that SD, MAGE, CONGA, and SDRC are the most widely used indices of glycemic variability.
Several other indices were excluded on the basis that they do not assess glycemic variability but instead assess the quality of glycemic control. 14 Examples of this kind of index are the M value, 15 the Glycemic Risk Assessment Diabetes Equation, 16 Low Blood Glucose Index, High Blood Glucose Index, and Blood Glucose Risk Index. 5 Methodologically these risk indices are designed to give penalty points for glucose values that are abnormally low or high. Because of this methodology these indices quantify non-euglycemia. There are, therefore, unsuitable for assessing glycemic variability as defined above.
Two other possible indices of glycemic variability were excluded. The mean of daily difference 17 was not included because it is designed to measure the difference between days, not intraday variation. The Lability Index 13 was not included because there is no established method of adapting that index to CGM data.
Rate of change was previously suggested as a method to assess short-term blood glucose fluctuation from self-monitored blood glucose data. 18 It was subsequently applied to CGM data. 5 The initial methodology suggested calculating the index directly from glucose values sampled every 15 min. The SDRC was the main index generated by this methodology. AARC was also used. 5
Subsequently the same group used blood glucose rate of change to assess variability in a study on subjects with type 1 diabetes. 8 In that study rate of change was calculated from CGM data aggregated into 1-h blocks. The stated reason was to reduce the effect of data smoothing that occurred with CGM software. It was not apparent from the article why 1-h blocks were chosen. A further publication in 2009 suggests that rate of change should be calculated from data aggregated into 15-min blocks. 9 This is, in part, based on a Fourier analysis of CGM records suggesting that the maximum frequency of glucose sampling required to fully register fluctuation is 18 min. 19
These publications do not make it clear whether, when calculating rate of change, aggregation is mandatory. It is also unclear, from previous work, what the optimal aggregation period should be.
Our results demonstrate that rate of change calculated from raw, non-aggregated, data gives a poor assessment of clinically relevant variability. It is likely that this is due to excessive emphasis given to small fluctuations of blood glucose. In other words, this index, calculated with non-aggregated data, is particularly vulnerable to clinically irrelevant “noise.” Aggregating the data into 60-min blocks provides good correlation with other indices of variability and with clinical assessment.
The CLS 13 is the only published methodological description of a clinical assessment of variability. The original method involved two clinicians assessing data from self-monitored capillary blood glucose readings. The methodology was easily adapted to CGM data. The fact that this methodology draws on the assessment of only two clinicians is a limitation of the current study but was considered appropriate as it represented a replication of the only current published methodology describing clinical assessment of variability. It is noteworthy that a recent article that used a clinical assessment of the risk attached to different blood glucose readings relied on the opinion of 50 healthcare professionals. 16
Conclusions
This study demonstrates that SDRC and AARC are valid indices of glycemic variability. It also demonstrates that it is essential to perform data aggregation prior to calculating the rate of change index. Optimal data aggregation is achieved by aggregating into 1-h blocks.
This study also demonstrates how a clinical assessment of variability can potentially be used as a reference to assess the validity of indices. It is suggested that future studies using glycemic variability should explain the rationale for their choice of index of glycemic variability.
Footnotes
Acknowledgments
We would like to acknowledge the members of the U.K. Hypoglycemia Study Group who collected the original data. This includes Prof. Simon Heller, Prof. Stephanie Amiel, Prof. Brian Frier, Prof. David Kerr, Dr. Ken MacLeod, Dr. Steven Hunter, Dr. Rifat Malik, Dr. Tristan Richardson, Dr. Kate Allen, Dr. Darren McLaughlin, Dr. Celia Emery, and Dr. Kathryn Lonnen.
Author Disclosure Statement
No competing financial interests exist.
| Index | Explanation | Formula |
|---|---|---|
| SD | Calculated as the SD of all the glucose values |
a = glucose reading x = number of observations |
| Mean amplitude of glycemic excursion (MAGE) | Calculated as the sum of all glucose deviations (peak to nadir or nadir to peak) that are greater than 1 SD, divided by the total number of observations | [Σ λ]/n
If λ > v λ = each blood excursion from peak to nadir (or nadir to peak) v = 1 SD of mean glucose for a 24‐h period x = number of observations |
| CONGAn (continuous overall net glycemic action) | Calculated from the SD of the differences between each observed glucose value and the value recorded n h previously |
where Dt = at − at − m and D* = [Σ Dt ]/k k = number of observations where there is an observation n × 60 min ago m = n × 60 at = glucose reading at time t min after start of observations |
| Rate of change (ROC) | Calculated from the difference between two glucose values, divided by the time difference between those values | ROC = [a(t
2) − a(t
1)]/(t
2 − t
1) a(t 1) and a(t 2) are consecutive glucose readings taken at times t 1 and t 2 |
| Average absolute rate of change (AARC) | Calculated as the mean of series of absolute values of rate of change |
x = number of observations |
| SD rate of change (SDRC) | Calculated as the SD of rate of change values |
x = number of observations |
AARC, average absolute rate of change; CONGA1, CONGA2, and CONGA4, continuous overall net glycemic action calculated using three different time periods of 1 h, 2 h, and 4 h, respectively; MAGE, mean amplitude of glycemic excursion; SDRC, SD rate of change.