




Abstract
Background:
Applying real-time learning into an artificial pancreas system could effectively track the unpredictable behavior of glucose–insulin dynamics and adjust insulin treatment accordingly. We describe a novel learning algorithm and its performance when integrated into the MD-Logic Artificial Pancreas (MDLAP) system developed by the Diabetes Technology Center, Schneider Children's Medical Center of Israel, Petah Tikva, Israel.
Methods:
The algorithm was designed to establish an initial patient profile using open-loop data (Initial Learning Algorithm component) and then make periodic adjustments during closed-loop operation (Runtime Learning Algorithm component). The MDLAP system, integrated with the learning algorithm, was tested in seven different experiments using the University of Virginia/Padova simulator, comprising adults, adolescents, and children. The experiments included simulations using the open-loop and closed-loop control strategy under nominal and varying insulin sensitivity conditions. The learning algorithm was automatically activated at the end of the open-loop segment and after every day of the closed-loop operation. Metabolic control parameters achieved at selected time points were compared.
Results:
The percentage of time glucose levels were maintained within 70–180 mg/dL for children and adolescents significantly improved when open-loop was compared with day 6 of closed-loop control (P<0.0001) and remained unaltered for the adult group (P=0.11) during nominal conditions. In varying insulin sensitivity conditions, the percentage of time glucose levels were below 70 mg/dL was significantly reduced by approximately sevenfold (P<0.001). These observations were correlated with significant reduction in the Low Blood Glucose Index (P<0.001).
Conclusions:
The new algorithm was effective in characterizing the patient profiles from open-loop data and in adjusting treatment to provide better glycemic control during closed-loop control in both conditions. These findings warrant corroboratory clinical trials.
Introduction
One of the limitations facing the operation of an AP is patient variability in the glucose–insulin dynamics. In order to overcome interpatient variability in the glucose–insulin dynamics, it is necessary to develop personalized AP systems. 6 The more accurate the AP controller's personalized parameters are with regard to their glucose–insulin dynamics, the better the AP system is at controlling the patient's glucose level. 7 Integrating learning capabilities into the MDLAP system would enable it to deal with such variations. Real-time learning most effectively tracks these variations enabling adjustments of insulin treatment and with continuous fine-tuning will considerably enhance the treatment under closed-loop control.
The use of computer simulation to validate new AP control algorithms is well known. Kovatchev et al. 8 presented a simulation model (i.e., the University of Virginia/Padova simulator) that has been approved by the U.S. Food and Drug Administration as a substitute to animal models for validating AP control algorithms. Patek et al. 9 provided guidelines for proof-of-concept simulation-based testing of control algorithms. Different studies have been published using this tool to verify newly developed control algorithms for AP systems. 10 –12 Run-to-run tuning algorithm and model predictive iterative learning control were previously applied to improve the performances of an AP system based on model predictive control (MPC). 13,14 Both algorithms were validated on in silico subjects using the University of Virginia/Padova simulator. 8,12
A learning algorithm for the MDLAP system was developed individualizing the closed-loop controller operation to the patient by learning the parameters for basal and bolus insulin delivery from previous blood glucose–insulin interaction and dynamics. We report the principles underlying the learning algorithm, its components, and the results that were derived from computer simulation (in silico) validation studies.
Methods
Learning algorithm
The proposed algorithm is designed to detect and adjust the MDLAP controller's correction index (CCI), which determines the amount of insulin needed in order to optimize glucose control for that specific patient. The CCI is used to calculate the amount of insulin needed to bring glucose levels to within target range. The learning algorithm we describe was implemented using MATLAB version R2008a (The MathWorks, Natick, MA).
The learning algorithm includes two components: the Initial Learning Algorithm (ILA) and the Runtime Learning Algorithm (RLA). The ILA calculates the initial individual CCI (CCI Init) based on data that had been collected during the patient's routine practices at home (i.e., “open-loop”). The collected information included meal consumption (C), quantification of the delivered bolus and basal insulin (B), and sensor data (S). The CCI Init is fed into the closed-loop system during patient hookup. The RLA follows the patient's management of his or her glucose levels during closed-loop control and adjusts the CCI in order to optimize that control. The RLA can be activated at constant time periods (e.g., after each 24-h period) or after high-risk events (e.g., hypoglycemic episodes), thus providing the AP system the opportunity to “learn” from its mistakes and/or to improve glucose control.
Depending on the patient's glycemic control, physicians decide what adjustments if any are required to the patient's insulin regimen in order to achieve optimal glycemic control. It was our intention to automate this logic into our learning algorithm. Thus, both the ILA and the RLA rely on glucose control performance analysis of the input data. This analysis includes the percentage of time glucose levels (perBG) are maintained within the normal range of 70–180 mg/dL (perBG 70–180), below that range (perBG <70), and rise above it (perBG >180). It also assesses the minimum sensor value (S min), the maximum sensor value (S max), and the mean glucose values (S mean).
The ILA algorithm includes three steps: (1) estimation of the average influence of insulin on glucose levels, denoted as
where CF (in mg/dL/units) is the correction factor that estimates the average influence of insulin on glucose levels and dC (in mg/dL/g) represents the rise of blood glucose that corresponds to 1 g of carbohydrate consumed. dC can be described as the ratio between CF and the carbohydrate ratio (CR), which was shown by King and Armstrong
15
to have a highly significant correlation. Thus, we can rewrite Eq. 1 by replacing the estimation of CF with
Then the
As the main purpose of the RLA is to follow the patient's glycemic control during closed-loop control and adjusts the CCI in order to optimize that control, its design includes the glycemic control modification algorithm as described above for the ILA. The resulting CCI RT is then restricted to apply safety constrains regarding insulin delivery. Pairs of previously tested parameters {CCIi , Logi } are analyzed to find the minimum sensor value for each Logi , denoted as S min (i). The series of {CCIi , S min (i)} is formed and extrapolated to find CCI low for which S min (i) is equal to a threshold glucose level of 50 mg/dL. In addition, the minimal CCIi for which S min(i) >50 mg/dL is extrapolated and labeled CCI high. The last step is to restrict the CCI RT to lie between CCI low and CCI high.
In silico experiments
The performance of the learning integrated MDLAP System was tested in seven different experiments using the University of VirginiA/Padova simulator. 8,12 The simulation included days under open-loop and under closed-loop control strategy. The insulin delivery during open-loop control is based on the combination of basal insulin administration and premeal boluses. The premeal boluses are calculated by dividing an imperfect estimation of the carbohydrate intake with an optimized CR. We introduced a random factor of±50% to the amount of consumed carbohydrates, to mimic the imperfect estimation of carbohydrate that may occur in daily treatment. During closed-loop control the MDLAP operates in a full closed-loop manner and decides on the insulin delivery every 5 min using a combination of basal insulin and boluses. The aim of the current in silico study was to evaluate the ability of the learning algorithm to characterize and update the patient's profile for the MDALP system (detailed in Atlas et al. 5 ). It was assumed that there is a correlation between the patient profile characterization and glucose control during closed-loop. 3,16 The primary outcome was the perBG 70–180 (between home care and each closed-loop day). Secondary outcomes included the time glucose levels were in the hypoglycemic range (perBG <50), within the levels of impending hypoglycemia (perBF 50–70), the perBG >180, the number of excursions below 63 mg/dL, and the risk indexes of Kovatchev et al. 17 The detailed simulation protocol of each experiment is as follows:
Experiment 1
Three hundred virtual subjects are simulated for 3 days of open-loop control strategy with optimized CR using the Food and Drug Administration–approved simulator. The subject cohort includes 100 children, 100 adolescents, and 100 adults, whose demographic and metabolic parameters were previously described by Kovatchev et al. 8 Simulation starts with basal values at 00:00 AM and each simulation day consisted of three meals of 40, 85, and 60 g of carbohydrates eaten at 7:00 AM, 12:00 PM, and 6:00 PM, respectively. Experiment 2 is performed sequentially to Experiment 1 in the sense that the initial conditions of Experiment 2 are the final ones of Experiment 1.
Experiment 2
The 300 subjects are simulated for 6 days of the closed-loop control strategy with the MDLAP system. The initial patient profile is learned from the data gathered in Experiment 1 using the ILA. At the end of each closed-loop day this profile is updated if required by the RLA. Meal scenarios are the same as for Experiment 1.
Experiment 3
Thirty virtual subjects (10 children, adolescents, and adults each) are simulated for 3 days of open-loop control strategy with an optimized CR. Simulation starts with basal values at 00:00 AM, and each simulation day consisted of three meals of 50, 75, and 85 g of carbohydrates eaten at 7:30 AM, 12:30 PM, and 6:30 PM, respectively. A linear increase or decrease of the simulator insulin sensitivity parameters (kp3 and Vmx [see Magni et al. 13 and Dalla Man et al. 18 for details]) is introduced. The terminal parameter variation is±25% of nominal values. The decision to increase or decrease the insulin sensitivity parameters is randomly taken for each patient with equal probability. Experiments 4–6 are performed sequential to Experiment 3 such that the initial conditions of Experiments 4–6 are the final ones of Experiment 3 in each instance.
Experiment 4
The 30 subjects are simulated for 6 days of closed-loop control strategy with the MDLAP system. The initial patient profile is learned from the data gathered in Experiment 3 using the ILA. At the end of each closed-loop day this profile is updated if required by the RLA. Meal scenarios and changes to insulin sensitivity parameters are the same as for Experiment 3.
Experiment 5
Experiment 5 is the same as Experiment 4, but without activating the RLA.
Experiment 6
Experiment 6 is the same as Experiment 4, but the CCI Init is increased by 25%, and simulation is last for 1 day.
Experiment 7
Experiment 7 is the same as Experiment 4, but CCI Init is decreased by 25% and simulation is last for 1 day.
In all experiments we used the repeated-measures single-factor analysis of variance test and the two-tailed, paired t test in order to assess the significance of the results.
Results
A summary of the percentage of time during which specific glucose levels were maintained for Experiments 1 and 2 (constant insulin sensitivity) for each age group are presented in Table 1. The perBG 70–180 was significantly longer on Day 6 of Experiment 2 than Experiment 1 (average results) for the children and adolescent groups (P<0.0001) and remained unaltered for the adult group (P=0.11). The perBG 70–180 in all three age groups was increased significantly between Day 1 and Day 6 of Experiment 2 (P<0.0001). The percentage of time the levels remained within conditions of hypoglycemia was significantly reduced from open-loop treatment (Experiment 1) to Day 1 of closed-loop control (Experiment 2, Day 1) for the children and adolescent groups (P=0.03 and P<0.001, respectively), whereas there was no significant change for all three age groups between Day 1 and Day 6 of Experiment 2. The perBG >180 did not change significantly from open-loop treatment to Day 1 of closed-loop control for the three age groups, but it was significantly shorter between Day 1 and Day 6 of closed-loop control and between open-loop and the last day of closed-loop control for all three age groups (P<0.001).
Between Experiment 1 and Experiment 2 (Day 1).
Between Experiment 2 (Day 1) and Experiment 2 (Day 6).
Between Experiment 1 and Experiment 2 (Day 6).
NS, not statistically significant.
To further evaluate the ILA, we compared the results achieved on Experiment 4 (Day 1) with Experiments 6 and 7 (Table 2). Because of the small group size, statistical analysis is performed on the whole group of 30 subjects. As expected, results show that by decreasing the CCI Init (Experiment 7), the amount of insulin delivered is significantly increased (P<0.0001). Moreover, the risk for hypoglycemia, as expressed by the Low Blood Glucose Index, is significantly increased by 2.5-fold (P<0.01), and the risk for hyperglycemia, as expressed by the High Blood Glucose Index, is decreased by 17.6% compared with the conditions in Experiment 4 (Day 1). An opposite and significant response is observed when the estimation of CCI Init is increased (Experiment 6) (Table 2).
Between Experiment 4, Day 1 and Experiment 6.
Between Experiment 4, Day 1 and Experiment 7.
BG, blood glucose; CCI Init, initial controller's correction index; HBGI, High Blood Glucose Index; LBGI, Low Blood Glucose Index; NS, not statistically significant.
Figure 1 shows a stacked bar chart displaying the glucose distribution by time of day, with time as a continuous variable, in conditions of changed insulin sensitivity for open-/closed-loop for all three age groups. 19 To assess the efficacy of the RLA, we compared open-loop (Experiment 3, Day 3) with closed-loop using the learning-integrated MDLAP system (Experiment 4, Day 6) and closed-loop using MDLAP without the activation of the RLA (i.e., MDLAP only, Experiment 5, Day 6). Significant differences were found regarding the occurrence and risk of hypoglycemia between both closed-loop experiments versus open-loop, as can be seen in Figure 1. The number of excursions below 70 mg/dL was significantly reduced by approximately threefold during closed-loop (P<0.001), and the time glucose levels were below 70 mg/dL were also significantly reduced by approximately sevenfold (P<0.001). These observations were correlated with significant reduction in the Low Blood Glucose Index (P<0.001). Although no significant difference was observed in perBG 70–180 between open-loop and the learning-integrated MDLAP closed-loop session, it was significant lower during MDLAP only closed-loop compared with open-loop (P=0.01). Using the RLA, the MDLAP system managed to increase the perBG 70–180 significantly from 62±2.7 (Experiment 5, Day 6) to 70±3 (Experiment 4, Day 6) (P<0.0001) without increasing the risk of hypoglycemia as opposed to open-loop control where both the risk of hypoglycemia and perBG 70–180 were increased. Comparison of perBG 70–180 with and without activation of RLA during closed-loop control showed that of the 10 adolescent patients, two showed no change, seven improved by 15–22%, and one showed improvement of 72%. For the adult patients, one showed impairment of 5%, three showed improvement of 3–9%, and six improved by more than 17%. In the group of children, one was impaired by 7%, six showed no change, one improved by 7%, and two improved by more than 25%. No statistical difference was found in the majority of the tested parameters between Day 1 and Day 6 of Experiment 4.
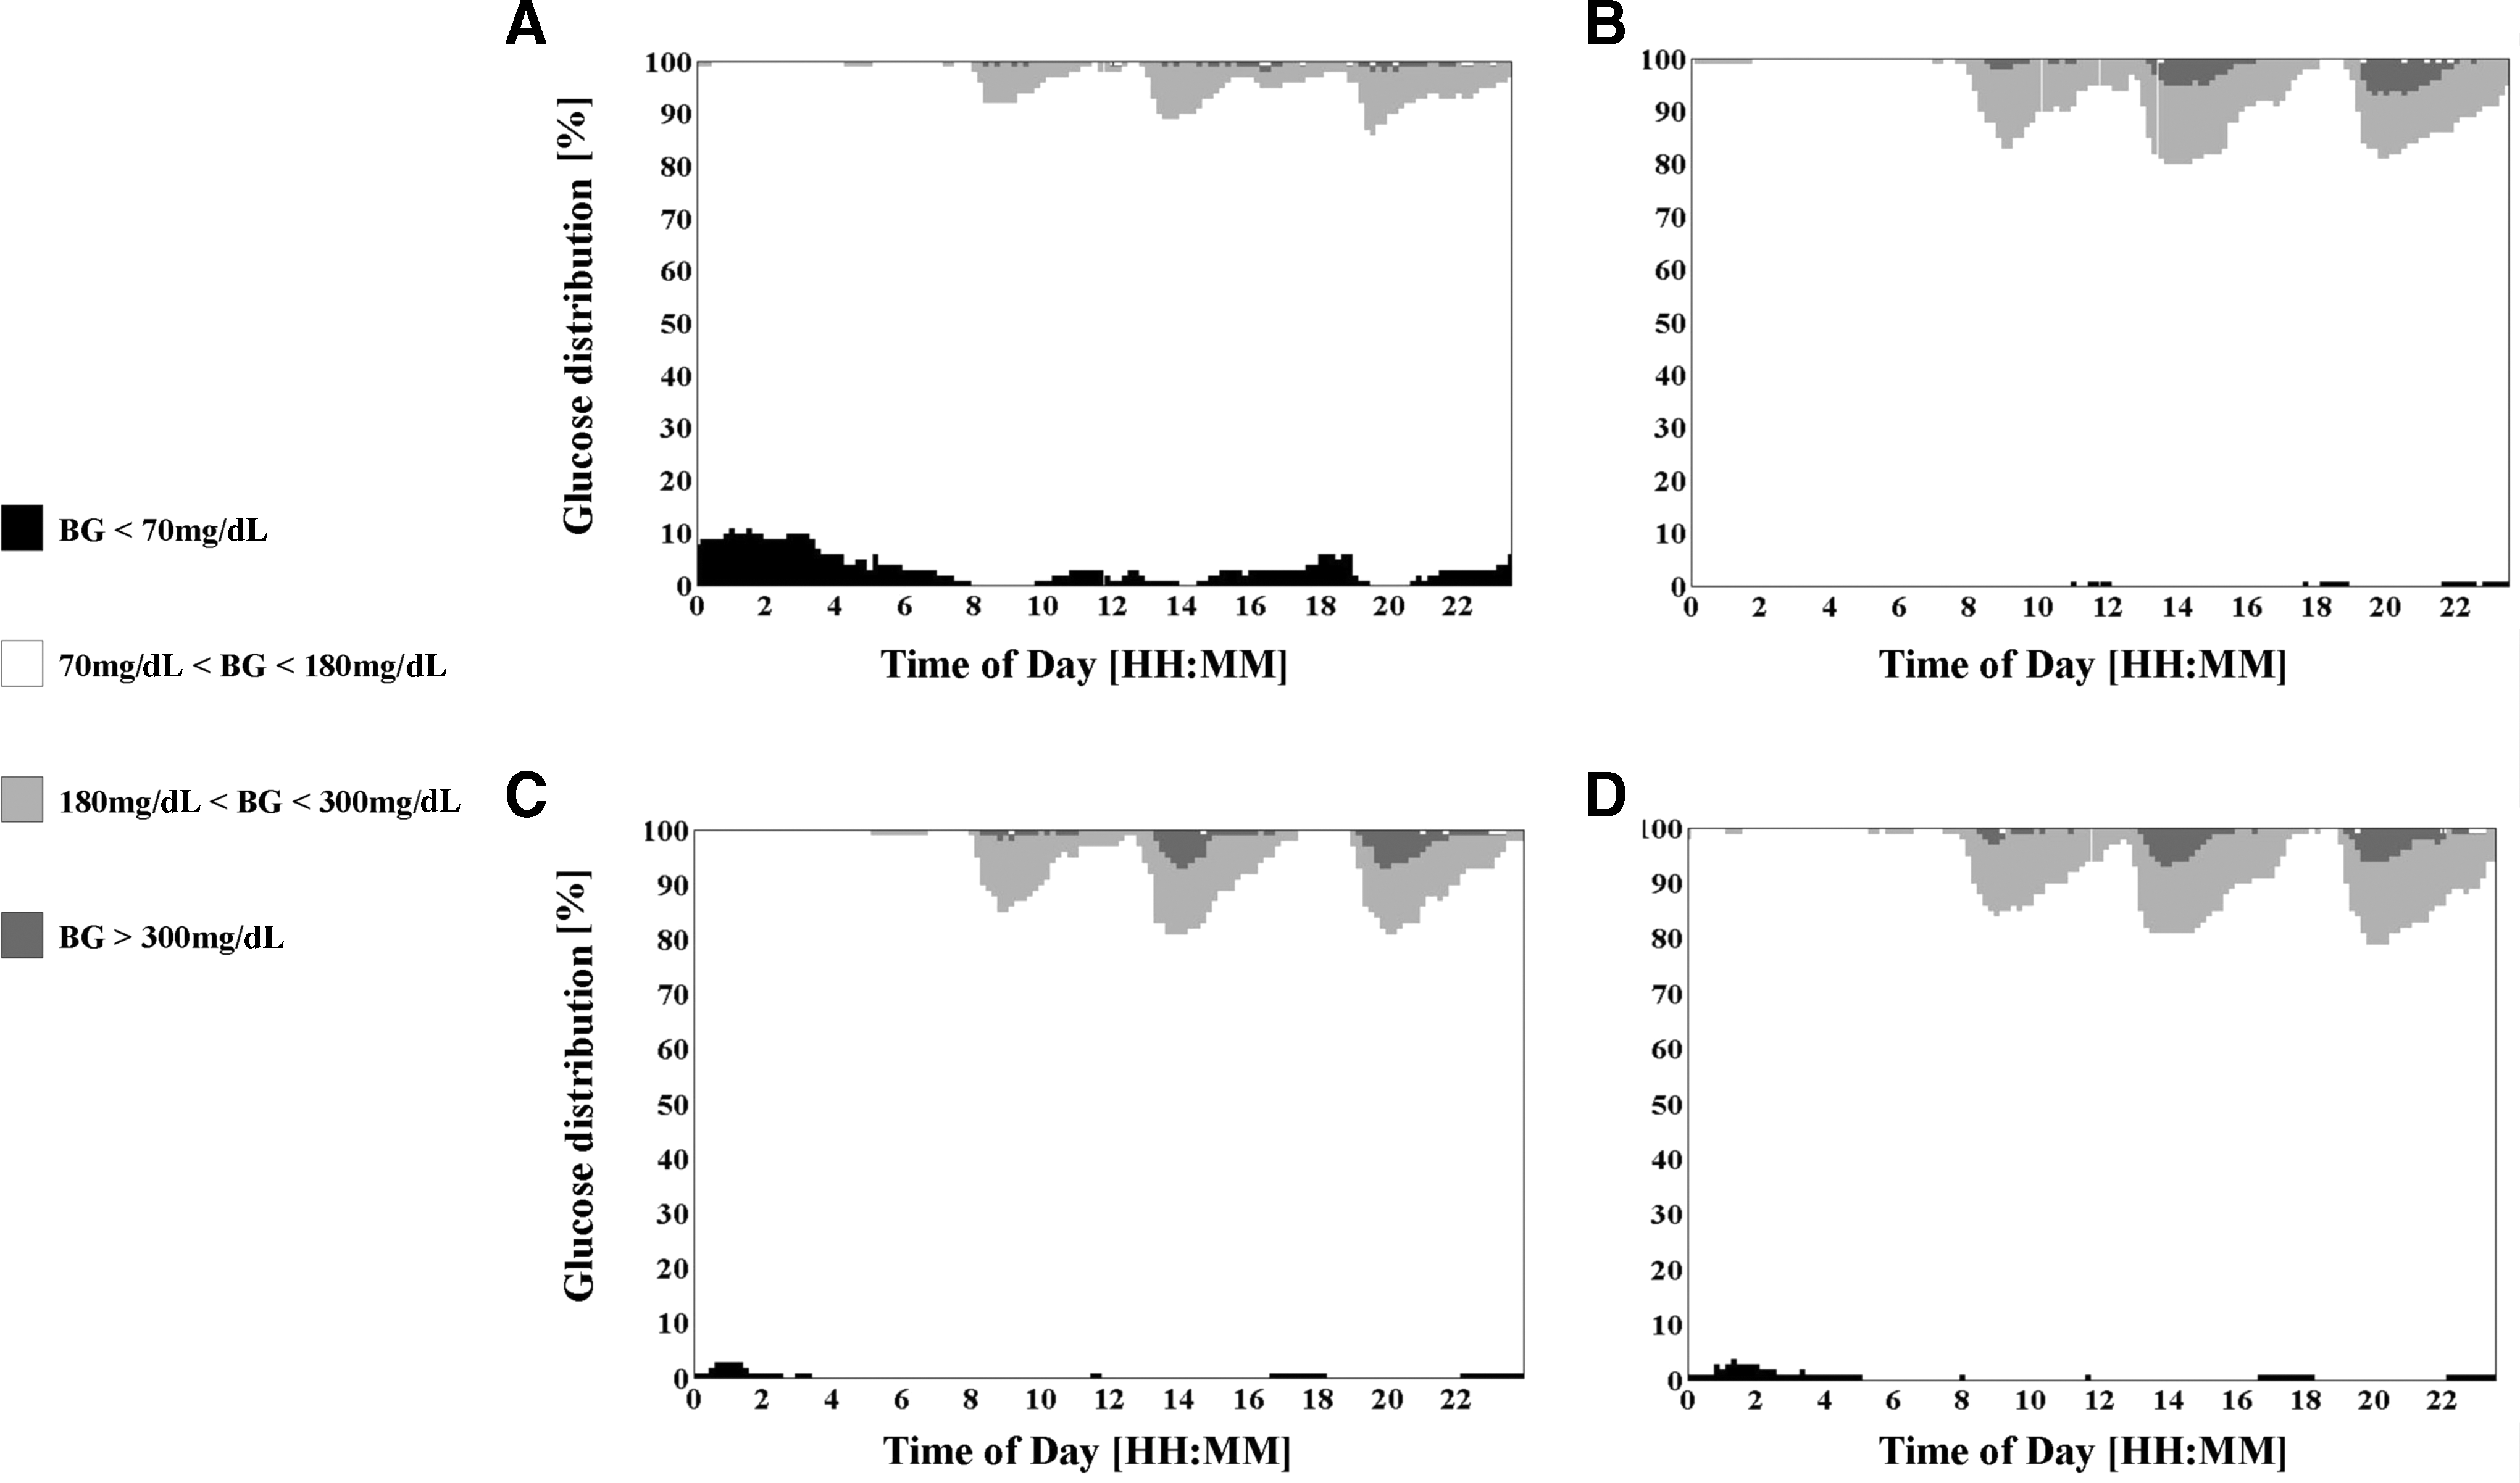
Glucose distribution by time for Experiments 3–5 (30-patient cohort). A stacked bar chart displaying the glucose distribution by time during the continuous 24-h period in conditions of changed insulin sensitivity for open-/closed-loop control for all three age groups. This figure is based on the method presented by Rodbard.
19
Estimates of percentage of values within any specified glucose range are obtained for a 10-min sliding time window for glucose data accumulated on each experiment day as follows: (
Discussion
We developed a learning algorithm with the ability for automatic deduction and adjustment of a patient's therapeutic management by means of a closed-loop system. This algorithm has the potential to overcome the within-patient variability in insulin sensitivity and thus optimize glucose control. In addition, the automated learning algorithm comprises a simple and standard method for characterizing the patient's profile for use in a closed-loop system, thus providing a practical tool for long-term operation of the MDLAP system on a large-scale population.
This learning algorithm is designed to serve as an independent tool that can be integrated into any closed-loop control system that uses patient-specific parameters.
The findings of the present in silico validation trial revealed that the learning algorithm can automatically establish the patient's glucose profile and insulin requirements. Integrating them into the MDLAP system led to either significant improvement in glucose control or maintained equivalent values during nominal and varying insulin sensitivity conditions. The learning integrated MDLAP system improved or did not impair glycemic control versus open-loop control strategy in almost all parameters tested. This result is directly related to the ability of the ILA and RLA to successfully learn the patient's profile from open-loop data and update it during close-loop, to improve glycemic control. This learning algorithm in a closed-loop control system was shown to be feasible for improving the control of glucose levels with the aim of future implication in the MDLAP system in the population with diabetes.
The University of Virginia/Padova simulator was previously used to validate the performances of learning algorithms for closed-loop systems. 13,14 This simulator has constant model parameters and thus cannot reproduce the inherent intra- and inter-day variability in insulin sensitivity, SC insulin absorption, glucose rate of appearance, and hepatic glucose production for in silico subjects. Wang et al. 14 used the simulator as is, but Magni et al. 13 changed two internal parameters of the simulator during the simulation in order to artificially create day-to-day variability of the insulin sensitivity. Because we were using the Food and Drug Administration–approved version of the simulator, we were not permitted to make such modifications on the cohort of 300 virtual patients. Thus, we implemented the method proposed by Magni et al. 13 in a different version of the simulator that included a cohort of 30 virtual patients. The comparison between the MDLAP system with and without the RLA (Experiments 4–6) shows the significant added value of the RLA to the MDLAP system. In both closed-loop sessions, the risk for hypoglycemia was reduced compared with open-loop, but glycemic control in the learning MDLAP system was significantly better than without the learning. This strengthens our conclusion that this algorithm has the potential to overcome the within-patient variability in insulin sensitivity and thus optimize glucose control. However, these results should be interpreted with some caution because other factors that affect the glucose–insulin dynamics were constant during simulations.
During closed-loop control (Experiment 2) there was no significant elevation of perBG <50 in all age groups, but results show that there was a significant increase in perBG 50–70 (children, P<0.001; adolescents and adults, P<0.0001). When comparing results of perBG 50–70 between open-loop (Experiment 1) and Day 6 of closed-loop control, no significant change was found (Table 1). The range 50–70 mg/dL mostly includes normal glucose concentrations, as was recently published by the Juvenile Diabetes Research Foundation Continuous Glucose Monitoring study group. 20 It is interesting that the percentage of time the glucose levels remained within 50–70 mg/dL in our study in all age groups was similar to respective results in normal subjects. Therefore, one may conclude that the increase from Day 1 to Day 6 of closed-loop control has no clinical significance. These results emphasize the potential the proposed system has to improve glucose control without increasing the danger of hypoglycemia.
The simulator population is based on real individual data, spanning the observed variability of key parameters in the general population. 8 Children and adolescents are renowned for having difficulty in controlling their glucose levels. This is mostly related to the difference in insulin sensitivity and unpredictable behavior of glucose–insulin dynamics in these groups. 21 Thus, during open-loop, when we used the simulator preset parameters, adults achieved better glucose control than children and adolescents. When the learning integrated closed-loop system was introduced and the patient profile was changed according to the learning algorithm, glucose control for children and adolescents groups were significantly improved (on Experiment 2, Day 1-6). In the adult group the AP system preserved the good glucose control.
Comparing our results to other studies is somewhat difficult because of the differences in closed-loop mode of operation (i.e., full closed-loop vs. hybrid) and in the population used for simulation. Patek et al. 9 suggested using the results achieved in the Juvenile Diabetes Research Foundation randomized clinical trial of continuous glucose monitoring 22 as a benchmark performance for conventional treatment for children, adolescents, and adults. During conventional treatment, perBG 70–180 was less than 60% for all age groups, perBG >180 was more than 35%, perBG 50–70 was between 2% and 4%, and perBG <50 was between 1% and 2%. Our findings compare favorably with the stated conventional treatment. Lee et al. 11 used the cohort of 100 adults and 100 adolescents to validate their AP system based on different MPC algorithms. While evaluating the MPC algorithm, perBG 70–180 was 83% and 72% for the adult and adolescent groups, respectively. These findings are similar to ours for the adult group, whereas in the adolescent group we achieved 66% of time within range (Experiment 2, Day 1). However, when activating the RLA our system reached better outcomes in terms of perBG 70–180 (Table 1). For similar reasons, comparison with studies who validated other learning algorithms, for example, the study by Magni et al., 13 may be complicated by the fact that the MPC algorithm that was used in the previous study was operated on top of the open-loop basal/bolus therapy, whereas we used a fully closed-loop AP system.
In conclusion, the learning algorithm described herein represents an important and promising tool for automated characterization of a patient's profile for an AP system. Clinical trials are warranted in order to validate our findings.
Appendix
MDLAP
The MDLAP system is a full closed-loop system (i.e., insulin is administered according to the glucose readings in a fully automated manner without information on the size or time of meals). In order to imitate the reasoning of diabetes caregivers, the MDLAP system was designed using traditional treatment principles.
The MDLAP system uses an individual patient's treatment management, which includes the patient's physical characteristics, insulin delivery regimen (insulin basal plan and insulin correction factor), and insulin pharmacodynamics parameters. The treatment management is extracted from prerecorded data that include SC continuous glucose sensor readings, glucometer measurements, insulin treatment, and activity diary that were recorded during the patient's everyday regular therapy at home (i.e., “home care”).
The system applies a combination of two control strategies: control to range and control to target. The control to range strategy is implemented in the Control to Range Module (CRM), which aims at bringing the patient's glucose levels into the desired range. The CRM is a fuzzy logic controller that uses treatment rules that were phased in in collaboration with the medical staff. The declared goal of the rules was to keep the glucose levels stable within the 80–120 mg/dL range. The rules use four inputs that are calculated from SC continuous glucose sensor readings: past and future glucose trends as well as current and future glucose levels. Each rule has two outputs: (1) change in basal rate and (2) portion of insulin bolus (in percentage from the patient's basal plan and the calculated bolus, respectively).
The Control to Target Module (CTM) aims to bring the patient's glucose to a specific target level. In order to reach the final dosing recommendation, the CTM take into consideration (1) the recommendation of the CRM (in percentage), (2) the predefined glucose target level, (3) insulin dosing regimen history, and (4) safety constraints related to the insulin pharmacodynamics. Because the MDLAP is a full closed-loop system, the CTM uses a detector in order to identify special glucose dynamics indicative of a sign of events that require special treatment, such as meals. As a result, it adjusts the dosing accordingly.
Both the patient's treatment management and the performance of the controller are adjustable, making it easier for the system to deal with inter- and intrapatient variability.
The glycemic control modification algorithm
This algorithm is being used by both the ILA and the RLA algorithm. The input for this algorithm contains sections of data periods (from 2 to 24 h) that are termed Logs, together with the CCI that was used during these sections, termed {CCIi
, Logi
}. The last data period and CCI are denoted as CCI
end,Log
end. The algorithm analyzes the glucose control over Log
end in order to verify whether changes in the patient's profile are required. The analysis includes the percentage of time glucose levels were maintained within normal range of 70–180 mg/dL (perBG
70–180), when they went below that range (perBG
<70), and when they rose above it (perBG
>180). It also assesses the minimum sensor value (S
min), the maximum sensor value (S
max), and the mean of glucose values (S
mean). When glucose control values fall within the predefined parameters (e.g., perBG
70–180) for at least 80% of the time with no hypoglycemia, there is no “learning” of the CCI. In the event that there is a need to change the CCI, the appropriate algorithm is activated. If S
min is <70 mg/dL, an impending state of hypoglycemia (blood glucose <70 mg/dL) is assumed, whereupon the CCI will be increased so that the system delivers less insulin. The maximum sensor level that precedes S
min is delineated and denoted as
When S
min is >70 mg/dL, CCI
Recommended is calculated so that it takes into account the time blood glucose is maintained within the range of 90–140 mg/dL, the S
max, and the S
mean. The algorithm is designed to maximize time spent within the glucose target range of 90–140 mg/dL. This target range was chosen since, based on our previous experience with closed-loop system design, it was found to be safe.
5
The sensor readings are analyzed to produce an argument v that maximizes the number of sensor readings between v and v+50 mg/dL. After identifying v, the factor A
sn is described by
In addition, in order to minimize sensor levels >180 mg/dL, CCI
Recommended can be adjusted according to the S
max by
The final element in adjusting CCI
Recommended is the S
mean, which can be used in the attempt to reach the desired mean sensor level of 140 mg/dL by
Using Eqs. A2
–A4, the CCI
Recommended can be defined as:
where
Safety constraints algorithm for the ILA
The CCI
Init holds some risks for hypoglycemic events because it is the first time we shift from homecare treatment to closed-loop monitoring. In an effort to minimize those risks, we limit the CCI
Init and thus restrict the insulin dose an AP can deliver. We calculate the following for each sample Si
(taken at time interval i) of the sensor in the input data set:
where AI i is the relevant insulin on board and BG target is the target level set by the controller. This calculation simulates the correction for any glucose level that rises above the set target.
If the result B est is larger than 0, we add it to an estimated bolus list (L) after which all elements in L are combined in order to arrive at the total estimated bolus insulin, E, during the estimation as detailed above. At this point, E is compared with the real total bolus the patient had self-administered during home care, B tot=ΣB.
If E>B tot,, we set CCI Init_restricted=(E/B tot)·CCI Init;, otherwise CCI Init_restricted=CCI Init.
Footnotes
Acknowledgments
The authors gratefully acknowledge the Juvenile Diabetes Research Foundation Artificial Pancreas Consortium (Dr. Aaron Kowalski from the Juvenile Diabetes Research Foundation, Prof. Boris Kovatchev from the University of Virginia, and Prof. Claudio Cobelli from Padua University) for allowing us to use the in silico simulator in this study. Mr. John Lum and Mr. Werner Sauer from the Jaeb Center for Health Research are acknowledged for running the simulations. The authors gratefully thank Dr. Michal Ajzensztejn for her help in editing this article.
Author Disclosure Statement
All authors have no potential financial interest or any commercial association that might have a potential conflict of interest. All authors declare that no competing financial interests exist.